Estimated zip code population in 2022: 58,834 Zip code population in 2010: 50,005 Zip code population in 2000: 38,577
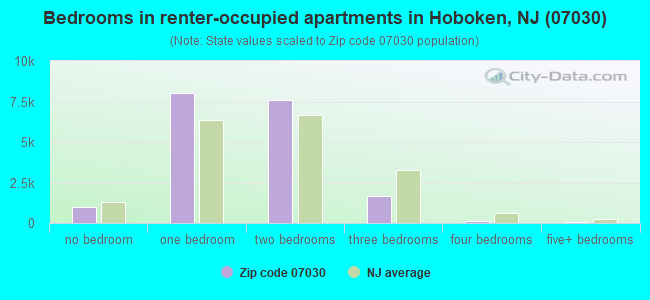
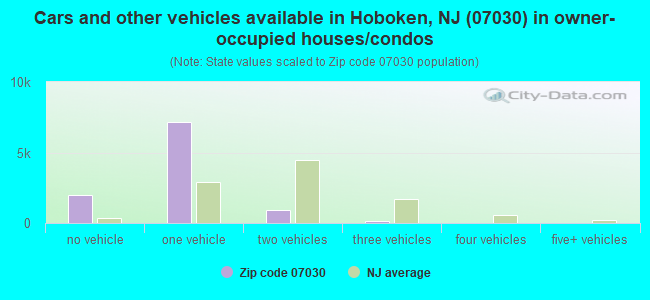
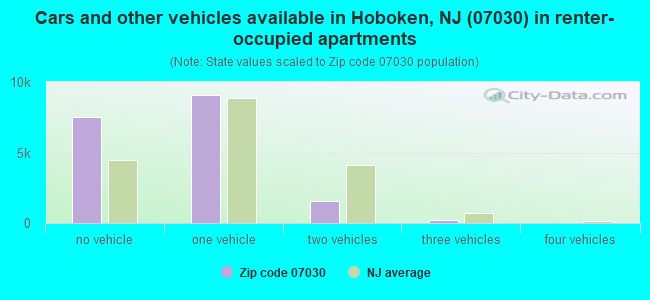
Houses and condos: 30,442 Renter-occupied apartments: 18,314
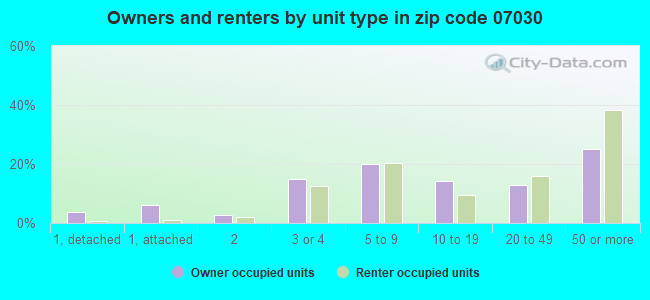
% of renters here:
65%
State:
35%
March 2022 cost of living index in zip code 07030: 120.6 (high, U.S. average is 100)
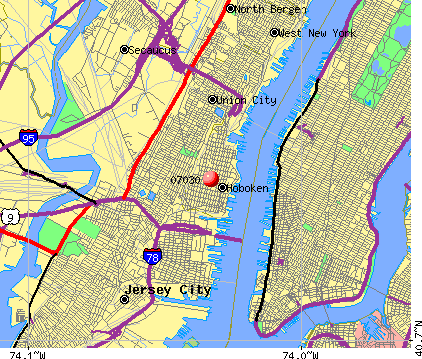
Land area: 1.3 sq. mi. Water area: 0.0 sq. mi.
Population density: 46,560 people per square mile
(very high).
OSM Map
Google Map
MSN Map
OSM Map
General Map
Google Map
MSN Map
OSM Map
Google Map
MSN Map
OSM Map
Google Map
MSN Map
Please wait while loading the map...
Real estate property taxes paid for housing units in 2022:
This zip code:
1.0% ($9,385)
New Jersey:
2.1% ($8,897)
Median real estate property taxes paid for housing units with mortgages in 2022: $9,435 (1.0%) Median real estate property taxes paid for housing units with no mortgage in 2022: $9,292 (1.1%)
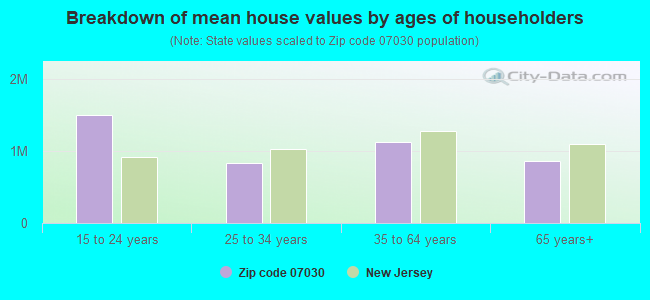
Estimated median house/condo value in 2022: $918,171
07030:
$918,171
New Jersey:
$428,900
According to our research of New Jersey and other state lists, there were 7 registered sex offenders living in 07030 zip code as of April 27, 2024. The ratio of all residents to sex offenders in zip code 07030 is 7,700 to 1. The ratio of registered sex offenders to all residents in this zip code is much lower than the state average.
Median resident age:
This zip code:
32.3 years
New Jersey median age:
40.4 years
Average household size:
This zip code:
2.0 people
New Jersey:
2.6 people
Averages for the 2020 tax year for zip code 07030, filed in 2021:
Average Adjusted Gross Income (AGI) in 2020: $193,193 (Individual Income Tax Returns)
Here:
$193,193
State:
$95,247
Salary/wage: $164,642 (reported on 91.3% of returns)
Here:
$164,642
State:
$80,635
(% of AGI for various income ranges: 1217.2% for AGIs below $25k, 3958.1% for AGIs $25k-50k, 7419.4% for AGIs $50k-75k, 11022.2% for AGIs $75k-100k, 20527.9% for AGIs $100k-200k, 132828.1% for AGIs over 200k)
Taxable interest for individuals: $2,757 (reported on 47.0% of returns)
This zip code:
$2,757
New Jersey:
$2,414
(% of AGI for various income ranges: 27.2% for AGIs below $25k, 33.3% for AGIs $25k-50k, 30.3% for AGIs $50k-75k, 36.7% for AGIs $75k-100k, 93.1% for AGIs $100k-200k, 1416.5% for AGIs over 200k)
Ordinary dividends: $6,134 (reported on 46.7% of returns)
Here:
$6,134
State:
$8,057
(% of AGI for various income ranges: 54.9% for AGIs below $25k, 60.7% for AGIs $25k-50k, 69.5% for AGIs $50k-75k, 105.2% for AGIs $75k-100k, 260.4% for AGIs $100k-200k, 3009.8% for AGIs over 200k)
Net capital gain/loss in AGI: +$50,331 (reported on 42.6% of returns)
Here:
+$50,331
State:
+$25,022
(% of AGI for various income ranges: 38.7% for AGIs below $25k, 88.5% for AGIs $25k-50k, 71.8% for AGIs $50k-75k, 167.1% for AGIs $75k-100k, 501.2% for AGIs $100k-200k, 27633.3% for AGIs over 200k)
Profit/loss from business: +$35,408 (reported on 13.6% of returns)
Here:
+$35,408
State:
+$18,035
(% of AGI for various income ranges: 163.9% for AGIs below $25k, 252.5% for AGIs $25k-50k, 183.9% for AGIs $50k-75k, 268.8% for AGIs $75k-100k, 492.0% for AGIs $100k-200k, 4491.5% for AGIs over 200k)
Taxable individual retirement arrangement distribution: $22,125 (reported on 3.9% of returns)
07030:
$22,125
New Jersey:
$21,558
(% of AGI for various income ranges: 37.6% for AGIs below $25k, 51.9% for AGIs $25k-50k, 53.7% for AGIs $50k-75k, 66.4% for AGIs $75k-100k, 176.3% for AGIs $100k-200k, 554.9% for AGIs over 200k)
Self-employed (Keogh) retirement plans: $32,800 (reported on 2.0% of returns)
07030:
$32,800
New Jersey:
$30,844
(% of AGI for various income ranges: 14.4% for AGIs $25k-50k, 20.8% for AGIs $75k-100k, 38.8% for AGIs $100k-200k, 750.4% for AGIs over 200k)
Total itemized deductions: $36,190 (reported on 20.3% of returns)
Here:
$36,190
State:
$32,863
(% of AGI for various income ranges: 70.9% for AGIs below $25k, 162.3% for AGIs $25k-50k, 157.8% for AGIs $50k-75k, 292.3% for AGIs $75k-100k, 907.7% for AGIs $100k-200k, 7346.8% for AGIs over 200k)
Charity contributions: $6,500 (reported on 16.8% of returns)
Here:
$6,500
State:
$7,880
(% of AGI for various income ranges: 3.8% for AGIs below $25k, 15.2% for AGIs $25k-50k, 17.1% for AGIs $50k-75k, 23.9% for AGIs $75k-100k, 91.8% for AGIs $100k-200k, 1220.3% for AGIs over 200k)
Taxes paid: $9,610 (reported on 20.3% of returns)
07030:
$9,610
State:
$9,183
(% of AGI for various income ranges: 17.3% for AGIs below $25k, 42.4% for AGIs $25k-50k, 58.0% for AGIs $50k-75k, 113.1% for AGIs $75k-100k, 355.1% for AGIs $100k-200k, 1659.0% for AGIs over 200k)
Earned income credit: $1,764 (reported on 4.7% of returns)
Here:
$1,764
State:
$2,148
(% of AGI for various income ranges: 72.3% for AGIs below $25k, 33.4% for AGIs $25k-50k)
Percentage of individuals using paid preparers for their 2020 taxes: 95.7%
Here:
96%
State:
92%
(% for various income ranges: 92.0% for AGIs below $25k, 95.6% for AGIs $25k-50k, 95.7% for AGIs $50k-75k, 96.4% for AGIs $75k-100k, 96.0% for AGIs $100k-200k, 97.0% for AGIs over 200k)
Averages for the 2012 tax year for zip code 07030, filed in 2013:
Average Adjusted Gross Income (AGI) in 2012: $126,236 (Individual Income Tax Returns)
Here:
$126,236
State:
$79,688
Salary/wage: $116,895 (reported on 92.6% of returns)
Here:
$116,895
State:
$68,122
(% of AGI for various income ranges: 74.2% for AGIs below $25k, 90.6% for AGIs $25k-50k, 93.9% for AGIs $50k-75k, 93.0% for AGIs $75k-100k, 91.6% for AGIs $100k-200k, 80.4% for AGIs over 200k)
Taxable interest for individuals: $1,491 (reported on 48.2% of returns)
This zip code:
$1,491
New Jersey:
$2,193
(% of AGI for various income ranges: 1.2% for AGIs below $25k, 0.4% for AGIs $25k-50k, 0.4% for AGIs $50k-75k, 0.3% for AGIs $75k-100k, 0.4% for AGIs $100k-200k, 0.7% for AGIs over 200k)
Ordinary dividends: $4,271 (reported on 35.9% of returns)
Here:
$4,271
State:
$6,828
(% of AGI for various income ranges: 2.3% for AGIs below $25k, 1.0% for AGIs $25k-50k, 0.8% for AGIs $50k-75k, 0.7% for AGIs $75k-100k, 1.0% for AGIs $100k-200k, 1.5% for AGIs over 200k)
Net capital gain/loss in AGI: +$11,205 (reported on 29.3% of returns)
Here:
+$11,205
State:
+$15,358
(% of AGI for various income ranges: 0.1% for AGIs below $25k, 0.1% for AGIs $25k-50k, 0.2% for AGIs $50k-75k, 0.4% for AGIs $75k-100k, 0.7% for AGIs $100k-200k, 4.5% for AGIs over 200k)
Profit/loss from business: +$25,220 (reported on 13.3% of returns)
Here:
+$25,220
State:
+$19,577
(% of AGI for various income ranges: 9.8% for AGIs below $25k, 4.0% for AGIs $25k-50k, 2.3% for AGIs $50k-75k, 2.0% for AGIs $75k-100k, 2.5% for AGIs $100k-200k, 2.5% for AGIs over 200k)
Taxable individual retirement arrangement distribution: $18,617 (reported on 4.1% of returns)
07030:
$18,617
New Jersey:
$18,214
(% of AGI for various income ranges: 1.8% for AGIs below $25k, 0.7% for AGIs $25k-50k, 0.5% for AGIs $50k-75k, 0.6% for AGIs $75k-100k, 0.6% for AGIs $100k-200k, 0.6% for AGIs over 200k)
Self-employment retirement plans: $25,070 (reported on 1.5% of returns)
07030:
$25,070
New Jersey:
$24,511
(% of AGI for various income ranges: 0.2% for AGIs $25k-50k, 0.2% for AGIs $75k-100k, 0.2% for AGIs $100k-200k, 0.4% for AGIs over 200k)
Total itemized deductions: $34,135 (16% of AGI, reported on 46.3% of returns)
Here:
$34,135
State:
$30,827
Here:
15.9% of AGI
State:
21.2% of AGI
(% of AGI for various income ranges: 11.6% for AGIs below $25k, 6.3% for AGIs $25k-50k, 6.6% for AGIs $50k-75k, 9.7% for AGIs $75k-100k, 13.9% for AGIs $100k-200k, 14.1% for AGIs over 200k)
Charity contributions: $2,878 (reported on 37.5% of returns)
Here:
$2,878
State:
$3,451
(% of AGI for various income ranges: 0.5% for AGIs below $25k, 0.4% for AGIs $25k-50k, 0.5% for AGIs $50k-75k, 0.8% for AGIs $75k-100k, 0.9% for AGIs $100k-200k, 1.0% for AGIs over 200k)
Taxes paid: $19,894 (reported on 46.2% of returns)
07030:
$19,894
State:
$15,801
(% of AGI for various income ranges: 3.1% for AGIs below $25k, 1.8% for AGIs $25k-50k, 2.5% for AGIs $50k-75k, 4.4% for AGIs $75k-100k, 7.4% for AGIs $100k-200k, 9.2% for AGIs over 200k)
Earned income credit: $1,836 (reported on 5.7% of returns)
Here:
$1,836
State:
$2,182
(% of AGI for various income ranges: 4.4% for AGIs below $25k, 0.3% for AGIs $25k-50k)
Percentage of individuals using paid preparers for their 2012 taxes: 59.7%
Here:
60%
State:
65%
(% for various income ranges: 57.7% for AGIs below $25k, 54.3% for AGIs $25k-50k, 51.3% for AGIs $50k-75k, 56.5% for AGIs $75k-100k, 63.0% for AGIs $100k-200k, 76.2% for AGIs over 200k)
Averages for the 2004 tax year for zip code 07030, filed in 2005:
Average Adjusted Gross Income (AGI) in 2004: $86,385 (Individual Income Tax Returns)
Here:
$86,385
State:
$64,921
Salary/wage: $81,156 (reported on 92.2% of returns)
Here:
$81,156
State:
$57,755
(% of AGI for various income ranges: 149.3% for AGIs below $10k, 81.8% for AGIs $10k-25k, 93.2% for AGIs $25k-50k, 93.9% for AGIs $50k-75k, 93.2% for AGIs $75k-100k, 82.6% for AGIs over 100k)
Taxable interest for individuals: $1,243 (reported on 55.5% of returns)
This zip code:
$1,243
New Jersey:
$2,068
(% of AGI for various income ranges: 9.3% for AGIs below $10k, 1.9% for AGIs $10k-25k, 0.7% for AGIs $25k-50k, 0.6% for AGIs $50k-75k, 0.5% for AGIs $75k-100k, 0.8% for AGIs over 100k)
Taxable dividends: $2,341 (reported on 35.5% of returns)
Here:
$2,341
State:
$3,959
(% of AGI for various income ranges: 6.9% for AGIs below $10k, 1.1% for AGIs $10k-25k, 0.7% for AGIs $25k-50k, 0.6% for AGIs $50k-75k, 0.7% for AGIs $75k-100k, 1.1% for AGIs over 100k)
Net capital gain/loss: +$13,410 (reported on 29.8% of returns)
Here:
+$13,410
State:
+$13,591
(% of AGI for various income ranges: -2.3% for AGIs below $10k, 0.3% for AGIs $10k-25k, 0.1% for AGIs $25k-50k, 0.3% for AGIs $50k-75k, 0.5% for AGIs $75k-100k, 7.3% for AGIs over 100k)
Profit/loss from business: +$16,927 (reported on 12.5% of returns)
Here:
+$16,927
State:
+$17,520
(% of AGI for various income ranges: 17.8% for AGIs below $10k, 6.5% for AGIs $10k-25k, 3.0% for AGIs $25k-50k, 2.3% for AGIs $50k-75k, 2.2% for AGIs $75k-100k, 2.2% for AGIs over 100k)
IRA payment deduction: $2,795 (reported on 2.5% of returns)
07030:
$2,795
New Jersey:
$3,270
(% of AGI for various income ranges: 0.5% for AGIs below $10k, 0.3% for AGIs $10k-25k, 0.2% for AGIs $25k-50k, 0.1% for AGIs $50k-75k, 0.1% for AGIs $75k-100k, 0.0% for AGIs over 100k)
Self-employed pension: $15,679 (reported on 1.4% of returns)
Here:
$15,679
New Jersey:
$17,258
(% of AGI for various income ranges: 0.1% for AGIs $10k-25k, 0.1% for AGIs $25k-50k, 0.1% for AGIs $50k-75k, 0.2% for AGIs $75k-100k, 0.3% for AGIs over 100k)
Total itemized deductions: $22,468 (15% of AGI, reported on 43.8% of returns)
Here:
$22,468
State:
$23,924
Here:
15.3% of AGI
State:
21.1% of AGI
(% of AGI for various income ranges: 19.7% for AGIs below $10k, 7.3% for AGIs $10k-25k, 6.9% for AGIs $25k-50k, 10.2% for AGIs $50k-75k, 12.7% for AGIs $75k-100k, 12.4% for AGIs over 100k)
Charity contributions deductions: $2,434 (2% of AGI, reported on 38.5% of returns)
Here:
$2,434
State:
$3,242
Here:
1.6% of AGI
State:
2.7% of AGI
(% of AGI for various income ranges: 0.8% for AGIs below $10k, 0.6% for AGIs $10k-25k, 0.8% for AGIs $25k-50k, 1.1% for AGIs $50k-75k, 1.2% for AGIs $75k-100k, 1.2% for AGIs over 100k)
Total tax: $17,735 (reported on 89.4% of returns)
07030:
$17,735
State:
$12,321
(% of AGI for various income ranges: 5.8% for AGIs below $10k, 5.1% for AGIs $10k-25k, 10.4% for AGIs $25k-50k, 14.4% for AGIs $50k-75k, 15.7% for AGIs $75k-100k, 21.7% for AGIs over 100k)
Earned income credit: $1,463 (reported on 6.4% of returns)
Here:
$1,463
State:
$1,711
Percentage of individuals using paid preparers for their 2004 taxes: 63.1%
Here:
63%
State:
65%
(% for various income ranges: 57.8% for AGIs below $10k, 63.7% for AGIs $10k-25k, 58.3% for AGIs $25k-50k, 59.7% for AGIs $50k-75k, 62.6% for AGIs $75k-100k, 72.7% for AGIs over 100k)
Likely homosexual households (counted as self-reported same-sex unmarried-partner households)
Lesbian couples: 0.1% of all households
Gay men: 0.3% of all households
Household received Food Stamps/SNAP in the past 12 months: 1,725 Household did not receive Food Stamps/SNAP in the past 12 months: 26,666
Women who had a birth in the past 12 months: 1,118 (1,032 now married, 99 unmarried) Women who did not have a birth in the past 12 months: 18,799 (6,765 now married, 12,056 unmarried)
Housing units in zip code 07030 with a mortgage: 7,743 (592 second mortgage, 597 both second mortgage and home equity loan) Houses without a mortgage: 37
Median monthly owner costs for units with a mortgage: $3,744 Median monthly owner costs for units without a mortgage: $1,412
Residents with income below the poverty level in 2022:
This zip code:
7.9%
Whole state:
9.7%
Residents with income below 50% of the poverty level in 2022:
This zip code:
3.8%
Whole state:
5.2%
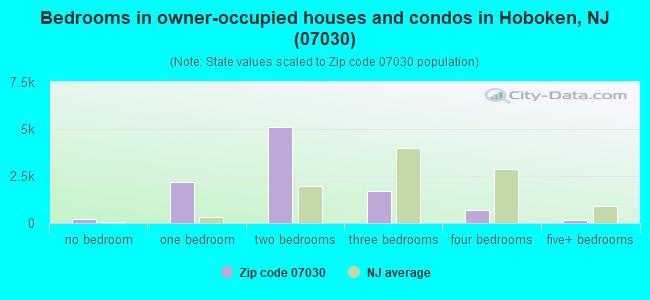
Median number of rooms in houses and condos:
Here:
3.9
State:
6.8
Median number of rooms in apartments:
Here:
3.3
State:
3.9
Notable locations in this zip code not listed on our city pages
Notable locations in zip code 07030: Hoboken Terminal (A), Frank Sinatra's Birthplace (B), Castle Stevens (C), Pier A (D), Pier B (E), Pier C (F), Pier 1 (G), Hoboken Historical Museum (H), Monroe Center for the Arts (I), Hoboken Board of Education (J), Hoboken Volunteer Ambulance (K), Hoboken Public Library (L), Hoboken City Garage (M), Hoboken City Hall (N), Multi-Service Community Center (O), Hoboken Fire Department Museum (P), Hoboken Engine Company Number 4 (Q), Hoboken Rescue Company Number 1 (R), Hoboken Engine Company Number 3 (S), Hoboken Fire Department Ladder Company 1 / Engine Company 3 (T). Display/hide their locations on the map
Churches in zip code 07030 include: Church of God of Prophecy (A), Hoboken Church of God of Prophecy (B), Saint John's Lutheran Church (C), Our Lady of Grace Church (D), Societa Madonna Dei Martiri Church (E), Saint Francis Church (F), Saint Francis Parish and Youth Center (G), Community Church of Hoboken (H), Plymouth Brethern Gospel Church (I). Display/hide their locations on the map
Parks in zip code 07030 include: Elysian Park (1), Columbus Park (2), Elysian Park (3), Roller Rink Park (4), Pier A Park (5), Sinatra Park (6), Legion Park (7), Lackawanna Park (8), Elysian Fields (9). Display/hide their locations on the map
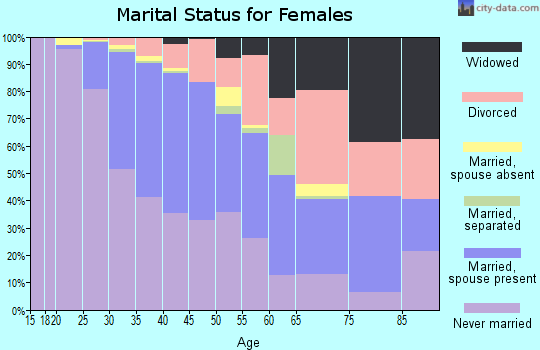
6,384 married couples with children.
2,066 single-parent households (281 men, 1,785 women).
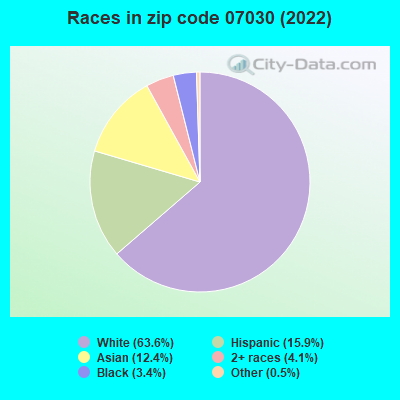
71.7% of residents of 07030 zip code speak English at home.
11.0% of residents speak Spanish at home (67% very well, 14% well, 12% not well, 6% not at all).
9.0% of residents speak other Indo-European language at home (91% very well, 4% well, 4% not well, 1% not at all).
5.8% of residents speak Asian or Pacific Island language at home (79% very well, 17% well, 2% not well, 2% not at all).
1.6% of residents speak other language at home (85% very well, 14% well, 1% not well).
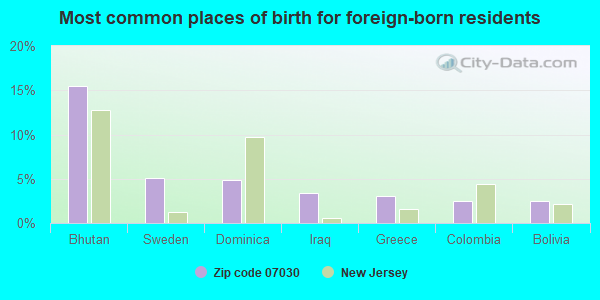
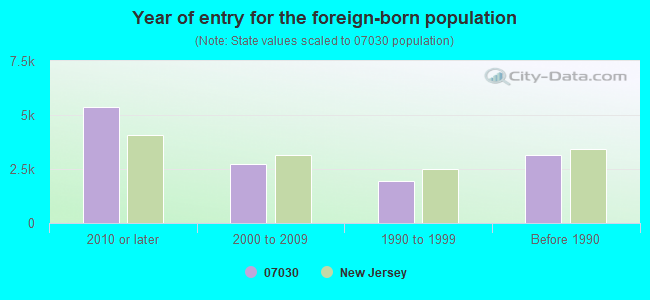
Foreign born population: 11,750 (20.0%) (49.8% of them are naturalized citizens)
Major facilities with environmental interests located in this zip code:
NORTH HUDSON SEWERAGE AUTH WWTP (1600 ADAMS ST in HOBOKEN, NJ)
(Integrated Compliance Information System) - ICIS-02-1998-0179, FORMAL ENFORCEMENT ACTION, ICIS-02-1998-0112, ICIS-02-1978-0019, ICIS-02-1985-0071, STATE MASTER (New Jersey environmental info) - NJEMS-09536, LAB CERTIFICATION - NON-COMMERCIAL ENVIRONMENTAL LAB, NJEMS-014353, STATE CLEANUP SITE, NJEMS-023926, NJEMS-10601, AIR PROGRAM, NJEMS-1398, MINERAL EXPLORATION, NJEMS-19961, LABORATORY CERTIFICATION, NJEMS-46440, National Pollutant Discharge Elimination System Permit National Pollutant Discharge Elimination System MAJOR (Tracking pollutant discharge elimination systems) - permit - ICIS-, ENFORCEMENT/COMPLIANCE ACTIVITY, ICIS-02-2005-3205, ICIS-02-2005-3306, (Resource Conservation and Recovery Act (tracking hazardous waste)) Large Quantity Generators, more that 1000 kg of hazardous waste/month (Resource Conservation and Recovery Act (tracking hazardous waste)) Business SIC classification: SEWERAGE SYSTEMS Organizations: HOBOKEN UNION CITY WEEHAWKEN SEWERAGE AUTH, OPERATIONS MGT INTERNATIONAL, NORTH HUDSON SEWAGE AUTHORITY (CONTACT/OPERATOR)
, HOBOKEN-UNION CITY-WEEHAWKEN (CONTACT/OWNER)
, HOBOKEN UNION CITY WEEHAWKEN SEWERAGE AUTH (CONTACT/OWNER)
, HOBOKEN CITY (CONTACT/OWNER)
Alternative names: HOBOKEN UNION CITY WEEHAWKEN SEWAGE AUTH, NORTH HUDSON SEWAGE AUTHORITY, NORTH HUDSON SEWER AUTH WWTP
COMPLIANCE ACTIVITY (Tracking inspections of insecticide, fungicide, and rodenticide, and toxic substances) STATE MASTER (New Jersey environmental info) - NJEMS-12040, AIR PROGRAM, NJEMS-50510, National Pollutant Discharge Elimination System Permit, NJEMS-G000041978, STATE CLEANUP SITE National Pollutant Discharge Elimination System NON-MAJOR (Tracking pollutant discharge elimination systems) - permit (Resource Conservation and Recovery Act (tracking hazardous waste)) HAZARDOUS WASTE BIENNIAL REPORTER (Resource Conservation and Recovery Act (tracking hazardous waste)) Business SIC classification: TAXICABS Business NAICS classification: COMMUTER RAIL SYSTEMS. Organizations: NJ TRANSIT AUTH ENVIRONMENTAL SERVICES UNIT, RIVERDALE ARMY NAT'L GUARD ORG (CONTACT/OWNER)
, NJ TRANSIT CORP (CONTACT/OWNER)
Alternative names: HOBOKEN NJ LOCOMOTIVE, NJ TRANSIT AUTHORITY/HOBOKEN STATIONYARD, NJ TRANSIT - HOBOKEN, NJ TRANSIT HOBOKEN RAIL YARD, NJ TRANSIT HOBOKEN YARD, NJ TRANSITY/HOBOKEN STATIONYARD
GREEN CLEANERS (302 GARDEN STREET in HOBOKEN, NJ)
AIR MINOR (AIRS/AFS) - ICIS-, ENFORCEMENT/COMPLIANCE ACTIVITY STATE MASTER (New Jersey environmental info) - NJEMS-85871800000, EPCRA, NJEMS-L1174, AIR PROGRAM Small Quantity Generators, between 100 kg and 1000 kg of hazardous waste/month (Resource Conservation and Recovery Act (tracking hazardous waste)) - notification Business SIC classification: DRYCLEANING PLANTS, EXCEPT RUG CLEANING Organizations: RAYS CLEANERS, GREEN CLEANERS LLC, JANG CLEANERS INC (CONTACT/OWNER)
Alternative names: JANG CLEANERS INC, RAYS ONE HOUR CLEANERS, RAYS CLEANERS JANGS CLEANERS INC
ALBEE SERVICES INC (410 8TH STREET in HOBOKEN, NJ)
AIR MINOR (AIRS/AFS) STATE MASTER (New Jersey environmental info) - NJEMS-022149, STATE CLEANUP SITE Large Quantity Generators, more that 1000 kg of hazardous waste/month (Resource Conservation and Recovery Act (tracking hazardous waste)) - notification (Resource Conservation and Recovery Act (tracking hazardous waste)) Business SIC classification: COATING, ENGRAVING, AND ALLIED SERVICES Organizations: CATHARTES HOLDINGS NJ LLC (CONTACT/OWNER)
, HARSHAD SHAM (CONTACT/OWNER)
, SHAH HK (CONTACT/OWNER)
Alternative names: ALBEE SERVICES SITE - FORMER, CARNIVAL SPRAYING CO INC
ADAMS STREET URBAN RENEWAL (1100 ADAMS ST in HOBOKEN, NJ)
STATE MASTER (New Jersey environmental info) - NJEMS-257397, STATE CLEANUP SITE STATE MASTER (New Jersey environmental info) - NJEMS-025817, STATE CLEANUP SITE, NJEMS-NJD049180433, HAZARDOUS WASTE PROGRAM Small Quantity Generators, between 100 kg and 1000 kg of hazardous waste/month (Resource Conservation and Recovery Act (tracking hazardous waste)) Organizations: ATLANTIC STEAMERS, ATLANTIC STEAMERS SUPPLY CO DE INC (CONTACT/OPERATOR)
, ADAMS STREET REALTY (CONTACT/OWNER)
, BARNET LISS (CONTACT/OWNER)
Alternative names: 1100 ADAMS STREET URBAN RENEWAL, ATLANTIC STEAMERS, ATLANTIC STEAMERS SUPPLY CO
GENERAL FOODS CORP MAXWELL HOUSE COFFEE DIV (1125 HUDSON STREET in HOBOKEN, NJ)
AIR MINOR (AIRS/AFS) CRITERIA AND HAZARDOUS AIR POLLUTANT INVENTORY (Inventory of air pollution sources) STATE MASTER (New Jersey environmental info) - NJEMS-010958, STATE CLEANUP SITE, NJEMS-0905-03-0001.1, LAND USE - COASTAL AND LAND USE, NJEMS-NJD001613827, HAZARDOUS WASTE PROGRAM (Resource Conservation and Recovery Act (tracking hazardous waste)) TRI REPORTER (Tracking of toxic chemicals releasing facilities) Business SIC classification: ROASTED COFFEE; FOOD PREPARATIONS Business NAICS classification: ALL OTHER MISCELLANEOUS FOOD MANUFACTURING. Organizations: 1101-1125 HUDSON STREET LLC, PT MAXWELL LLC, GENERAL FOODS MFG CORP (CONTACT/OWNER)
Alternative names: MAXWELL HOUSE COFFEE CO., MAXWELL HOUSE COFFEE DIV GENER, MAXWELL HOUSE COFFEE DIV GENERAL FOODS
HOBOKEN CITY HALL (94 WASHINGTON STREET in HOBOKEN, NJ)
AIR MONITORING SITE (Airborne pollution emission tracking) STATE MASTER (New Jersey environmental info) - NJEMS-033144, STATE CLEANUP SITE, NJEMS-0905001, DRINKING WATER PROGRAM, NJEMS-202018, National Pollutant Discharge Elimination System Permit National Pollutant Discharge Elimination System NON-MAJOR (Tracking pollutant discharge elimination systems) - permit Organizations: HOBOKEN WATER SERVICES Alternative names: SITE ID 340171001
BP SERVICE STATION #60584 (1400 PARK AVENUE in HOBOKEN, NJ)
AIR MINOR (AIRS/AFS) STATE MASTER (New Jersey environmental info) - NJEMS-00701101021, EPCRA, NJEMS-009652, STATE CLEANUP SITE, NJEMS-024405, NJEMS-A1319, AIR PROGRAM (Resource Conservation and Recovery Act (tracking hazardous waste)) Business SIC classification: PETROLEUM BULK STATIONS AND TERMINALS; GASOLINE SERVICE STATIONS Organizations: BP AMOCO OIL CORP, BP PRODUCTS NORTH AMERICA, BP PRODUCTS NORTH AMERICA INC (CONTACT/OWNER)
Alternative names: AMOCO STATION 60584, AMOCO SERVICE STATION #60584, SERV-GAR INC.
HOBOKEN CITY BD OF ED CALABRO SCHOOL (524 PARK AVE in HOBOKEN, NJ)
(National Center for Education Statistics) - STATE ID-063 STATE MASTER (New Jersey environmental info) - NJEMS-025076, STATE CLEANUP SITE, NJEMS-12385, AIR PROGRAM Business SIC classification: ELEMENTARY AND SECONDARY SCHOOLS Alternative names: SALVATORE R CALABRO NO 4
PORT AUTH NY/NJ HOBOKEN MARINE TERMINAL FORMER (325 RIVER STREET in HOBOKEN, NJ) . Federal Facility. DEPARTMENT OF COMMERCE
AIR MINOR (AIRS/AFS) STATE MASTER (New Jersey environmental info) - NJEMS-006300, STATE CLEANUP SITE, NJEMS-015101, NJEMS-017665, (Resource Conservation and Recovery Act (tracking hazardous waste)) Business SIC classification: ADMINISTRATION OF GENERAL ECONOMIC PROGRAMS Organizations: CHEVRON USA INC (CONTACT/OWNER)
Alternative names: DEPT COMMRCE-HOBOKEN, PORT AUTHORITY OF NEW YORK & NEW JERSEY, PORT AUTH OF NY & NJ - HOBOKEN PIERS H
FERGUSON PROPELLER INC (1132 CLINTON STREET in HOBOKEN, NJ)
AIR MINOR (AIRS/AFS) STATE MASTER (New Jersey environmental info) - NJEMS-000318, STATE CLEANUP SITE (Resource Conservation and Recovery Act (tracking hazardous waste)) TRI REPORTER (Tracking of toxic chemicals releasing facilities) Alternative names: FERGUSON PROPELLER & RECONDITIONING INCORPORATED
ACADEMY LINES INC BUS TOURS (1515 JEFFERSON STREET in HOBOKEN, NJ)
STATE MASTER (New Jersey environmental info) - NJEMS-030397, STATE CLEANUP SITE, NJEMS-12544, AIR PROGRAM, NJEMS-232480, National Pollutant Discharge Elimination System Permit, NJEMS-256853, REFUSE DISPOSAL (Resource Conservation and Recovery Act (tracking hazardous waste)) Business SIC classification: LOCAL BUS CHARTER SERVICE; BUS CHARTER SERVICE, EXCEPT LOCAL Organizations: ACADEMY BUS TOURS INC, ACADEMY EXPRESS, ACADEMY BUSSES, TFR LLC, ACADEMY BUS TOURS INC (CONTACT/OWNER)
Alternative names: ACADEMY BUS TOURS INC, ACADEMY BUS TOURSINCORPORATED
ANTHONY DELL AQUILA ENTERPRISES (1500 HUDSON ST in HOBOKEN, NJ)
STATE MASTER (New Jersey environmental info) - NJEMS-016773, STATE CLEANUP SITE, NJEMS-11317, AIR PROGRAM, NJEMS-205267, REFUSE DISPOSAL, NJEMS-213562, Large Quantity Generators, more that 1000 kg of hazardous waste/month (Resource Conservation and Recovery Act (tracking hazardous waste)) - notification Organizations: JDA DEVELOPMENT CORP, DELLACUILA ENTERPRISES, A&R SALVAGE CLOTHING CORP, BDLJ ASSOCIATES LLC (CONTACT/OWNER)
, DELLAQUILA ANTHONY (CONTACT/OWNER)
Alternative names: B D L J ASSOCIATES LLC
Housing units lacking complete plumbing facilities: 0.1% Housing units lacking complete kitchen facilities: 0.4%
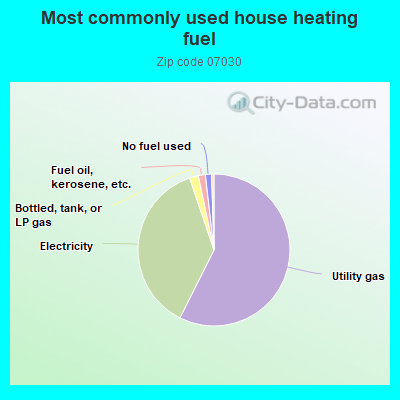
57.4%Utility gas
37.4%Electricity
1.9%Bottled, tank, or LP gas
1.5%Fuel oil, kerosene, etc.
1.3%No fuel used
Population in 1990: 33,397. Population change in the 1990s: +5,180 (+15.5%).
Place of birth for U.S.-born residents:
This state: 21,871
Northeast: 17,227
Midwest: 1,988
South: 3,228
West: 1,819
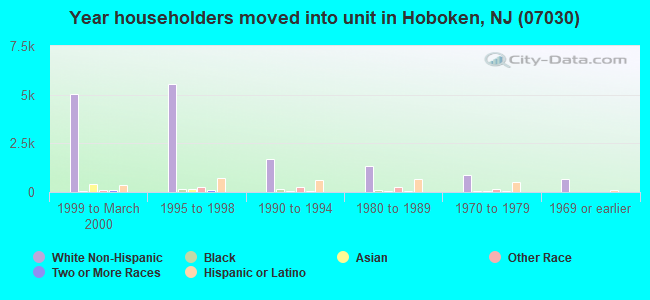
45% of the 07030 zip code residents lived in the same house 5 years ago. Out of people who lived in different houses, 28% lived in this county. Out of people who lived in different counties, 50% lived in New Jersey.
81% of the 07030 zip code residents lived in the same house 1 year ago. Out of people who lived in different houses, 42% moved from this county. Out of people who lived in different houses, 17% moved from different county within same state. Out of people who lived in different houses, 35% moved from different state. Out of people who lived in different houses, 7% moved from abroad.
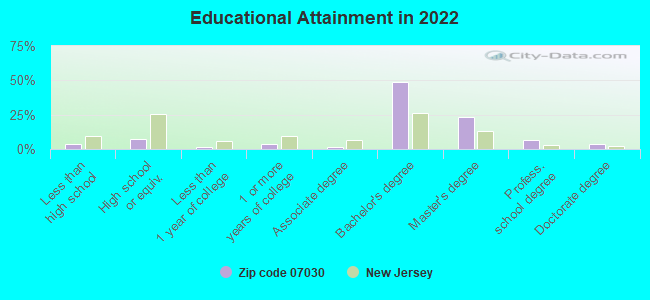
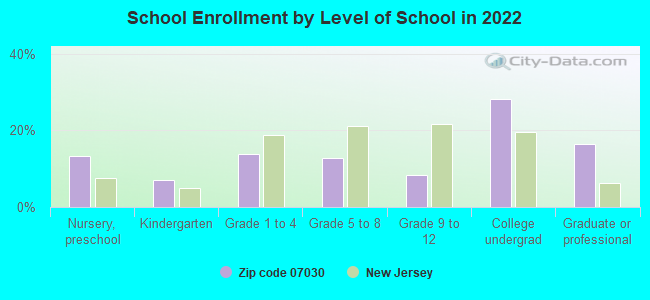
Private vs. public school enrollment:
Students in private schools in grades 1 to 8 (elementary and middle school): 623
Here:
21.8%
New Jersey:
12.3%
Students in private schools in grades 9 to 12 (high school): 352
Here:
38.9%
New Jersey:
13.1%
Students in private undergraduate colleges: 2,627
Here:
83.2%
New Jersey:
33.2%
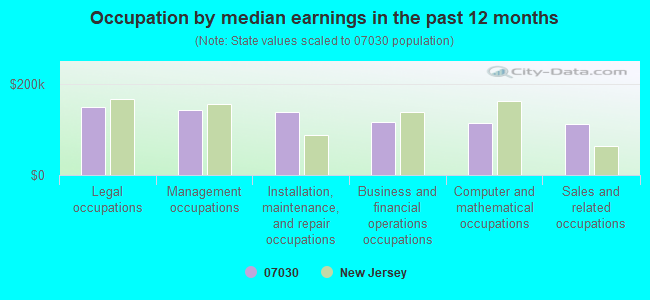
Occupation by median earnings in the past 12 months ($)
149,480Legal occupations
142,127Management occupations
137,359Installation, maintenance, and repair occupations
116,918Business and financial operations occupations
114,967Computer and mathematical occupations
111,180Sales and related occupations
Companies with biggest federal contracts located in this zip code (HOBOKEN, NJ):
STEVENS INSTITUTE OF TECHNOLOG (CASTLE POINT ON HUDSON) : $49,789,261 in 123 contractsfrom 2000 to 2006
Contracts for Engineering and Technical Services, Education -- Engineering Development (R&D), Maintenance, Repair and Rebuilding of Equipment -- Instruments and Laboratory Equipment, Ammunition -- Operational Systems Development (R&D), and moreby Army, Air Force, NASA, Navy, and others Signed by year:2000: $7,297,012; 2001: $8,600,597; 2002: $8,519,406; 2003: $6,398,674; 2004: $8,249,972; 2005: $9,533,036; 2006: $1,190,564.
Biggest contracts:
$4,093,097 with Army for Engineering and Technical Services. Signed on 2000-07-27. Completion date: 2001-09-30.
$4,064,150, same as above.Signed on 2004-06-07. Completion date: 2005-12-30.
$2,910,000 with Army for Education -- Engineering Development (R&D). Signed on 2005-07-15. Completion date: 2006-09-30.
$2,897,190 with Army for Engineering and Technical Services. Signed on 2003-06-20. Completion date: 2005-02-14.
SIMS PUMP VALVE COMPANY, INC (1314 PARK AVE; small business) 50 employees, $0 revenue: $3,536,487 in 63 contractsfrom 2000 to 2006
Contracts for Power and Hand Pumps, Non-nuclear Ship Repair (East) Ship repair (including overhauls and conversions) performed on non-nuclear propelled and nonpropelled ships east of the 108th meridian, Miscellaneous Items, Non-nuclear Ship Repair (West) Ship repair (including overhauls and conversions) performed on. non-nuclear propelled and nonpropelled ships west of the 108th meridian, and moreby Navy, Defense Logistics Agency, U.S. Coast Guard Signed by year:2000: $32,972; 2001: $0; 2002: $822,270; 2003: $279,796; 2004: $476,408; 2005: $1,505,429; 2006: $419,612.
Biggest contracts:
$277,800 with Navy for Power and Hand Pumps. Taking place in VA. Signed on 2005-07-06. Completion date: 2006-07-06.
$265,860, same as above.Signed on 2005-07-06. Completion date: 2006-07-06.
$250,000 with Navy for Non-nuclear Ship Repair (East) Ship repair (including overhauls and conversions) performed on non-nuclear propelled and nonpropelled ships east of the 108th meridian. Signed on 2002-10-01. Completion date: 2002-12-13.
$226,676 with Navy for Power and Hand Pumps. Taking place in VA. Signed on 2005-02-07. Completion date: 2006-02-07.
PLASMASOL CORP (614 RIVER STREET; small business) : $2,794,049 in 20 contractsfrom 2001 to 2005
Contracts for Services -- Basic Research (R&D), Aeronautics and Space Technology -- Advanced Development (R&D), Other Defense -- Operational Systems Development (R&D), Pollution Control and Abatement -- Basic Research (R&D), and moreby Navy, NASA, EPA Signed by year:2000: $0; 2001: $70,000; 2002: $559,000; 2003: $1,145,695; 2004: $522,251; 2005: $497,103; 2006: $0.
Biggest contracts:
$739,721 with Navy for Services -- Basic Research (R&D). Signed on 2003-05-08. Completion date: 2005-11-10.
$439,000 with NASA for Aeronautics and Space Technology -- Advanced Development (R&D). Signed on 2002-02-15. Completion date: 2003-03-15.
$397,251 with Navy for Services -- Basic Research (R&D). Signed on 2004-05-10. Completion date: 2004-10-12.
$300,000 with Navy for Other Defense -- Operational Systems Development (R&D). Signed on 2005-05-10. Completion date: 2006-06-30.
INTELLIGENT SENSING TECHNOLOGI (610 RIVER TER; small business) : $780,719 in 4 contractsfrom 2003 to 2005
$349,082 with Navy for Defense Electronics and Communication Equipment -- Applied Research and Exploratory Development (R&D). Signed on 2005-05-16. Completion date: 2006-09-28.
$331,783, same as above.Signed on 2004-09-28. Completion date: 2006-09-28.
$69,860, same as above.Signed on 2003-07-25. Completion date: 2003-12-31.
$29,994, same as above.Signed on 2004-06-02. Completion date: 2003-12-31.
PLASMION CORPORATION (50 HARRISON ST; small business) : $729,757 in 2 contractsin 2002
$365,000 with Army for Defense Missile and Space Systems -- Advanced Development (R&D). Signed on 2002-03-18. Completion date: 2004-03-17.
$364,757, same as above.Signed on 2002-08-16. Completion date: 2004-03-17.
UNION DRY DOCK & REPAIR CO (51 NEWARK ST; small business)
$244,210 with U.S. Army Corps of Engineers - civil program financing only for Maintenance, Repair or Alteration of Real Property -- Ammunition Facilities. Taking place in NY. Signed on 2002-09-23. Completion date: 2002-11-15.
HYDROGLOBE, LLC (612 RIVER STREET; small business)
$97,539 with Army for Subsistence -- Operational Systems Development (R&D). Signed on 2002-02-12. Completion date: 2002-10-31.
CUNNINGHAM MARINE HYDRAULICS C (1714 WILLOW AVENUE; small business) : $91,175 in 11 contractsfrom 2001 to 2005
Contracts for Miscellaneous Ship and Marine Equipment, Technical Representation Services -- Valves, Non-nuclear Ship Repair (East) Ship repair (including overhauls and conversions) performed on non-nuclear propelled and nonpropelled ships east of the 108th meridian, Technical Representation Services -- Ship and Marine Equipment by Navy, U.S. Army Corps of Engineers - civil program financing only, Army, Maritime Administration, and others Signed by year:2000: $0; 2001: $32,975; 2002: $9,178; 2003: $0; 2004: $2,364; 2005: $46,658; 2006: $0.
Biggest contracts:
$32,975 with Navy for Miscellaneous Ship and Marine Equipment. Signed on 2001-06-19. Completion date: 2001-06-19.
$19,633 with U.S. Army Corps of Engineers - civil program financing only for Technical Representation Services -- Valves. Taking place in PA. Signed on 2005-08-15. Completion date: 2005-08-10.
$19,633 with Army for Technical Representation Services -- Valves. Taking place in PA. Signed on 2005-08-15. Completion date: 2005-08-10.
$7,000 with Maritime Administration for Non-nuclear Ship Repair (East) Ship repair (including overhauls and conversions) performed on non-nuclear propelled and nonpropelled ships east of the 108th meridian. Signed on 2002-08-15. Completion date: 2002-08-15.
HOBOKEN WEB SERVICES, LLC (80 RIVER ST 5TH FL; small business)
$70,090 with Air Force for Other ADP and Telecommunications Services (includes data storage on tapes, compact disks, etc.). Taking place in AL. Signed on 2004-10-01. Completion date: 2005-09-30.
XCEEDIUM, INC (1101 GRAND STREET; small business) : $46,988 in 2 contractsfrom 2004 to 2005
$24,933 with Navy for Telephone and Telegraph Equipment. Taking place in MD. Signed on 2004-07-26. Completion date: 2004-08-16.
$22,055 with Navy for ADPE System Configuration. Taking place in MD. Signed on 2005-08-09. Completion date: 2006-07-25.
Top industries in this zip code by the number of employees in 2005:
2002 - 2018 National Fire Incident Reporting System (NFIRS) incidents
Based on the data from the years 2002 - 2018 the average number of fire incidents per year is 189. The highest number of reported fires - 252 took place in 2017, and the least - 86 in 2002. The data has a rising trend.
When looking into fire subcategories, the most incidents belonged to: Structure Fires (65.1%), and Outside Fires (21.1%).
Fire incident types reported to NFIRS in Zip Code 07030


 Nearest zip codes: 07310, 07087, 07311, 07086, 07307, 10014.


 Based on the data from the years 2002 - 2018 the average number of fire incidents per year is 189. The highest number of reported fires - 252 took place in 2017, and the least - 86 in 2002. The data has a rising trend.
 When looking into fire subcategories, the most incidents belonged to: Structure Fires (65.1%), and Outside Fires (21.1%).