Estimated zip code population in 2022: 6,676 Zip code population in 2010: 6,263 Zip code population in 2000: 6,186
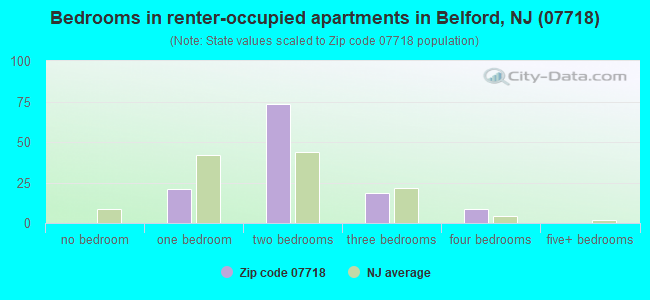
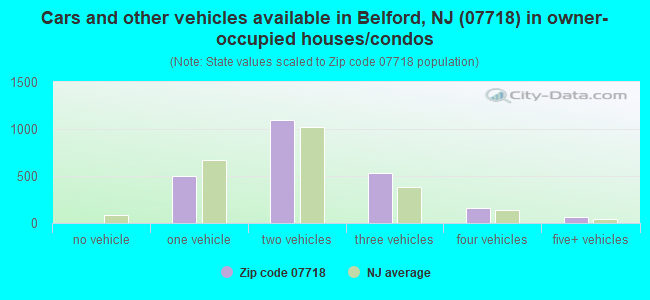
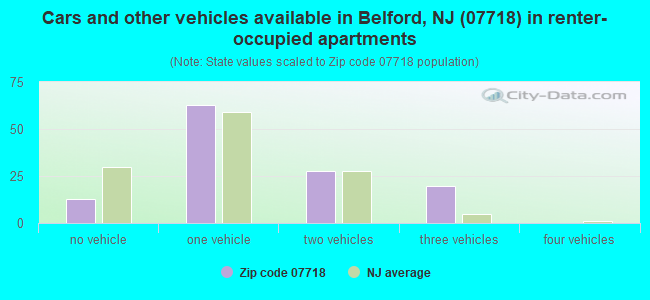
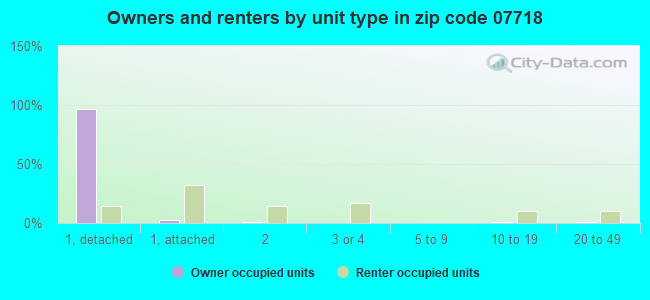
Houses and condos: 2,469 Renter-occupied apartments: 123
% of renters here:
5%
State:
35%
March 2022 cost of living index in zip code 07718: 115.7 (more than average, U.S. average is 100)
Land area: 2.1 sq. mi. Water area: 0.0 sq. mi.
Population density: 3,131 people per square mile
(average).
OSM Map
Google Map
MSN Map
OSM Map
General Map
Google Map
MSN Map
OSM Map
Google Map
MSN Map
OSM Map
Google Map
MSN Map
Please wait while loading the map...
Real estate property taxes paid for housing units in 2022:
This zip code:
1.7% ($8,319)
New Jersey:
2.1% ($8,897)
Median real estate property taxes paid for housing units with mortgages in 2022: $8,738 (1.7%) Median real estate property taxes paid for housing units with no mortgage in 2022: $7,774 (1.7%)
Business Search- 14 Million verified businesses
Males: 3,756
(56.3%)
Females: 2,919
(43.7%)
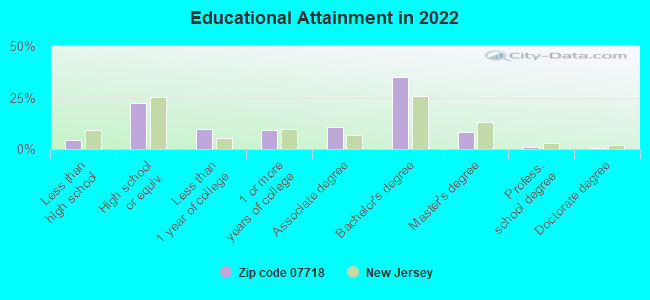
For population 25 years and over in 07718:
High school or higher: 95.8%
Bachelor's degree or higher: 44.0%
Graduate or professional degree: 9.3%
Unemployed: 3.8%
Mean travel time to work (commute): 38.9 minutes
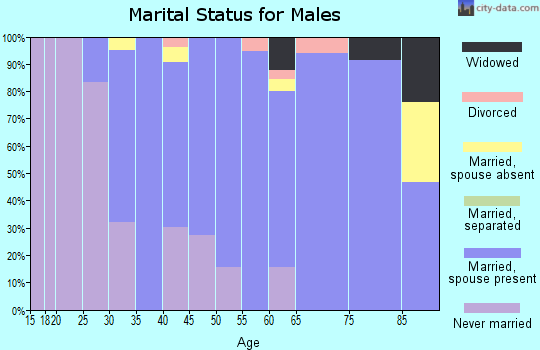
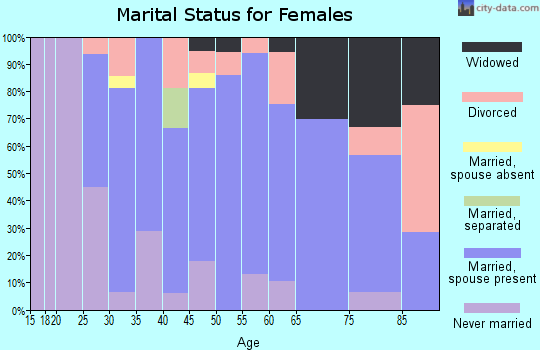
For population 15 years and over in 07718:
Never married: 24.8%
Now married: 59.8%
Separated: 0.7%
Widowed: 5.1%
Divorced: 9.6%
Zip code 07718 compared to state average:
Median household income above state average.
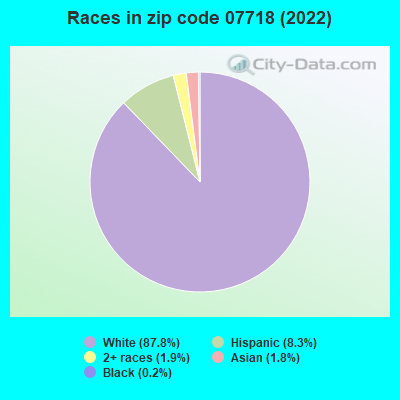
Black race population percentage significantly below state average.
Hispanic race population percentage below state average.
Foreign-born population percentage significantly below state average.
Renting percentage significantly below state average.
Length of stay since moving in significantly above state average.
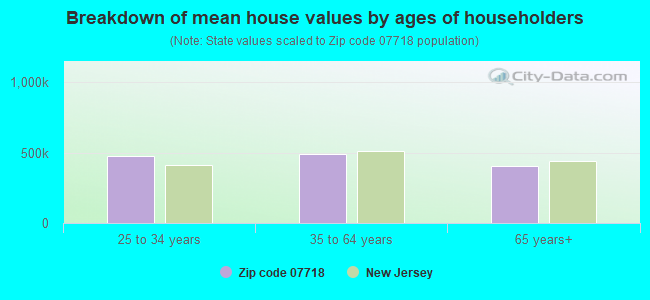
Estimated median house/condo value in 2022: $492,156
07718:
$492,156
New Jersey:
$428,900
According to our research of New Jersey and other state lists, there were 2 registered sex offenders living in 07718 zip code as of April 27, 2024. The ratio of all residents to sex offenders in zip code 07718 is 3,730 to 1. The ratio of registered sex offenders to all residents in this zip code is lower than the state average.
Median resident age:
This zip code:
40.8 years
New Jersey median age:
40.4 years
Average household size:
This zip code:
2.7 people
New Jersey:
2.6 people
Averages for the 2020 tax year for zip code 07718, filed in 2021:
Average Adjusted Gross Income (AGI) in 2020: $84,484 (Individual Income Tax Returns)
Here:
$84,484
State:
$95,247
Salary/wage: $77,570 (reported on 83.0% of returns)
Here:
$77,570
State:
$80,635
(% of AGI for various income ranges: 1120.6% for AGIs below $25k, 3642.2% for AGIs $25k-50k, 6494.2% for AGIs $50k-75k, 9417.6% for AGIs $75k-100k, 17796.2% for AGIs $100k-200k, 60462.2% for AGIs over 200k)
Taxable interest for individuals: $1,011 (reported on 34.7% of returns)
This zip code:
$1,011
New Jersey:
$2,414
(% of AGI for various income ranges: 20.2% for AGIs below $25k, 31.0% for AGIs $25k-50k, 36.4% for AGIs $50k-75k, 54.8% for AGIs $75k-100k, 97.7% for AGIs $100k-200k, 186.7% for AGIs over 200k)
Ordinary dividends: $2,551 (reported on 27.4% of returns)
Here:
$2,551
State:
$8,057
(% of AGI for various income ranges: 26.2% for AGIs below $25k, 65.5% for AGIs $25k-50k, 77.0% for AGIs $50k-75k, 142.4% for AGIs $75k-100k, 169.6% for AGIs $100k-200k, 465.6% for AGIs over 200k)
Net capital gain/loss in AGI: +$5,931 (reported on 21.6% of returns)
Here:
+$5,931
State:
+$25,022
(% of AGI for various income ranges: 9.8% for AGIs below $25k, 42.0% for AGIs $25k-50k, 47.6% for AGIs $50k-75k, 102.4% for AGIs $75k-100k, 191.3% for AGIs $100k-200k, 2876.7% for AGIs over 200k)
Profit/loss from business: +$13,037 (reported on 12.5% of returns)
Here:
+$13,037
State:
+$18,035
(% of AGI for various income ranges: 117.0% for AGIs below $25k, 105.2% for AGIs $25k-50k, 205.8% for AGIs $50k-75k, 223.6% for AGIs $75k-100k, 260.2% for AGIs $100k-200k, 1981.1% for AGIs over 200k)
Taxable individual retirement arrangement distribution: $17,921 (reported on 10.3% of returns)
07718:
$17,921
New Jersey:
$21,558
(% of AGI for various income ranges: 57.2% for AGIs below $25k, 144.0% for AGIs $25k-50k, 335.5% for AGIs $50k-75k, 339.6% for AGIs $75k-100k, 389.0% for AGIs $100k-200k, 1410.0% for AGIs over 200k)
Total itemized deductions: $26,079 (reported on 17.3% of returns)
Here:
$26,079
State:
$32,863
(% of AGI for various income ranges: 120.0% for AGIs below $25k, 306.8% for AGIs $25k-50k, 550.3% for AGIs $50k-75k, 854.4% for AGIs $75k-100k, 1245.4% for AGIs $100k-200k, 2940.0% for AGIs over 200k)
Charity contributions: $3,251 (reported on 14.9% of returns)
Here:
$3,251
State:
$7,880
(% of AGI for various income ranges: 26.5% for AGIs $25k-50k, 30.6% for AGIs $50k-75k, 91.2% for AGIs $75k-100k, 132.7% for AGIs $100k-200k, 520.0% for AGIs over 200k)
Taxes paid: $9,118 (reported on 17.0% of returns)
07718:
$9,118
State:
$9,183
(% of AGI for various income ranges: 31.1% for AGIs below $25k, 86.0% for AGIs $25k-50k, 193.0% for AGIs $50k-75k, 341.6% for AGIs $75k-100k, 442.3% for AGIs $100k-200k, 916.7% for AGIs over 200k)
Earned income credit: $1,668 (reported on 6.7% of returns)
Here:
$1,668
State:
$2,148
(% of AGI for various income ranges: 48.7% for AGIs below $25k, 34.5% for AGIs $25k-50k)
Percentage of individuals using paid preparers for their 2020 taxes: 92.4%
Here:
92%
State:
92%
(% for various income ranges: 88.5% for AGIs below $25k, 91.2% for AGIs $25k-50k, 92.0% for AGIs $50k-75k, 94.9% for AGIs $75k-100k, 93.9% for AGIs $100k-200k, 100.0% for AGIs over 200k)
Averages for the 2012 tax year for zip code 07718, filed in 2013:
Average Adjusted Gross Income (AGI) in 2012: $68,524 (Individual Income Tax Returns)
Here:
$68,524
State:
$79,688
Salary/wage: $63,752 (reported on 84.4% of returns)
Here:
$63,752
State:
$68,122
(% of AGI for various income ranges: 66.8% for AGIs below $25k, 68.2% for AGIs $25k-50k, 68.0% for AGIs $50k-75k, 75.7% for AGIs $75k-100k, 84.7% for AGIs $100k-200k, 84.1% for AGIs over 200k)
Taxable interest for individuals: $824 (reported on 39.4% of returns)
This zip code:
$824
New Jersey:
$2,193
(% of AGI for various income ranges: 1.4% for AGIs below $25k, 0.7% for AGIs $25k-50k, 0.8% for AGIs $50k-75k, 0.3% for AGIs $75k-100k, 0.3% for AGIs $100k-200k, 0.3% for AGIs over 200k)
Ordinary dividends: $2,119 (reported on 27.5% of returns)
Here:
$2,119
State:
$6,828
(% of AGI for various income ranges: 2.2% for AGIs below $25k, 1.8% for AGIs $25k-50k, 0.9% for AGIs $50k-75k, 0.9% for AGIs $75k-100k, 0.4% for AGIs $100k-200k, 1.2% for AGIs over 200k)
Net capital gain/loss in AGI: +$558 (reported on 16.6% of returns)
Here:
+$558
State:
+$15,358
(% of AGI for various income ranges: 0.1% for AGIs $75k-100k, 0.2% for AGIs $100k-200k, 0.6% for AGIs over 200k)
Profit/loss from business: +$13,932 (reported on 12.6% of returns)
Here:
+$13,932
State:
+$19,577
(% of AGI for various income ranges: 8.1% for AGIs below $25k, 4.6% for AGIs $25k-50k, 2.5% for AGIs $50k-75k, 1.8% for AGIs $75k-100k, 2.5% for AGIs $100k-200k)
Taxable individual retirement arrangement distribution: $14,056 (reported on 11.3% of returns)
07718:
$14,056
New Jersey:
$18,214
(% of AGI for various income ranges: 3.6% for AGIs below $25k, 2.4% for AGIs $25k-50k, 3.5% for AGIs $50k-75k, 2.6% for AGIs $75k-100k, 2.4% for AGIs $100k-200k)
Total itemized deductions: $24,224 (24% of AGI, reported on 53.6% of returns)
Here:
$24,224
State:
$30,827
Here:
24.0% of AGI
State:
21.2% of AGI
(% of AGI for various income ranges: 20.7% for AGIs below $25k, 16.9% for AGIs $25k-50k, 19.5% for AGIs $50k-75k, 20.8% for AGIs $75k-100k, 19.6% for AGIs $100k-200k, 14.8% for AGIs over 200k)
Charity contributions: $1,885 (reported on 47.4% of returns)
Here:
$1,885
State:
$3,451
(% of AGI for various income ranges: 0.8% for AGIs below $25k, 1.1% for AGIs $25k-50k, 1.5% for AGIs $50k-75k, 1.7% for AGIs $75k-100k, 1.3% for AGIs $100k-200k, 1.0% for AGIs over 200k)
Taxes paid: $10,543 (reported on 53.3% of returns)
07718:
$10,543
State:
$15,801
(% of AGI for various income ranges: 7.1% for AGIs below $25k, 6.3% for AGIs $25k-50k, 7.0% for AGIs $50k-75k, 8.3% for AGIs $75k-100k, 8.8% for AGIs $100k-200k, 9.0% for AGIs over 200k)
Earned income credit: $1,828 (reported on 8.3% of returns)
Here:
$1,828
State:
$2,182
(% of AGI for various income ranges: 3.3% for AGIs below $25k, 0.6% for AGIs $25k-50k)
Percentage of individuals using paid preparers for their 2012 taxes: 62.6%
Here:
63%
State:
65%
(% for various income ranges: 55.6% for AGIs below $25k, 59.3% for AGIs $25k-50k, 64.4% for AGIs $50k-75k, 68.6% for AGIs $75k-100k, 69.6% for AGIs $100k-200k, 66.7% for AGIs over 200k)
Averages for the 2004 tax year for zip code 07718, filed in 2005:
Average Adjusted Gross Income (AGI) in 2004: $57,643 (Individual Income Tax Returns)
Here:
$57,643
State:
$64,921
Salary/wage: $55,754 (reported on 86.6% of returns)
Here:
$55,754
State:
$57,755
(% of AGI for various income ranges: 95.7% for AGIs below $10k, 64.9% for AGIs $10k-25k, 77.3% for AGIs $25k-50k, 80.5% for AGIs $50k-75k, 87.2% for AGIs $75k-100k, 87.3% for AGIs over 100k)
Taxable interest for individuals: $931 (reported on 57.2% of returns)
This zip code:
$931
New Jersey:
$2,068
(% of AGI for various income ranges: 3.7% for AGIs below $10k, 2.9% for AGIs $10k-25k, 1.4% for AGIs $25k-50k, 0.9% for AGIs $50k-75k, 0.6% for AGIs $75k-100k, 0.6% for AGIs over 100k)
Taxable dividends: $1,265 (reported on 32.5% of returns)
Here:
$1,265
State:
$3,959
(% of AGI for various income ranges: 4.7% for AGIs below $10k, 2.7% for AGIs $10k-25k, 0.9% for AGIs $25k-50k, 0.7% for AGIs $50k-75k, 0.4% for AGIs $75k-100k, 0.4% for AGIs over 100k)
Net capital gain/loss: +$1,920 (reported on 22.5% of returns)
Here:
+$1,920
State:
+$13,591
(% of AGI for various income ranges: -3.0% for AGIs below $10k, 1.0% for AGIs $10k-25k, -0.3% for AGIs $25k-50k, -0.3% for AGIs $50k-75k, 0.5% for AGIs $75k-100k, 1.8% for AGIs over 100k)
Profit/loss from business: +$12,977 (reported on 11.6% of returns)
Here:
+$12,977
State:
+$17,520
(% of AGI for various income ranges: 5.9% for AGIs below $10k, 7.7% for AGIs $10k-25k, 3.7% for AGIs $25k-50k, 2.5% for AGIs $50k-75k, 2.3% for AGIs $75k-100k, 1.8% for AGIs over 100k)
IRA payment deduction: $3,227 (reported on 3.7% of returns)
07718:
$3,227
New Jersey:
$3,270
(% of AGI for various income ranges: 0.4% for AGIs $10k-25k, 0.4% for AGIs $25k-50k, 0.3% for AGIs $50k-75k, 0.2% for AGIs $75k-100k, 0.1% for AGIs over 100k)
Self-employed pension: $10,688 (reported on 0.5% of returns)
Here:
$10,688
New Jersey:
$17,258
Total itemized deductions: $19,921 (24% of AGI, reported on 57.7% of returns)
Here:
$19,921
State:
$23,924
Here:
24.3% of AGI
State:
21.1% of AGI
(% of AGI for various income ranges: 16.9% for AGIs below $10k, 21.4% for AGIs $10k-25k, 18.2% for AGIs $25k-50k, 21.5% for AGIs $50k-75k, 21.8% for AGIs $75k-100k, 18.7% for AGIs over 100k)
Charity contributions deductions: $2,072 (2% of AGI, reported on 53.8% of returns)
Here:
$2,072
State:
$3,242
Here:
2.5% of AGI
State:
2.7% of AGI
(% of AGI for various income ranges: 0.8% for AGIs below $10k, 1.8% for AGIs $10k-25k, 1.6% for AGIs $25k-50k, 2.0% for AGIs $50k-75k, 2.2% for AGIs $75k-100k, 1.9% for AGIs over 100k)
Total tax: $7,618 (reported on 83.4% of returns)
07718:
$7,618
State:
$12,321
(% of AGI for various income ranges: 3.1% for AGIs below $10k, 4.7% for AGIs $10k-25k, 7.7% for AGIs $25k-50k, 8.9% for AGIs $50k-75k, 9.5% for AGIs $75k-100k, 14.9% for AGIs over 100k)
Earned income credit: $1,508 (reported on 6.0% of returns)
Here:
$1,508
State:
$1,711
Percentage of individuals using paid preparers for their 2004 taxes: 60.5%
Here:
60%
State:
65%
(% for various income ranges: 46.3% for AGIs below $10k, 57.1% for AGIs $10k-25k, 60.3% for AGIs $25k-50k, 68.0% for AGIs $50k-75k, 65.8% for AGIs $75k-100k, 65.0% for AGIs over 100k)
Household received Food Stamps/SNAP in the past 12 months: 0 Household did not receive Food Stamps/SNAP in the past 12 months: 2,436
Women who had a birth in the past 12 months: 20 (21 now married, 0 unmarried) Women who did not have a birth in the past 12 months: 1,366 (886 now married, 473 unmarried)
Housing units in zip code 07718 with a mortgage: 1,468 (119 second mortgage, 122 both second mortgage and home equity loan) Houses without a mortgage: 34
Median monthly owner costs for units with a mortgage: $2,517 Median monthly owner costs for units without a mortgage: $996
Residents with income below the poverty level in 2022:
This zip code:
2.3%
Whole state:
9.7%
Residents with income below 50% of the poverty level in 2022:
This zip code:
0.4%
Whole state:
5.2%
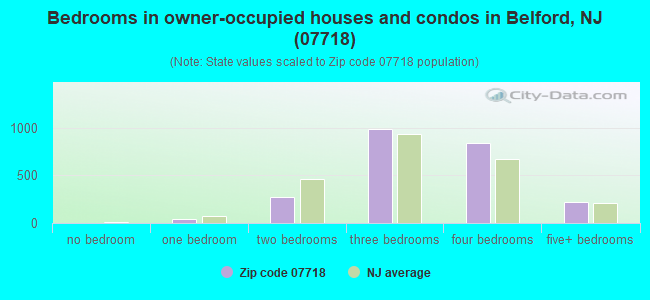
Median number of rooms in houses and condos:
Here:
7.2
State:
6.8
Median number of rooms in apartments:
Here:
4.8
State:
3.9
Notable locations in this zip code not listed on our city pages
Notable locations in zip code 07718: Middletown Township Fire Department Station 7 Belford Independent Fire Company (A), Middletown Township Fire Department Station 3 Belford Engine Company 1 (B). Display/hide their locations on the map
1,381 married couples with children.
97 single-parent households (22 men, 75 women).
92.8% of residents of 07718 zip code speak English at home.
2.8% of residents speak Spanish at home (85% very well, 15% well).
2.3% of residents speak other Indo-European language at home (55% very well, 30% well, 16% not well).
1.5% of residents speak Asian or Pacific Island language at home (85% very well, 15% well).
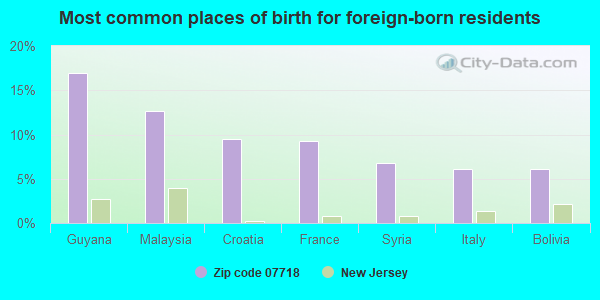
Foreign born population: 325 (4.9%) (50.6% of them are naturalized citizens)
This zip code:
4.9%
Whole state:
23.5%
17%Guyana
13%Malaysia
10%Croatia
9%France
7%Syria
6%Italy
6%Bolivia
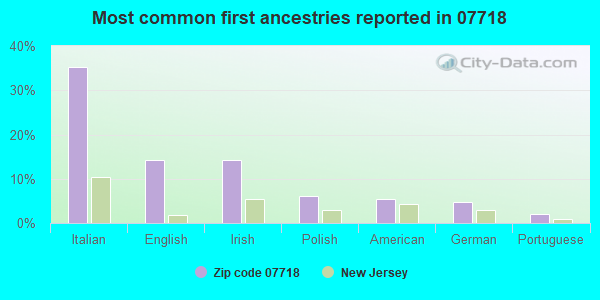
35%Italian
14%English
14%Irish
6%Polish
5%American
5%German
2%Portuguese
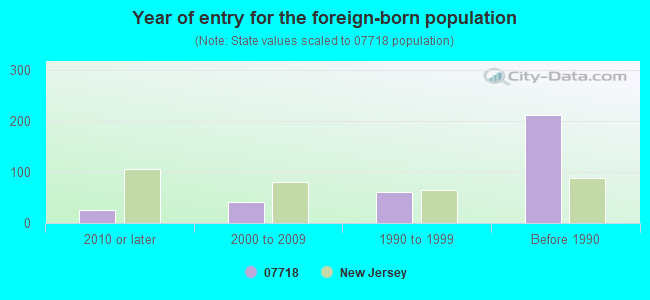
Year of entry for the foreign-born population
262010 or later
422000 to 2009
611990 to 1999
212Before 1990
Facilities with environmental interests located in this zip code:
OSWALD ENTERPRISES INC (161 EAST RD in BELFORD, NJ)
STATE MASTER (New Jersey environmental info) - NJEMS-204257, REFUSE DISPOSAL TRANSPORTER (Resource Conservation and Recovery Act (tracking hazardous waste)) - notification Organizations: OSWALD BROTHERS ENTERPRISES INC (CONTACT/OWNER)
Alternative names: OSWALD BROTHERS ENTERPRISES INC
BAYVIEW (300 LEONARDVILLE ROAD in BELFORD, NJ)
(National Center for Education Statistics) - STATE ID-060 Organizations: MIDDLETOWN TWP (SCHOOL DISTRICT)
BELFORD MARINE RAILWAY/ (WICKBERG MAR CONT in BELFORD, NJ)
National Pollutant Discharge Elimination System NON-MAJOR (Tracking pollutant discharge elimination systems) - permit Organizations: GTT INC (CONTACT/OWNER)
Alternative names: GTT INC TA BELFORD MARINE RAIL
AUTO BODY CONTOURS INCORPORATED (364 ROUTE 36 SOUTH in BELFORD, NJ)
(Resource Conservation and Recovery Act (tracking hazardous waste))
BELFORD MOBIL SERVICE (ROUTE 36 & MAIN STREET in BELFORD, NJ)
(Resource Conservation and Recovery Act (tracking hazardous waste))
FRANK HUBER INC (15 BROADWAY in BELFORD, NJ)
(Resource Conservation and Recovery Act (tracking hazardous waste))
BELFORD SEAFOOD CO-OP (901 PORT MONMOUTH ROAD in BELFORD, NJ)
ENFORCEMENT/COMPLIANCE ACTIVITY (Integrated Compliance Information System)
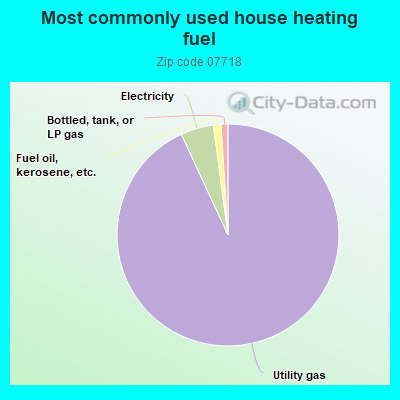
93.2%Utility gas
4.8%Electricity
1.1%Fuel oil, kerosene, etc.
1.0%Bottled, tank, or LP gas
Population in 1990: 6,601.
Place of birth for U.S.-born residents:
This state: 4,422
Northeast: 1,382
Midwest: 84
South: 216
West: 187
68% of the 07718 zip code residents lived in the same house 5 years ago. Out of people who lived in different houses, 73% lived in this county. Out of people who lived in different counties, 50% lived in New Jersey.
93% of the 07718 zip code residents lived in the same house 1 year ago. Out of people who lived in different houses, 44% moved from this county. Out of people who lived in different houses, 11% moved from different county within same state. Out of people who lived in different houses, 44% moved from different state. Out of people who lived in different houses, 6% moved from abroad.
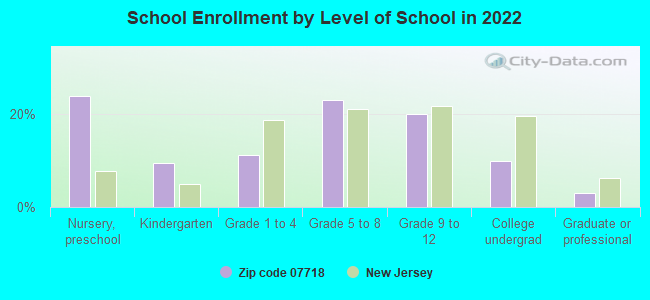
Private vs. public school enrollment:
Students in private schools in grades 1 to 8 (elementary and middle school): 120
Here:
21.2%
New Jersey:
12.3%
Students in private schools in grades 9 to 12 (high school): 56
Here:
17.1%
New Jersey:
13.1%
Students in private undergraduate colleges: 129
Here:
76.1%
New Jersey:
33.2%
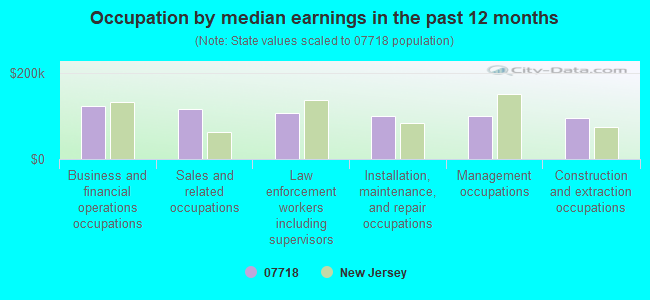
Occupation by median earnings in the past 12 months ($)
123,885Business and financial operations occupations
115,078Sales and related occupations
107,113Law enforcement workers including supervisors
100,694Installation, maintenance, and repair occupations
100,192Management occupations
94,807Construction and extraction occupations
Companies with federal contracts located in this zip code:
WICKBERG MARINE CONTRACTING IN (610 MAIN ST in BELFORD, NJ; small business) : $1,118,610 in 5 contractsfrom 2001 to 2004
Contracts for Construction of Structures and Facilities -- Dredging by U.S. Army Corps of Engineers - civil program financing only, Army Signed by year:2000: $0; 2001: $15,891; 2002: $976,840; 2003: $0; 2004: $125,879; 2005: $0; 2006: $0.
Biggest contracts:
$800,000 with U.S. Army Corps of Engineers - civil program financing only for Construction of Structures and Facilities -- Dredging. Taking place in NY. Signed on 2002-09-03. Completion date: 2002-11-19.
$125,879 with Army for Construction of Structures and Facilities -- Dredging. Taking place in NY. Signed on 2004-09-14. Completion date: 2004-11-18.
$93,000 with U.S. Army Corps of Engineers - civil program financing only for Construction of Structures and Facilities -- Dredging. Taking place in NY. Signed on 2002-11-22. Completion date: 2002-12-06.
$83,840, same as above.Signed on 2002-12-19. Completion date: 2003-01-10.
OSWALD ENTERPRISES INC (161 EAST RD in BELFORD, NJ; small business) : $5,550 in 2 contractsin 2005
$19,200 with Navy for Maintenance, Repair or Alteration of Real Property -- Other Non-Building Facilities. Signed on 2005-04-23. Completion date: 2005-05-25.
-$13,650, same as above.Signed on 2005-05-23. Completion date: 2005-05-25.
PARK PAINTING AND DECORATING (73 PARK AVE in BELFORD, NJ; small business)
$2,740 with Army for Maintenance, Repair or Alteration of Real Property -- Government-Owned Government-Operated (GOGO) R&D Facilities. Signed on 2001-11-08. Completion date: 2001-12-18.
Top industries in this zip code by the number of employees in 2005:
2006 - 2018 National Fire Incident Reporting System (NFIRS) incidents
According to the data from the years 2006 - 2018 the average number of fires per year is 16. The highest number of fire incidents - 43 took place in 2008, and the least - 1 in 2018. The data has a declining trend.
When looking into fire subcategories, the most incidents belonged to: Outside Fires (46.9%), and Structure Fires (25.4%).
Fire incident types reported to NFIRS in Zip Code 07718


 Nearest zip codes: 07737, 07758, 07748, 07716, 07734, 07701.


 According to the data from the years 2006 - 2018 the average number of fires per year is 16. The highest number of fire incidents - 43 took place in 2008, and the least - 1 in 2018. The data has a declining trend.
 When looking into fire subcategories, the most incidents belonged to: Outside Fires (46.9%), and Structure Fires (25.4%).