Estimated zip code population in 2022: 4,435 Zip code population in 2010: 3,944 Zip code population in 2000: 3,463
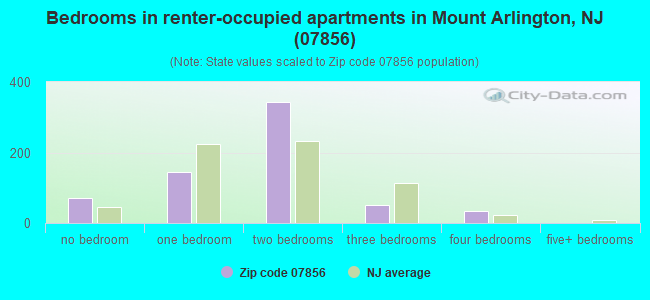
Houses and condos: 2,395 Renter-occupied apartments: 648
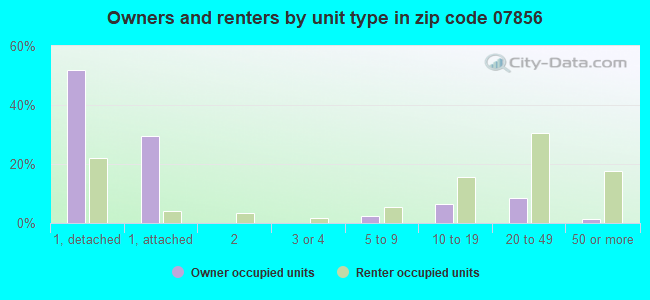
% of renters here:
33%
State:
35%
March 2022 cost of living index in zip code 07856: 115.2 (more than average, U.S. average is 100)
Land area: 3.5 sq. mi. Water area: 0.7 sq. mi.
Population density: 1,264 people per square mile
(low).
OSM Map
Google Map
MSN Map
OSM Map
General Map
Google Map
MSN Map
OSM Map
Google Map
MSN Map
OSM Map
Google Map
MSN Map
Please wait while loading the map...
Real estate property taxes paid for housing units in 2022:
This zip code:
1.9% ($7,730)
New Jersey:
2.1% ($8,897)
Median real estate property taxes paid for housing units with mortgages in 2022: $8,111 (1.9%) Median real estate property taxes paid for housing units with no mortgage in 2022: $6,826 (1.8%)
Business Search- 14 Million verified businesses
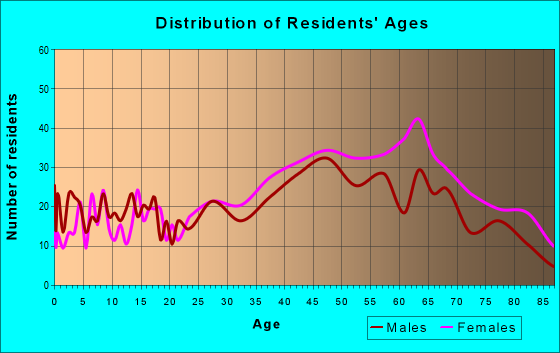
Males: 2,084
(47.0%)
Females: 2,350
(53.0%)
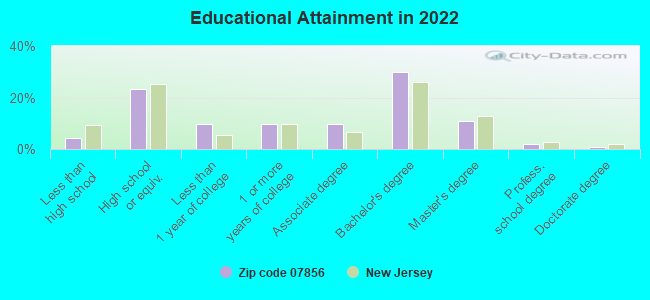
For population 25 years and over in 07856:
High school or higher: 95.7%
Bachelor's degree or higher: 43.5%
Graduate or professional degree: 13.8%
Unemployed: 2.5%
Mean travel time to work (commute): 36.1 minutes
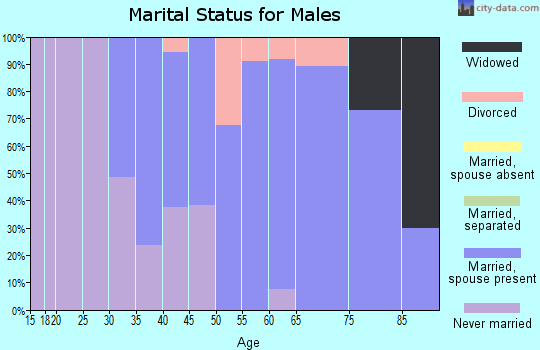
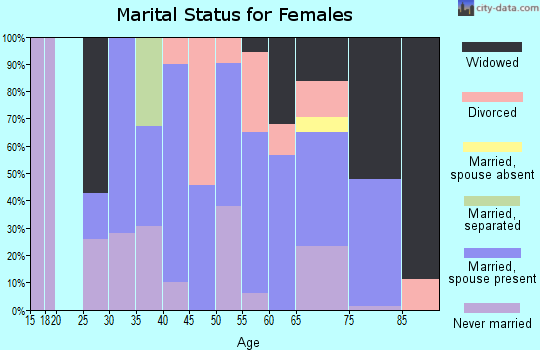
For population 15 years and over in 07856:
Never married: 34.6%
Now married: 43.3%
Separated: 1.3%
Widowed: 7.7%
Divorced: 13.1%
Zip code 07856 compared to state average:
Unemployed percentage below state average.
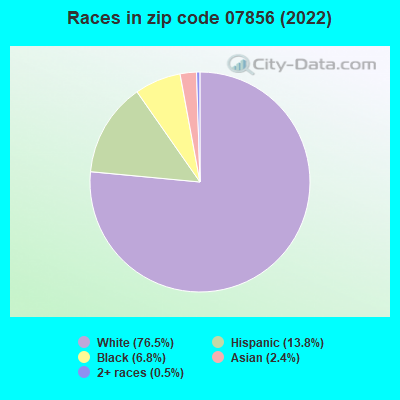
Black race population percentage below state average.
Median age above state average.
Foreign-born population percentage significantly below state average.
Length of stay since moving in significantly above state average.
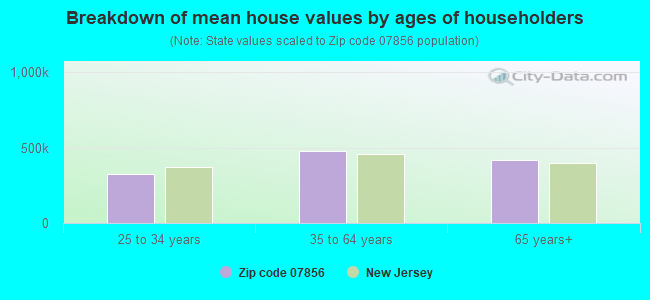
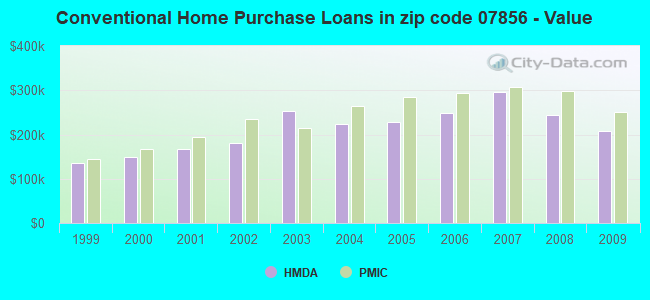
Estimated median house/condo value in 2022: $407,743
07856:
$407,743
New Jersey:
$428,900
Median resident age:
This zip code:
46.5 years
New Jersey median age:
40.4 years
Average household size:
This zip code:
2.3 people
New Jersey:
2.6 people
Averages for the 2020 tax year for zip code 07856, filed in 2021:
Average Adjusted Gross Income (AGI) in 2020: $88,335 (Individual Income Tax Returns)
Here:
$88,335
State:
$95,247
Salary/wage: $81,521 (reported on 73.7% of returns)
Here:
$81,521
State:
$80,635
(% of AGI for various income ranges: 1144.5% for AGIs below $25k, 3199.1% for AGIs $25k-50k, 6559.3% for AGIs $50k-75k, 9637.0% for AGIs $75k-100k, 17226.4% for AGIs $100k-200k, 99414.0% for AGIs over 200k)
Taxable interest for individuals: $1,958 (reported on 41.2% of returns)
This zip code:
$1,958
New Jersey:
$2,414
(% of AGI for various income ranges: 45.2% for AGIs below $25k, 59.7% for AGIs $25k-50k, 60.7% for AGIs $50k-75k, 125.0% for AGIs $75k-100k, 164.4% for AGIs $100k-200k, 1684.0% for AGIs over 200k)
Ordinary dividends: $4,857 (reported on 35.0% of returns)
Here:
$4,857
State:
$8,057
(% of AGI for various income ranges: 73.3% for AGIs below $25k, 110.9% for AGIs $25k-50k, 158.3% for AGIs $50k-75k, 357.0% for AGIs $75k-100k, 365.0% for AGIs $100k-200k, 3114.0% for AGIs over 200k)
Net capital gain/loss in AGI: +$7,755 (reported on 30.3% of returns)
Here:
+$7,755
State:
+$25,022
(% of AGI for various income ranges: 7.3% for AGIs below $25k, 70.3% for AGIs $25k-50k, 92.1% for AGIs $50k-75k, 335.0% for AGIs $75k-100k, 437.8% for AGIs $100k-200k, 7322.0% for AGIs over 200k)
Profit/loss from business: +$18,139 (reported on 13.9% of returns)
Here:
+$18,139
State:
+$18,035
(% of AGI for various income ranges: 119.7% for AGIs below $25k, 168.5% for AGIs $25k-50k, 258.6% for AGIs $50k-75k, 616.5% for AGIs $75k-100k, 585.3% for AGIs $100k-200k, 3670.0% for AGIs over 200k)
Taxable individual retirement arrangement distribution: $20,967 (reported on 16.4% of returns)
07856:
$20,967
New Jersey:
$21,558
(% of AGI for various income ranges: 140.0% for AGIs below $25k, 287.1% for AGIs $25k-50k, 406.6% for AGIs $50k-75k, 801.5% for AGIs $75k-100k, 939.2% for AGIs $100k-200k, 3668.0% for AGIs over 200k)
Total itemized deductions: $27,813 (reported on 20.1% of returns)
Here:
$27,813
State:
$32,863
(% of AGI for various income ranges: 269.1% for AGIs below $25k, 491.8% for AGIs $25k-50k, 630.0% for AGIs $50k-75k, 1189.5% for AGIs $75k-100k, 1425.6% for AGIs $100k-200k, 6798.0% for AGIs over 200k)
Charity contributions: $4,280 (reported on 16.8% of returns)
Here:
$4,280
State:
$7,880
(% of AGI for various income ranges: 8.2% for AGIs below $25k, 34.4% for AGIs $25k-50k, 45.5% for AGIs $50k-75k, 198.0% for AGIs $75k-100k, 186.7% for AGIs $100k-200k, 1250.0% for AGIs over 200k)
Taxes paid: $9,169 (reported on 20.1% of returns)
07856:
$9,169
State:
$9,183
(% of AGI for various income ranges: 80.0% for AGIs below $25k, 165.9% for AGIs $25k-50k, 225.2% for AGIs $50k-75k, 475.0% for AGIs $75k-100k, 517.8% for AGIs $100k-200k, 1496.0% for AGIs over 200k)
Earned income credit: $1,450 (reported on 5.1% of returns)
Here:
$1,450
State:
$2,148
(% of AGI for various income ranges: 36.7% for AGIs below $25k, 24.1% for AGIs $25k-50k)
Percentage of individuals using paid preparers for their 2020 taxes: 90.9%
Here:
91%
State:
92%
(% for various income ranges: 86.2% for AGIs below $25k, 89.8% for AGIs $25k-50k, 91.5% for AGIs $50k-75k, 91.9% for AGIs $75k-100k, 93.7% for AGIs $100k-200k, 95.0% for AGIs over 200k)
Averages for the 2012 tax year for zip code 07856, filed in 2013:
Average Adjusted Gross Income (AGI) in 2012: $74,932 (Individual Income Tax Returns)
Here:
$74,932
State:
$79,688
Salary/wage: $66,865 (reported on 76.8% of returns)
Here:
$66,865
State:
$68,122
(% of AGI for various income ranges: 58.2% for AGIs below $25k, 60.7% for AGIs $25k-50k, 66.0% for AGIs $50k-75k, 71.4% for AGIs $75k-100k, 71.5% for AGIs $100k-200k, 68.6% for AGIs over 200k)
Taxable interest for individuals: $1,401 (reported on 49.6% of returns)
This zip code:
$1,401
New Jersey:
$2,193
(% of AGI for various income ranges: 2.9% for AGIs below $25k, 1.3% for AGIs $25k-50k, 0.7% for AGIs $50k-75k, 1.1% for AGIs $75k-100k, 0.8% for AGIs $100k-200k, 0.6% for AGIs over 200k)
Ordinary dividends: $4,695 (reported on 35.1% of returns)
Here:
$4,695
State:
$6,828
(% of AGI for various income ranges: 4.3% for AGIs below $25k, 2.7% for AGIs $25k-50k, 1.8% for AGIs $50k-75k, 2.2% for AGIs $75k-100k, 1.9% for AGIs $100k-200k, 2.3% for AGIs over 200k)
Net capital gain/loss in AGI: +$1,247 (reported on 28.1% of returns)
Here:
+$1,247
State:
+$15,358
(% of AGI for various income ranges: 0.3% for AGIs $75k-100k, 1.1% for AGIs $100k-200k, 0.7% for AGIs over 200k)
Profit/loss from business: +$22,840 (reported on 13.2% of returns)
Here:
+$22,840
State:
+$19,577
(% of AGI for various income ranges: 6.0% for AGIs below $25k, 4.3% for AGIs $25k-50k, 2.4% for AGIs $50k-75k, 1.8% for AGIs $75k-100k, 3.5% for AGIs $100k-200k, 7.1% for AGIs over 200k)
Taxable individual retirement arrangement distribution: $15,293 (reported on 18.9% of returns)
07856:
$15,293
New Jersey:
$18,214
(% of AGI for various income ranges: 8.4% for AGIs below $25k, 7.1% for AGIs $25k-50k, 4.2% for AGIs $50k-75k, 3.8% for AGIs $75k-100k, 3.6% for AGIs $100k-200k, 1.8% for AGIs over 200k)
Self-employment retirement plans: $27,600 (reported on 0.9% of returns)
07856:
$27,600
New Jersey:
$24,511
Total itemized deductions: $24,478 (23% of AGI, reported on 55.7% of returns)
Here:
$24,478
State:
$30,827
Here:
23.4% of AGI
State:
21.2% of AGI
(% of AGI for various income ranges: 29.0% for AGIs below $25k, 19.3% for AGIs $25k-50k, 18.1% for AGIs $50k-75k, 18.3% for AGIs $75k-100k, 18.3% for AGIs $100k-200k, 15.5% for AGIs over 200k)
Charity contributions: $2,368 (reported on 48.2% of returns)
Here:
$2,368
State:
$3,451
(% of AGI for various income ranges: 1.4% for AGIs below $25k, 1.3% for AGIs $25k-50k, 1.4% for AGIs $50k-75k, 1.5% for AGIs $75k-100k, 1.6% for AGIs $100k-200k, 1.7% for AGIs over 200k)
Taxes paid: $11,205 (reported on 55.3% of returns)
07856:
$11,205
State:
$15,801
(% of AGI for various income ranges: 10.0% for AGIs below $25k, 7.2% for AGIs $25k-50k, 7.2% for AGIs $50k-75k, 8.1% for AGIs $75k-100k, 8.4% for AGIs $100k-200k, 9.0% for AGIs over 200k)
Earned income credit: $1,282 (reported on 4.8% of returns)
Here:
$1,282
State:
$2,182
(% of AGI for various income ranges: 1.5% for AGIs below $25k, 0.2% for AGIs $25k-50k)
Percentage of individuals using paid preparers for their 2012 taxes: 61.0%
Here:
61%
State:
65%
(% for various income ranges: 52.5% for AGIs below $25k, 57.1% for AGIs $25k-50k, 64.3% for AGIs $50k-75k, 70.0% for AGIs $75k-100k, 62.2% for AGIs $100k-200k, 80.0% for AGIs over 200k)
Averages for the 2004 tax year for zip code 07856, filed in 2005:
Average Adjusted Gross Income (AGI) in 2004: $66,541 (Individual Income Tax Returns)
Here:
$66,541
State:
$64,921
Salary/wage: $62,338 (reported on 80.7% of returns)
Here:
$62,338
State:
$57,755
(% of AGI for various income ranges: 94.7% for AGIs below $10k, 63.8% for AGIs $10k-25k, 72.8% for AGIs $25k-50k, 77.2% for AGIs $50k-75k, 84.7% for AGIs $75k-100k, 73.8% for AGIs over 100k)
Taxable interest for individuals: $1,706 (reported on 65.1% of returns)
This zip code:
$1,706
New Jersey:
$2,068
(% of AGI for various income ranges: 7.8% for AGIs below $10k, 6.1% for AGIs $10k-25k, 1.9% for AGIs $25k-50k, 1.6% for AGIs $50k-75k, 0.7% for AGIs $75k-100k, 1.5% for AGIs over 100k)
Taxable dividends: $3,331 (reported on 41.0% of returns)
Here:
$3,331
State:
$3,959
(% of AGI for various income ranges: 9.1% for AGIs below $10k, 4.4% for AGIs $10k-25k, 2.5% for AGIs $25k-50k, 1.4% for AGIs $50k-75k, 0.8% for AGIs $75k-100k, 2.2% for AGIs over 100k)
Net capital gain/loss: +$6,717 (reported on 33.4% of returns)
Here:
+$6,717
State:
+$13,591
(% of AGI for various income ranges: -5.6% for AGIs below $10k, -0.7% for AGIs $10k-25k, -0.1% for AGIs $25k-50k, -0.1% for AGIs $50k-75k, 1.8% for AGIs $75k-100k, 6.4% for AGIs over 100k)
Profit/loss from business: +$20,756 (reported on 13.5% of returns)
Here:
+$20,756
State:
+$17,520
(% of AGI for various income ranges: 11.2% for AGIs below $10k, 4.3% for AGIs $10k-25k, 4.1% for AGIs $25k-50k, 4.3% for AGIs $50k-75k, 0.5% for AGIs $75k-100k, 5.1% for AGIs over 100k)
IRA payment deduction: $3,141 (reported on 3.8% of returns)
07856:
$3,141
New Jersey:
$3,270
(% of AGI for various income ranges: 0.4% for AGIs $25k-50k, 0.3% for AGIs $50k-75k, 0.2% for AGIs $75k-100k, 0.1% for AGIs over 100k)
Self-employed pension: $17,000 (reported on 1.1% of returns)
Here:
$17,000
New Jersey:
$17,258
Total itemized deductions: $21,210 (22% of AGI, reported on 54.5% of returns)
Here:
$21,210
State:
$23,924
Here:
22.1% of AGI
State:
21.1% of AGI
(% of AGI for various income ranges: 41.3% for AGIs below $10k, 21.2% for AGIs $10k-25k, 18.1% for AGIs $25k-50k, 19.5% for AGIs $50k-75k, 18.6% for AGIs $75k-100k, 15.4% for AGIs over 100k)
Charity contributions deductions: $2,062 (2% of AGI, reported on 50.2% of returns)
Here:
$2,062
State:
$3,242
Here:
2.1% of AGI
State:
2.7% of AGI
(% of AGI for various income ranges: 1.6% for AGIs below $10k, 1.6% for AGIs $10k-25k, 1.6% for AGIs $25k-50k, 1.5% for AGIs $50k-75k, 1.6% for AGIs $75k-100k, 1.5% for AGIs over 100k)
Total tax: $10,970 (reported on 86.2% of returns)
07856:
$10,970
State:
$12,321
(% of AGI for various income ranges: 3.3% for AGIs below $10k, 4.7% for AGIs $10k-25k, 8.6% for AGIs $25k-50k, 10.8% for AGIs $50k-75k, 11.3% for AGIs $75k-100k, 18.6% for AGIs over 100k)
Earned income credit: $1,347 (reported on 4.8% of returns)
Here:
$1,347
State:
$1,711
Percentage of individuals using paid preparers for their 2004 taxes: 60.3%
Here:
60%
State:
65%
(% for various income ranges: 55.6% for AGIs below $10k, 57.3% for AGIs $10k-25k, 58.1% for AGIs $25k-50k, 61.3% for AGIs $50k-75k, 61.0% for AGIs $75k-100k, 67.4% for AGIs over 100k)
Household received Food Stamps/SNAP in the past 12 months: 100 Household did not receive Food Stamps/SNAP in the past 12 months: 1,847
Women who had a birth in the past 12 months: 43 (23 now married, 19 unmarried) Women who did not have a birth in the past 12 months: 979 (305 now married, 676 unmarried)
Housing units in zip code 07856 with a mortgage: 923 (111 second mortgage, 102 both second mortgage and home equity loan) Houses without a mortgage: 19
Median monthly owner costs for units with a mortgage: $2,275 Median monthly owner costs for units without a mortgage: $1,284
Residents with income below the poverty level in 2022:
This zip code:
4.8%
Whole state:
9.7%
Residents with income below 50% of the poverty level in 2022:
This zip code:
2.9%
Whole state:
5.2%
Median number of rooms in houses and condos:
Here:
6.3
State:
6.8
Median number of rooms in apartments:
Here:
3.9
State:
3.9
Notable locations in this zip code not listed on our city pages
465 married couples with children.
166 single-parent households (18 men, 148 women).
82.6% of residents of 07856 zip code speak English at home.
8.4% of residents speak Spanish at home (70% very well, 5% well, 25% not well).
2.6% of residents speak other Indo-European language at home (100% very well).
1.7% of residents speak Asian or Pacific Island language at home (100% very well).
4.8% of residents speak other language at home (85% very well, 15% well).
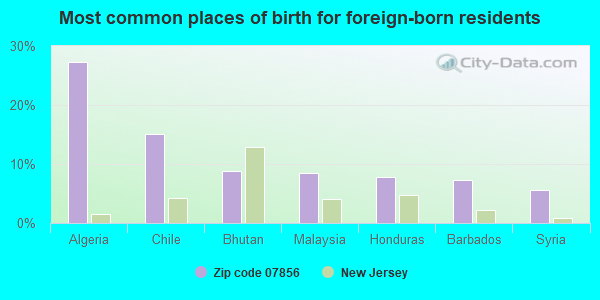
Foreign born population: 454 (10.2%) (79.1% of them are naturalized citizens)
This zip code:
10.2%
Whole state:
23.5%
27%Algeria
15%Chile
9%Bhutan
8%Malaysia
8%Honduras
7%Barbados
6%Syria
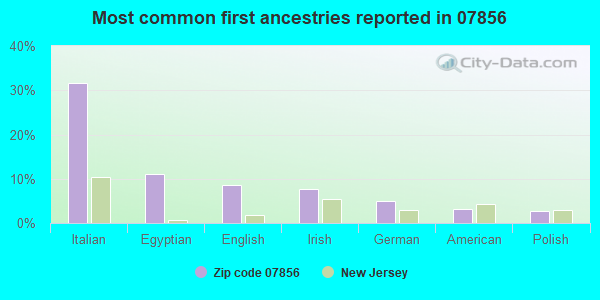
32%Italian
11%Egyptian
9%English
8%Irish
5%German
3%American
3%Polish
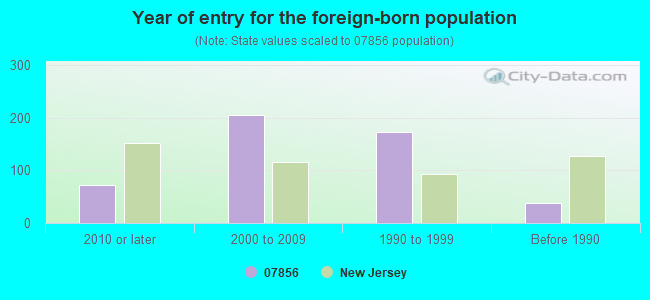
Year of entry for the foreign-born population
732010 or later
2052000 to 2009
1731990 to 1999
38Before 1990
Facilities with environmental interests located in this zip code:
BARNES BROTHERS MARINA (11 WINDERMERE AVENUE in MOUNT ARLINGTON, NJ)
ENFORCEMENT/COMPLIANCE ACTIVITY (Integrated Compliance Information System) - ICIS-02-2004-0901, FORMAL ENFORCEMENT ACTION (Integrated Compliance Information System) - ICIS-02-2004-0901, FORMAL ENFORCEMENT ACTION STATE MASTER (New Jersey environmental info) - NJEMS-016784, STATE CLEANUP SITE, NJEMS-205784, REFUSE DISPOSAL, NJEMS-218232, National Pollutant Discharge Elimination System Permit National Pollutant Discharge Elimination System NON-MAJOR (Tracking pollutant discharge elimination systems) - permit Conditionally Exempt Small Quantity Generators, less than 100 kg/month of hazardous waste (Resource Conservation and Recovery Act (tracking hazardous waste)) - notification Business SIC classification: MARINAS Organizations: BARNES BROTHERS MARINE, BARNES BROS MARINE (CONTACT/OPERATOR)
, M & H ASSOCIATES (CONTACT/OWNER)
, M&H ASSOC (CONTACT/OWNER)
, MIGLIACCIO RALPH (CONTACT/OWNER)
Alternative names: BARNES BROTHERS MARINE, BARNES BROS MARINE BASE, BARNES BROS MARINE BASE SB
NJDOT @ ROXBURY CORP CENTER (200 STIERLI CT in MOUNT ARLINGTON, NJ)
STATE MASTER (New Jersey environmental info) - NJEMS-1436365, DRINKING WATER PROGRAM, NJEMS-223746, National Pollutant Discharge Elimination System Permit, NJEMS-NJD986625358, HAZARDOUS WASTE PROGRAM National Pollutant Discharge Elimination System NON-MAJOR (Tracking pollutant discharge elimination systems) - permit Organizations: NJDOT REGION NORTH (CONTACT/OWNER)
Alternative names: NJDOT REGION NORTH
EXXON SERVICE STATION #35390 (HOWARD BLVD & I-80 in MOUNT ARLINGTON, NJ)
STATE MASTER (New Jersey environmental info) - NJEMS-008124, STATE CLEANUP SITE, NJEMS-1426303, DRINKING WATER PROGRAM, NJEMS-72692700000, EPCRA, NJEMS-A2695, AIR PROGRAM (Resource Conservation and Recovery Act (tracking hazardous waste)) Business SIC classification: GASOLINE SERVICE STATIONS Organizations: EXXON MOBIL CORP, EXXON CO USA Alternative names: EXXON CO USA 35390
Housing units lacking complete kitchen facilities: 1.4%
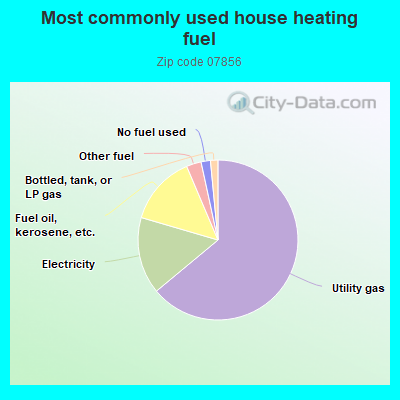
64.1%Utility gas
15.6%Electricity
14.1%Fuel oil, kerosene, etc.
3.0%Other fuel
1.9%No fuel used
1.5%Bottled, tank, or LP gas
Population in 1990: 2,240. Population change in the 1990s: +1,223 (+54.6%).
Place of birth for U.S.-born residents:
This state: 2,908
Northeast: 809
Midwest: 67
South: 122
West: 17
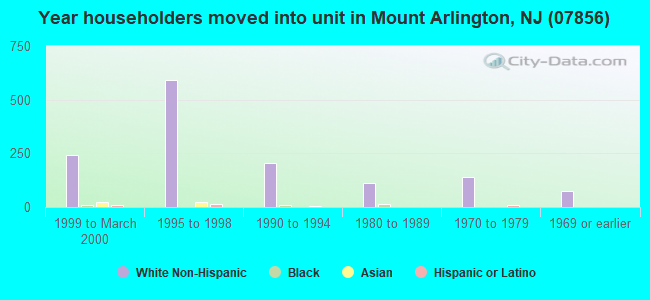
52% of the 07856 zip code residents lived in the same house 5 years ago. Out of people who lived in different houses, 45% lived in this county. Out of people who lived in different counties, 50% lived in New Jersey.
84% of the 07856 zip code residents lived in the same house 1 year ago. Out of people who lived in different houses, 49% moved from this county. Out of people who lived in different houses, 28% moved from different county within same state. Out of people who lived in different houses, 18% moved from different state.
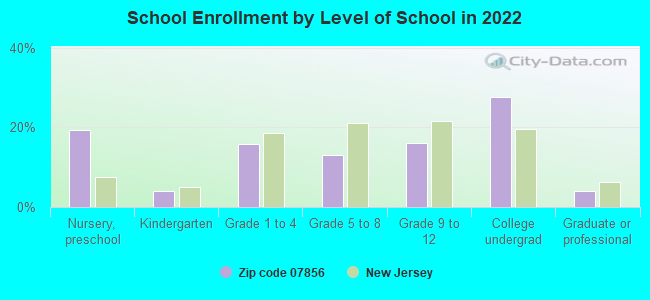
Private vs. public school enrollment:
Students in private schools in grades 1 to 8 (elementary and middle school):
Here:
0.0%
New Jersey:
12.3%
Students in private schools in grades 9 to 12 (high school):
Here:
0.0%
New Jersey:
13.1%
Students in private undergraduate colleges: 78
Here:
26.7%
New Jersey:
33.2%
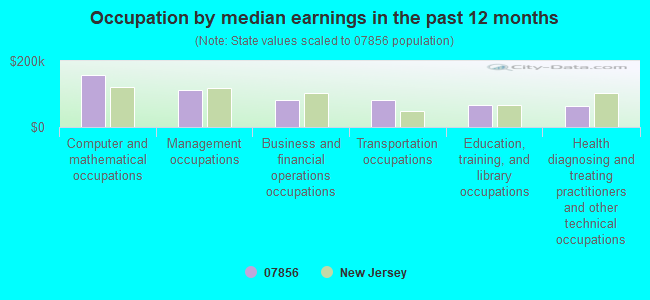
Occupation by median earnings in the past 12 months ($)
157,804Computer and mathematical occupations
111,375Management occupations
82,363Business and financial operations occupations
80,757Transportation occupations
66,168Education, training, and library occupations
63,641Health diagnosing and treating practitioners and other technical occupations
Companies with federal contracts located in this zip code:
AGATINO, FRANCES (14 CIRCLE DR in MOUNT ARLINGTO, NJ; small business) : $140,839 in 4 contractsfrom 2003 to 2005
$51,469 with Army for Maintenance, Repair and Rebuilding of Equipment -- Instruments and Laboratory Equipment. Signed on 2004-09-27. Completion date: 2004-09-28.
$50,565 with Army for Inspection Services (including commercial testing and lab services, except medical/dental) -- Miscellaneous. Signed on 2005-09-19. Completion date: 2006-09-29.
$37,005 with Army for Maintenance, Repair and Rebuilding of Equipment -- Instruments and Laboratory Equipment. Signed on 2003-09-26. Completion date: 2004-09-24.
$1,800 with Army for Facilities Operations Support Services. Signed on 2005-03-11. Effective on 2005-03-08. Completion date: 2006-09-27.
Top industries in this zip code by the number of employees in 2005:
Detailed PMIC statistics for the following Tracts:0454.01
2002 - 2018 National Fire Incident Reporting System (NFIRS) incidents
Based on the data from the years 2002 - 2018 the average number of fire incidents per year is 13. The highest number of reported fires - 26 took place in 2005, and the least - 0 in 2003. The data has a growing trend.
When looking into fire subcategories, the most reports belonged to: Structure Fires (47.0%), and Outside Fires (19.5%).
Fire incident types reported to NFIRS in Zip Code 07856


 Nearest zip codes: 07847, 07885, 07850, 07843, 07803, 07852.


 Based on the data from the years 2002 - 2018 the average number of fire incidents per year is 13. The highest number of reported fires - 26 took place in 2005, and the least - 0 in 2003. The data has a growing trend.
 When looking into fire subcategories, the most reports belonged to: Structure Fires (47.0%), and Outside Fires (19.5%).