Estimated zip code population in 2022: 40,375 Zip code population in 2010: 38,992 Zip code population in 2000: 39,208
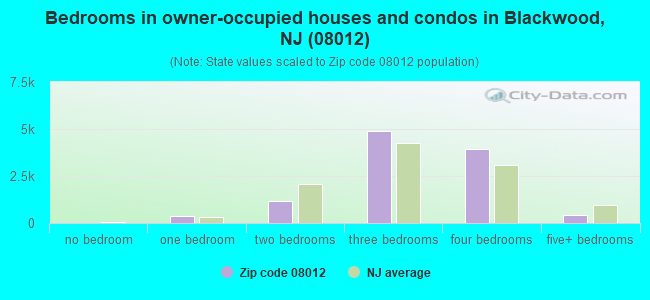
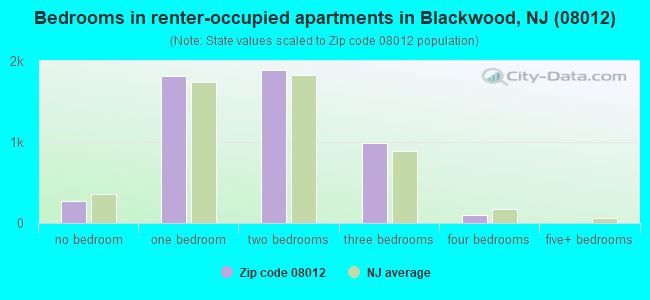
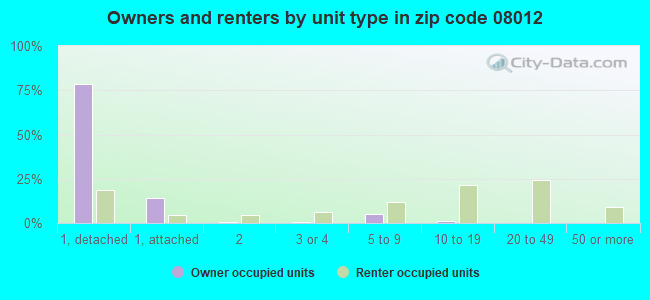
Houses and condos: 16,406 Renter-occupied apartments: 5,045
% of renters here:
32%
State:
35%
March 2022 cost of living index in zip code 08012: 101.9 (near average, U.S. average is 100)
Land area: 14.9 sq. mi. Water area: 0.2 sq. mi.
Population density: 2,702 people per square mile
(average).
OSM Map
Google Map
MSN Map
OSM Map
General Map
Google Map
MSN Map
OSM Map
Google Map
MSN Map
OSM Map
Google Map
MSN Map
Please wait while loading the map...
Real estate property taxes paid for housing units in 2022:
This zip code:
2.8% ($7,660)
New Jersey:
2.1% ($8,897)
Median real estate property taxes paid for housing units with mortgages in 2022: $7,691 (2.8%) Median real estate property taxes paid for housing units with no mortgage in 2022: $7,622 (2.8%)
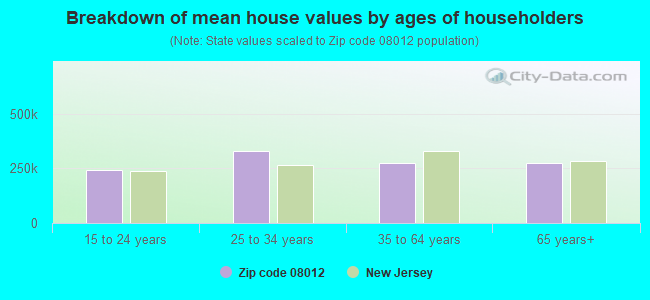
Estimated median house/condo value in 2022: $271,188
08012:
$271,188
New Jersey:
$428,900
According to our research of New Jersey and other state lists, there were 19 registered sex offenders living in 08012 zip code as of April 27, 2024. The ratio of all residents to sex offenders in zip code 08012 is 2,192 to 1. The ratio of registered sex offenders to all residents in this zip code is lower than the state average.
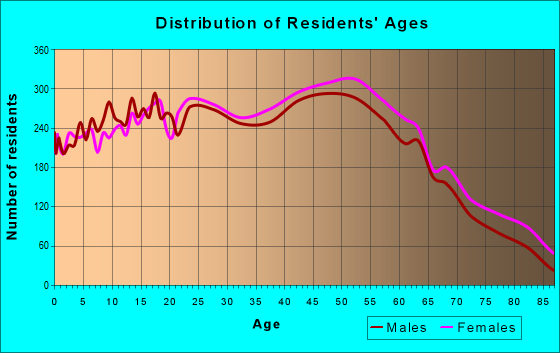
Median resident age:
This zip code:
41.2 years
New Jersey median age:
40.4 years
Average household size:
This zip code:
2.5 people
New Jersey:
2.6 people
Averages for the 2020 tax year for zip code 08012, filed in 2021:
Average Adjusted Gross Income (AGI) in 2020: $66,390 (Individual Income Tax Returns)
Here:
$66,390
State:
$95,247
Salary/wage: $58,781 (reported on 84.1% of returns)
Here:
$58,781
State:
$80,635
(% of AGI for various income ranges: 1149.0% for AGIs below $25k, 3509.2% for AGIs $25k-50k, 6241.9% for AGIs $50k-75k, 9631.8% for AGIs $75k-100k, 17251.7% for AGIs $100k-200k, 64776.2% for AGIs over 200k)
Taxable interest for individuals: $944 (reported on 27.9% of returns)
This zip code:
$944
New Jersey:
$2,414
(% of AGI for various income ranges: 11.8% for AGIs below $25k, 15.2% for AGIs $25k-50k, 35.3% for AGIs $50k-75k, 43.6% for AGIs $75k-100k, 90.6% for AGIs $100k-200k, 346.7% for AGIs over 200k)
Ordinary dividends: $2,885 (reported on 17.2% of returns)
Here:
$2,885
State:
$8,057
(% of AGI for various income ranges: 18.3% for AGIs below $25k, 28.4% for AGIs $25k-50k, 50.4% for AGIs $50k-75k, 69.7% for AGIs $75k-100k, 153.8% for AGIs $100k-200k, 1186.7% for AGIs over 200k)
Net capital gain/loss in AGI: +$8,792 (reported on 14.2% of returns)
Here:
+$8,792
State:
+$25,022
(% of AGI for various income ranges: 5.7% for AGIs below $25k, 28.6% for AGIs $25k-50k, 50.7% for AGIs $50k-75k, 82.6% for AGIs $75k-100k, 279.7% for AGIs $100k-200k, 7187.6% for AGIs over 200k)
Profit/loss from business: +$11,075 (reported on 12.1% of returns)
Here:
+$11,075
State:
+$18,035
(% of AGI for various income ranges: 67.3% for AGIs below $25k, 89.5% for AGIs $25k-50k, 147.9% for AGIs $50k-75k, 244.7% for AGIs $75k-100k, 372.1% for AGIs $100k-200k, 2538.1% for AGIs over 200k)
Taxable individual retirement arrangement distribution: $15,841 (reported on 8.5% of returns)
08012:
$15,841
New Jersey:
$21,558
(% of AGI for various income ranges: 51.9% for AGIs below $25k, 90.1% for AGIs $25k-50k, 174.4% for AGIs $50k-75k, 296.3% for AGIs $75k-100k, 440.4% for AGIs $100k-200k, 1531.4% for AGIs over 200k)
Self-employed (Keogh) retirement plans: $14,280 (reported on 0.3% of returns)
08012:
$14,280
New Jersey:
$30,844
(% of AGI for various income ranges: 32.8% for AGIs $100k-200k)
Total itemized deductions: $26,630 (reported on 10.8% of returns)
Here:
$26,630
State:
$32,863
(% of AGI for various income ranges: 80.6% for AGIs below $25k, 173.0% for AGIs $25k-50k, 462.6% for AGIs $50k-75k, 689.9% for AGIs $75k-100k, 650.0% for AGIs $100k-200k, 5595.2% for AGIs over 200k)
Charity contributions: $4,794 (reported on 8.7% of returns)
Here:
$4,794
State:
$7,880
(% of AGI for various income ranges: 5.1% for AGIs below $25k, 18.6% for AGIs $25k-50k, 57.6% for AGIs $50k-75k, 92.8% for AGIs $75k-100k, 123.7% for AGIs $100k-200k, 923.3% for AGIs over 200k)
Taxes paid: $8,667 (reported on 10.8% of returns)
08012:
$8,667
State:
$9,183
(% of AGI for various income ranges: 27.0% for AGIs below $25k, 56.8% for AGIs $25k-50k, 177.1% for AGIs $50k-75k, 282.6% for AGIs $75k-100k, 240.7% for AGIs $100k-200k, 766.2% for AGIs over 200k)
Earned income credit: $1,952 (reported on 11.7% of returns)
Here:
$1,952
State:
$2,148
(% of AGI for various income ranges: 68.4% for AGIs below $25k, 51.3% for AGIs $25k-50k, 0.7% for AGIs $50k-75k)
Percentage of individuals using paid preparers for their 2020 taxes: 92.3%
Here:
92%
State:
92%
(% for various income ranges: 90.8% for AGIs below $25k, 93.5% for AGIs $25k-50k, 92.5% for AGIs $50k-75k, 92.9% for AGIs $75k-100k, 92.4% for AGIs $100k-200k, 92.2% for AGIs over 200k)
Averages for the 2012 tax year for zip code 08012, filed in 2013:
Average Adjusted Gross Income (AGI) in 2012: $57,953 (Individual Income Tax Returns)
Here:
$57,953
State:
$79,688
Salary/wage: $52,590 (reported on 85.7% of returns)
Here:
$52,590
State:
$68,122
(% of AGI for various income ranges: 72.3% for AGIs below $25k, 77.8% for AGIs $25k-50k, 76.8% for AGIs $50k-75k, 79.3% for AGIs $75k-100k, 82.6% for AGIs $100k-200k, 65.7% for AGIs over 200k)
Taxable interest for individuals: $917 (reported on 32.6% of returns)
This zip code:
$917
New Jersey:
$2,193
(% of AGI for various income ranges: 1.0% for AGIs below $25k, 0.5% for AGIs $25k-50k, 0.6% for AGIs $50k-75k, 0.5% for AGIs $75k-100k, 0.4% for AGIs $100k-200k, 0.6% for AGIs over 200k)
Ordinary dividends: $2,212 (reported on 18.9% of returns)
Here:
$2,212
State:
$6,828
(% of AGI for various income ranges: 1.0% for AGIs below $25k, 0.6% for AGIs $25k-50k, 0.7% for AGIs $50k-75k, 0.6% for AGIs $75k-100k, 0.5% for AGIs $100k-200k, 1.5% for AGIs over 200k)
Net capital gain/loss in AGI: +$6,755 (reported on 12.6% of returns)
Here:
+$6,755
State:
+$15,358
(% of AGI for various income ranges: 0.1% for AGIs $50k-75k, 0.3% for AGIs $75k-100k, 0.4% for AGIs $100k-200k, 11.8% for AGIs over 200k)
Profit/loss from business: +$11,746 (reported on 10.5% of returns)
Here:
+$11,746
State:
+$19,577
(% of AGI for various income ranges: 5.2% for AGIs below $25k, 2.8% for AGIs $25k-50k, 1.6% for AGIs $50k-75k, 1.4% for AGIs $75k-100k, 2.1% for AGIs $100k-200k, 1.3% for AGIs over 200k)
Taxable individual retirement arrangement distribution: $13,561 (reported on 9.4% of returns)
08012:
$13,561
New Jersey:
$18,214
(% of AGI for various income ranges: 3.1% for AGIs below $25k, 2.3% for AGIs $25k-50k, 2.0% for AGIs $50k-75k, 1.9% for AGIs $75k-100k, 2.3% for AGIs $100k-200k, 2.0% for AGIs over 200k)
Self-employment retirement plans: $12,288 (reported on 0.4% of returns)
08012:
$12,288
New Jersey:
$24,511
Total itemized deductions: $21,086 (23% of AGI, reported on 44.2% of returns)
Here:
$21,086
State:
$30,827
Here:
22.6% of AGI
State:
21.2% of AGI
(% of AGI for various income ranges: 13.1% for AGIs below $25k, 12.9% for AGIs $25k-50k, 16.9% for AGIs $50k-75k, 18.0% for AGIs $75k-100k, 17.4% for AGIs $100k-200k, 13.8% for AGIs over 200k)
Charity contributions: $2,283 (reported on 38.3% of returns)
Here:
$2,283
State:
$3,451
(% of AGI for various income ranges: 0.7% for AGIs below $25k, 1.1% for AGIs $25k-50k, 1.5% for AGIs $50k-75k, 1.6% for AGIs $75k-100k, 1.8% for AGIs $100k-200k, 1.4% for AGIs over 200k)
Taxes paid: $9,729 (reported on 44.1% of returns)
08012:
$9,729
State:
$15,801
(% of AGI for various income ranges: 4.7% for AGIs below $25k, 5.1% for AGIs $25k-50k, 7.1% for AGIs $50k-75k, 8.0% for AGIs $75k-100k, 8.6% for AGIs $100k-200k, 7.9% for AGIs over 200k)
Earned income credit: $1,974 (reported on 12.4% of returns)
Here:
$1,974
State:
$2,182
(% of AGI for various income ranges: 4.3% for AGIs below $25k, 0.8% for AGIs $25k-50k)
Percentage of individuals using paid preparers for their 2012 taxes: 55.5%
Here:
56%
State:
65%
(% for various income ranges: 49.5% for AGIs below $25k, 53.9% for AGIs $25k-50k, 58.8% for AGIs $50k-75k, 60.6% for AGIs $75k-100k, 62.8% for AGIs $100k-200k, 66.7% for AGIs over 200k)
Averages for the 2004 tax year for zip code 08012, filed in 2005:
Average Adjusted Gross Income (AGI) in 2004: $49,398 (Individual Income Tax Returns)
Here:
$49,398
State:
$64,921
Salary/wage: $46,787 (reported on 88.2% of returns)
Here:
$46,787
State:
$57,755
(% of AGI for various income ranges: 92.0% for AGIs below $10k, 74.3% for AGIs $10k-25k, 83.4% for AGIs $25k-50k, 84.1% for AGIs $50k-75k, 87.2% for AGIs $75k-100k, 82.6% for AGIs over 100k)
Taxable interest for individuals: $982 (reported on 47.9% of returns)
This zip code:
$982
New Jersey:
$2,068
(% of AGI for various income ranges: 4.2% for AGIs below $10k, 2.0% for AGIs $10k-25k, 1.0% for AGIs $25k-50k, 0.8% for AGIs $50k-75k, 0.7% for AGIs $75k-100k, 0.8% for AGIs over 100k)
Taxable dividends: $1,284 (reported on 24.6% of returns)
Here:
$1,284
State:
$3,959
(% of AGI for various income ranges: 2.2% for AGIs below $10k, 1.0% for AGIs $10k-25k, 0.6% for AGIs $25k-50k, 0.6% for AGIs $50k-75k, 0.5% for AGIs $75k-100k, 0.7% for AGIs over 100k)
Net capital gain/loss: +$3,959 (reported on 17.5% of returns)
Here:
+$3,959
State:
+$13,591
(% of AGI for various income ranges: -2.0% for AGIs below $10k, -0.2% for AGIs $10k-25k, 0.2% for AGIs $25k-50k, 0.5% for AGIs $50k-75k, 0.7% for AGIs $75k-100k, 3.6% for AGIs over 100k)
Profit/loss from business: +$12,503 (reported on 10.7% of returns)
Here:
+$12,503
State:
+$17,520
(% of AGI for various income ranges: 5.6% for AGIs below $10k, 4.7% for AGIs $10k-25k, 2.7% for AGIs $25k-50k, 2.2% for AGIs $50k-75k, 2.0% for AGIs $75k-100k, 2.9% for AGIs over 100k)
IRA payment deduction: $3,056 (reported on 2.6% of returns)
08012:
$3,056
New Jersey:
$3,270
(% of AGI for various income ranges: 0.2% for AGIs below $10k, 0.2% for AGIs $10k-25k, 0.2% for AGIs $25k-50k, 0.2% for AGIs $50k-75k, 0.2% for AGIs $75k-100k, 0.1% for AGIs over 100k)
Self-employed pension: $10,398 (reported on 0.6% of returns)
Here:
$10,398
New Jersey:
$17,258
(% of AGI for various income ranges: 0.1% for AGIs $25k-50k, 0.1% for AGIs $50k-75k, 0.1% for AGIs $75k-100k, 0.2% for AGIs over 100k)
Total itemized deductions: $17,809 (23% of AGI, reported on 45.9% of returns)
Here:
$17,809
State:
$23,924
Here:
23.0% of AGI
State:
21.1% of AGI
(% of AGI for various income ranges: 13.2% for AGIs below $10k, 12.5% for AGIs $10k-25k, 14.6% for AGIs $25k-50k, 18.2% for AGIs $50k-75k, 18.9% for AGIs $75k-100k, 16.1% for AGIs over 100k)
Charity contributions deductions: $2,307 (3% of AGI, reported on 42.5% of returns)
Here:
$2,307
State:
$3,242
Here:
2.9% of AGI
State:
2.7% of AGI
(% of AGI for various income ranges: 0.6% for AGIs below $10k, 1.0% for AGIs $10k-25k, 1.6% for AGIs $25k-50k, 2.1% for AGIs $50k-75k, 2.2% for AGIs $75k-100k, 2.2% for AGIs over 100k)
Total tax: $6,491 (reported on 80.8% of returns)
08012:
$6,491
State:
$12,321
(% of AGI for various income ranges: 2.5% for AGIs below $10k, 4.5% for AGIs $10k-25k, 7.6% for AGIs $25k-50k, 8.9% for AGIs $50k-75k, 9.9% for AGIs $75k-100k, 15.6% for AGIs over 100k)
Earned income credit: $1,560 (reported on 9.4% of returns)
Here:
$1,560
State:
$1,711
Percentage of individuals using paid preparers for their 2004 taxes: 55.6%
Here:
56%
State:
65%
(% for various income ranges: 44.9% for AGIs below $10k, 54.9% for AGIs $10k-25k, 56.1% for AGIs $25k-50k, 59.8% for AGIs $50k-75k, 58.7% for AGIs $75k-100k, 62.2% for AGIs over 100k)
Likely homosexual households (counted as self-reported same-sex unmarried-partner households)
Lesbian couples: 0.1% of all households
Gay men: 0.3% of all households
Household received Food Stamps/SNAP in the past 12 months: 1,407 Household did not receive Food Stamps/SNAP in the past 12 months: 14,420
Women who had a birth in the past 12 months: 480 (319 now married, 159 unmarried) Women who did not have a birth in the past 12 months: 8,977 (3,501 now married, 5,480 unmarried)
Housing units in zip code 08012 with a mortgage: 7,282 (611 second mortgage, 557 both second mortgage and home equity loan) Houses without a mortgage: 669
Median monthly owner costs for units with a mortgage: $2,018 Median monthly owner costs for units without a mortgage: $1,011
Residents with income below the poverty level in 2022:
This zip code:
8.9%
Whole state:
9.7%
Residents with income below 50% of the poverty level in 2022:
This zip code:
3.9%
Whole state:
5.2%
Median number of rooms in houses and condos:
Here:
7.3
State:
6.8
Median number of rooms in apartments:
Here:
4.1
State:
3.9
Notable locations in this zip code not listed on our city pages
Notable locations in zip code 08012: Virtua Health System Emergency Medical Services Medic 46 (A), Saint Pius X Retreat House (B), Washington Township Ambulance and Rescue (C), Glendora Rescue Squad (D), Camden County Regional Emergency Training Center Lakeland Complex (E), Camden County Fire Department (F), Washington Township Fire Department Station 10 - 2 Whitman Square Station / Thomas E Hills Station (G), Washington Township Fire Department Station 10 - 1 Grenloch Fire Company Substation (H), Chews Landing Fire Department (I), Gloucester Township Fire District 4 Station 1 Central Avenue (J), Gloucester Township Fire District 3 Blenheim Volunteer Fire Company (K). Display/hide their locations on the map
Lakes and reservoirs: Hidden Lake (A), Irvin Lake (B), Lebanon Lake (C), Blackwood Lake (D), Bells Lake (E), Grenloch Lake (F). Display/hide their locations on the map
Streams, rivers, and creeks: Holly Run (A), Farrows Run (B), Bull Run (C), Pines Run (D), North Branch Big Timber Creek (E). Display/hide their locations on the map
In group quarters: 328 (-1 institutionalized population)
Size of family households: 4,395 2-persons, 2,835 3-persons, 1,925 4-persons, 1,001 5-persons, 303 6-persons, 145 7-or-more-persons
Size of nonfamily households: 4,261 1-person, 964 2-persons, 30 3-persons
4,435 married couples with children.
2,446 single-parent households (385 men, 2,061 women).
87.8% of residents of 08012 zip code speak English at home.
5.3% of residents speak Spanish at home (67% very well, 22% well, 8% not well, 3% not at all).
3.1% of residents speak other Indo-European language at home (63% very well, 24% well, 11% not well, 1% not at all).
3.0% of residents speak Asian or Pacific Island language at home (67% very well, 25% well, 8% not well).
0.4% of residents speak other language at home (92% very well, 8% not at all).
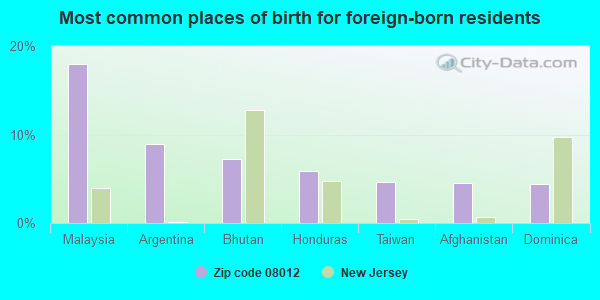
Foreign born population: 3,272 (8.1%) (56.1% of them are naturalized citizens)
This zip code:
8.1%
Whole state:
23.5%
18%Malaysia
9%Argentina
7%Bhutan
6%Honduras
5%Taiwan
4%Afghanistan
4%Dominica
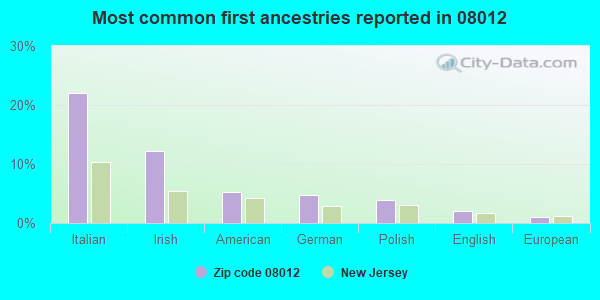
22%Italian
12%Irish
5%American
5%German
4%Polish
2%English
1%European
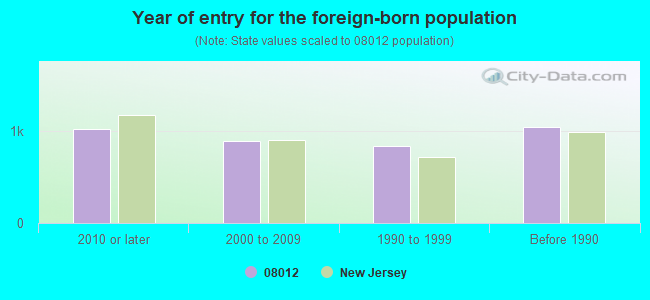
Year of entry for the foreign-born population
1,0232010 or later
8892000 to 2009
8401990 to 1999
1,041Before 1990
Major facilities with environmental interests located in this zip code:
BLACKHORSE PIKE RGNL SD HIGHLAND HIGH SCHOOL (580 ERIAL RD in BLACKWOOD, NJ)
COMPLIANCE ACTIVITY (Tracking inspections of insecticide, fungicide, and rodenticide, and toxic substances) (National Center for Education Statistics) - STATE ID-020 STATE MASTER (New Jersey environmental info) - NJEMS-012043, STATE CLEANUP SITE, NJEMS-027027, NJEMS-0390-020-07, PESTICIDES - APPLICATION, NJEMS-50139, AIR PROGRAM Small Quantity Generators, between 100 kg and 1000 kg of hazardous waste/month (Resource Conservation and Recovery Act (tracking hazardous waste)) Business SIC classification: ELEMENTARY AND SECONDARY SCHOOLS Organizations: BLACK HORSE PIKE RGNL BD OF ED, BLACK HORSE PIKE REGIONAL SCHOOL DIST (CONTACT/OWNER)
, BLACK HORSE PIKE REGIONAL (SCHOOL DISTRICT)
Alternative names: BLACKHORSE PIKE REGIONAL SCHOOL DISTRICT, HIGHLAND REGIONAL HIGH SCHOOL
GLOUCESTER TWP (1729 ERIAL RD in BLACKWOOD, NJ)
STATE MASTER (New Jersey environmental info) - NJEMS-004207, STATE CLEANUP SITE STATE MASTER (New Jersey environmental info) - NJEMS-005068, STATE CLEANUP SITE, NJEMS-0415-02-0005.1, LAND USE - COASTAL AND LAND USE, NJEMS-H5011, AIR PROGRAM (Resource Conservation and Recovery Act (tracking hazardous waste)) Business SIC classification: GASOLINE SERVICE STATIONS Organizations: GLOUCESTER TWP MUNICIPAL BUILDING Alternative names: GLOUCESTER TWP DPW, GLOUCESTER TWP OF DPW
GLOUCESTER TWP BD OF ED CHARLES LEWIS MIDDLE SCHOOL (875 ERIAL RD in BLACKWOOD, NJ)
(National Center for Education Statistics) - STATE ID-035 STATE MASTER (New Jersey environmental info) - NJEMS-1780-035-07, PESTICIDES - APPLICATION, NJEMS-013987, STATE CLEANUP SITE, NJEMS-50298, AIR PROGRAM (Resource Conservation and Recovery Act (tracking hazardous waste)) Business SIC classification: ELEMENTARY AND SECONDARY SCHOOLS Alternative names: GLOUCESTER TWP OF BD OF ED
GLOUCESTER TWP BD OF ED BLACKWOOD ELEMENTARY SCHOOL (260 BLENHEIM ERIAL RD in BLACKWOOD, NJ)
(National Center for Education Statistics) - STATE ID-020 STATE MASTER (New Jersey environmental info) - NJEMS-013988, STATE CLEANUP SITE, NJEMS-50293, AIR PROGRAM Business SIC classification: ELEMENTARY AND SECONDARY SCHOOLS
EXXON SERVICE STATION #32126 (715 BLACKHORSE PK in BLENHEIM, NJ)
STATE MASTER (New Jersey environmental info) - NJEMS-008378, STATE CLEANUP SITE, NJEMS-54271200000, EPCRA, NJEMS-84303600001, NJEMS-A5219, AIR PROGRAM (Resource Conservation and Recovery Act (tracking hazardous waste)) Business SIC classification: GASOLINE SERVICE STATIONS Organizations: EXXON MOBIL CORP, LEHIGH GAS CORP, EXXON CO USA (CONTACT/OPERATOR)
, EXXON MOBIL CORP USA (CONTACT/OWNER)
, LEHIGH GAS CORP (CONTACT/OWNER)
Alternative names: EXXON CO USA 32126
ACCENT CLEANERS @ GANTTOWN PLAZA (BLACKHORSE PARK GANTTOWN PLAZA in TURNERSVILLE, NJ)
AIR MINOR (AIRS/AFS) STATE MASTER (New Jersey environmental info) - NJEMS-L5515, AIR PROGRAM (Resource Conservation and Recovery Act (tracking hazardous waste)) Business SIC classification: DRYCLEANING PLANTS, EXCEPT RUG CLEANING
FANTASTIC FINISHES INC (707 S BLACKHORSE PIKE in BLACKWOOD, NJ)
STATE MASTER (New Jersey environmental info) - NJEMS-018755, STATE CLEANUP SITE, NJEMS-032611, NJEMS-79199000000, EPCRA, NJEMS-G5056, AIR PROGRAM, NJEMS-NJX000320556, HAZARDOUS WASTE PROGRAM (Resource Conservation and Recovery Act (tracking hazardous waste)) Business SIC classification: MOTOR VEHICLE DEALERS (NEW AND USED); TOP, BODY, AND UPHOLSTERY REPAIR SHOPS AND PAINT SHOPS Organizations: CAMMARATA OSCAR
GETTY PETROLEUM CORP (2050 BLACKHORSE PIKE in TURNERSVILLE, NJ)
STATE MASTER (New Jersey environmental info) - NJEMS-018101, STATE CLEANUP SITE, NJEMS-55236, AIR PROGRAM (Resource Conservation and Recovery Act (tracking hazardous waste)) Business SIC classification: GASOLINE SERVICE STATIONS Organizations: MATTERA WILLIAM & TOTO EDMOND JR (CONTACT/OWNER)
Alternative names: GETTY SERVICE STATION 56159
HAUSMAN BUS SALES INC (14 HARMON DR in BLACKWOOD, NJ)
STATE MASTER (New Jersey environmental info) - NJEMS-NJX000279869, HAZARDOUS WASTE PROGRAM (Resource Conservation and Recovery Act (tracking hazardous waste))
AMAZING AUTO PAINT SHOP (409 S BLACK HORSE PIKE in BLACKWOOD, NJ)
STATE MASTER (New Jersey environmental info) - NJEMS-75971800000, EPCRA, NJEMS-G5008, AIR PROGRAM (Resource Conservation and Recovery Act (tracking hazardous waste)) Business SIC classification: TOP, BODY, AND UPHOLSTERY REPAIR SHOPS AND PAINT SHOPS Organizations: RICHTER ELWOOD Alternative names: AMAZING PAINT SHOP THE
PENNCO TECH (99 ERIAL ROAD in BLACKWOOD, NJ)
STATE MASTER (New Jersey environmental info) - NJEMS-018758, STATE CLEANUP SITE, NJEMS-0415319, DRINKING WATER PROGRAM, NJEMS-0415323, NJEMS-46822800000, EPCRA, NJEMS-NJD981134554, HAZARDOUS WASTE PROGRAM Small Quantity Generators, between 100 kg and 1000 kg of hazardous waste/month (Resource Conservation and Recovery Act (tracking hazardous waste)) Business SIC classification: VOCATIONAL SCHOOLS Organizations: OWNERNAME (CONTACT/OWNER)
, H&B INVESTMENTS INC (CONTACT/OWNER)
PRIME DESIGN INC (106 HARMON DR in BLACKWOOD, NJ)
STATE MASTER (New Jersey environmental info) - NJEMS-51896, AIR PROGRAM, NJEMS-NRG000000740, HAZARDOUS WASTE PROGRAM Small Quantity Generators, between 100 kg and 1000 kg of hazardous waste/month (Resource Conservation and Recovery Act (tracking hazardous waste)) Organizations: RON & DENNIS POLLARD (CONTACT/OWNER)
Housing units lacking complete plumbing facilities: 0.6% Housing units lacking complete kitchen facilities: 1.5%
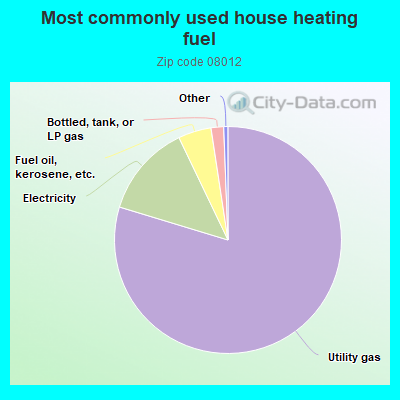
79.7%Utility gas
13.2%Electricity
4.7%Fuel oil, kerosene, etc.
1.8%Bottled, tank, or LP gas
Population in 1990: 35,874. Population change in the 1990s: +3,334 (+9.3%).
Place of birth for U.S.-born residents:
This state: 22,860
Northeast: 11,429
Midwest: 508
South: 1,484
West: 285
64% of the 08012 zip code residents lived in the same house 5 years ago. Out of people who lived in different houses, 54% lived in this county. Out of people who lived in different counties, 50% lived in New Jersey.
90% of the 08012 zip code residents lived in the same house 1 year ago. Out of people who lived in different houses, 40% moved from this county. Out of people who lived in different houses, 29% moved from different county within same state. Out of people who lived in different houses, 30% moved from different state. Out of people who lived in different houses, 2% moved from abroad.
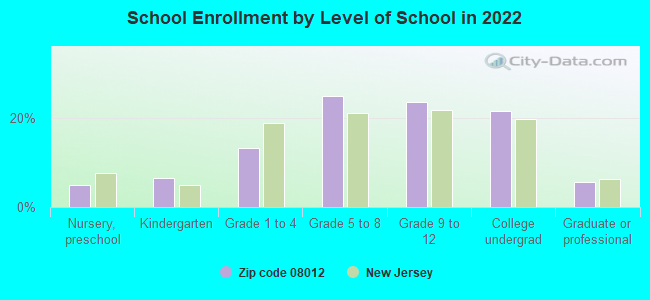
Private vs. public school enrollment:
Students in private schools in grades 1 to 8 (elementary and middle school): 195
Here:
5.6%
New Jersey:
12.3%
Students in private schools in grades 9 to 12 (high school): 267
Here:
12.4%
New Jersey:
13.1%
Students in private undergraduate colleges: 373
Here:
19.2%
New Jersey:
33.2%
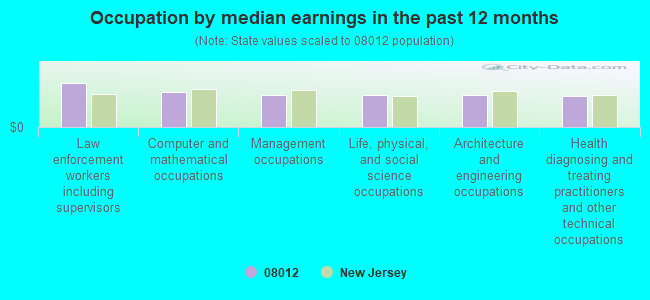
Occupation by median earnings in the past 12 months ($)
111,630Law enforcement workers including supervisors
88,915Computer and mathematical occupations
82,279Management occupations
81,925Life, physical, and social science occupations
81,152Architecture and engineering occupations
79,756Health diagnosing and treating practitioners and other technical occupations
Companies with biggest federal contracts located in this zip code:
A P CONSTRUCTION INC (915 S BLACKHORSE PIKE in BLACKWOOD, NJ) : $2,918,068 in 12 contractsfrom 2002 to 2005
Contracts for Maintenance, Repair or Alteration of Real Property -- Other Non-Building Facilities, Maintenance, Repair or Alteration of Real Property -- Dredging by U.S. Army Corps of Engineers - civil program financing only, Army Signed by year:2000: $0; 2001: $0; 2002: $1,390,000; 2003: $817,858; 2004: $652,996; 2005: $57,214; 2006: $0.
Biggest contracts:
$900,000 with U.S. Army Corps of Engineers - civil program financing only for Maintenance, Repair or Alteration of Real Property -- Other Non-Building Facilities. Signed on 2002-08-09. Completion date: 2003-02-17.
$490,000, same as above.Signed on 2002-10-31. Completion date: 2003-02-17.
$372,514, same as above.Signed on 2003-03-26. Completion date: 2003-03-26.
$306,220 with Army for Maintenance, Repair or Alteration of Real Property -- Dredging. Taking place in PA. Signed on 2004-05-05. Completion date: 2004-09-17.
CDM ELECTRONICS, INC (130 AMERICAN BLVD (TURNERS in BLACKWOOD, NJ; small business) : $1,181,449 in 77 contractsfrom 2001 to 2006
Contracts for Connectors, Electrical, Antennas, Waveguides, and Related Equipment, Wire and Cable, Electrical, Cable, Cord, and Wire Assemblies: Communications Equipment, and moreby Defense Logistics Agency, Air Force, Army, Navy, and others Signed by year:2000: $0; 2001: $85,788; 2002: $39,460; 2003: $139,206; 2004: $288,463; 2005: $242,732; 2006: $385,800.
Biggest contracts:
$89,268 with Defense Logistics Agency for Connectors, Electrical. Signed on 2004-03-31. Completion date: 2004-08-28.
$85,788 with Air Force for Connectors, Electrical. Signed on 2001-04-11. Completion date: 2001-08-15.
$83,251 with Defense Logistics Agency for Antennas, Waveguides, and Related Equipment. Signed on 2006-05-08. Completion date: 2006-10-05.
$61,787 with Defense Logistics Agency for Connectors, Electrical. Signed on 2004-02-10. Completion date: 2004-08-03.
ELECTRO PARTS, INC (1271 LITTLE GLOUCESTER ROA in BLACKWOOD, NJ; small business) : $821,793 in 69 contractsfrom 2005 to 2006
Contracts for Electric Vehicular Lights and Fixtures, Electrical and Electronic assemblies, Boards, Cards, and Associated Hardware, Cable, Cord, and Wire Assemblies: Communications Equipment, Connectors, Electrical, and moreby Defense Logistics Agency Signed by year:2000: $0; 2001: $0; 2002: $0; 2003: $0; 2004: $0; 2005: $451,908; 2006: $369,885.
Biggest contracts:
$55,700 with Defense Logistics Agency for Electric Vehicular Lights and Fixtures. Signed on 2006-01-23. Completion date: 2006-01-30.
$54,810 with Defense Logistics Agency for Electrical and Electronic assemblies, Boards, Cards, and Associated Hardware. Signed on 2005-05-12. Completion date: 2005-10-09.
$52,800 with Defense Logistics Agency for Cable, Cord, and Wire Assemblies: Communications Equipment. Signed on 2005-09-12. Completion date: 2006-02-09.
$42,930 with Defense Logistics Agency for Electrical and Electronic assemblies, Boards, Cards, and Associated Hardware. Signed on 2005-11-15. Completion date: 2006-03-21.
SICILIAN CHEFS INC (1001 LOW LAND RD STE 311 in BLACKWOOD, NJ; small business) : $754,358 in 5 contractsfrom 2004 to 2006
Contracts for Food Items For Resale by Defense Commissary Agency Signed by year:2000: $0; 2001: $0; 2002: $0; 2003: $0; 2004: $135,539; 2005: $421,866; 2006: $196,953.
Biggest contracts:
$236,159 with Defense Commissary Agency for Food Items For Resale. Signed on 2005-04-01. Completion date: 2005-09-30.
$196,953, same as above.Signed on 2006-01-01. Completion date: 2006-03-31.
$135,539, same as above.Signed on 2004-10-01. Completion date: 2005-02-28.
$110,018, same as above.Signed on 2005-10-01. Completion date: 2005-12-31.
T S SERVICE CORP (1 T AND G WAY in BLACKWOOD, NJ) : $211,717 in 7 contractsfrom 2000 to 2005
Contracts for Maintenance, Repair and Rebuilding of Equipment -- Materials Handling Equipment, Maintenance, Repair and Rebuilding of Equipment -- Food Preparation and Serving Equipment by Defense Commissary Agency, Department of Defense Signed by year:2000: $35,720; 2001: $24,452; 2002: $30,204; 2003: $51,304; 2004: $51,776; 2005: $18,261; 2006: $0.
Biggest contracts:
$51,776 with Defense Commissary Agency for Maintenance, Repair and Rebuilding of Equipment -- Materials Handling Equipment. Signed on 2004-09-01. Completion date: 2005-08-31.
$51,304 with Department of Defense for Maintenance, Repair and Rebuilding of Equipment -- Materials Handling Equipment. Signed on 2003-08-08. Completion date: 2003-08-31.
$35,720, same as above.Signed on 2000-08-01. Completion date: 2000-08-31.
$30,204 with Department of Defense for Maintenance, Repair and Rebuilding of Equipment -- Food Preparation and Serving Equipment. Signed on 2002-07-30. Completion date: 2003-08-31.
LINZCO JC INC (6 N BLACK HORSE PIKE in BLACKWOOD, NJ; small business) : $46,710 in 12 contractsfrom 1999 to 2006
Contracts for Night Vision Equipment, Emitted and Reflected Radiation, Miscellaneous Electric Power and Distribution Equipment, Cable, Cord, and Wire Assemblies: Communications Equipment, Aircraft Air Conditioning, Heating, and Pressurizing Equipment, and moreby Army, Defense Logistics Agency Signed by year:2000: $0; 2001: $0; 2002: $0; 2003: $0; 2004: $11,787; 2005: $42,173; 2006: $21,971.
Biggest contracts:
$53,550 with Army for Night Vision Equipment, Emitted and Reflected Radiation. Signed on 2005-07-07. Completion date: 2005-09-23.
$21,679 with Defense Logistics Agency for Miscellaneous Electric Power and Distribution Equipment. Signed on 2005-11-19. Completion date: 2006-05-16.
$18,863, same as above.Signed on 2006-03-03. Completion date: 2006-07-08.
$9,975, same as above.Signed on 2005-03-23. Completion date: 2005-06-23.
GLASSBLOWERS COM INC (234 BELLS LAKE ROAD in TURNERSVILLE, NJ; small business)
$40,800 with Army for Laboratory Equipment and Supplies. Signed on 2003-09-03. Completion date: 2003-10-15.
MONARCH BOILER CONSTRUCTION CO (850 W BLENHEIM AVE in BLENHEIM, NJ; small business) : $36,399 in 4 contractsfrom 2001 to 2003
$160,000 with Navy for Water Pollution -- Operational Systems Development (R&D). Signed on 2002-09-12. Completion date: 2003-03-31.
$38,000, same as above.Signed on 2002-12-12. Completion date: 2003-03-31.
$36,399 with Army for Industrial Boilers. Signed on 2001-09-28. Completion date: 2001-10-27.
-$198,000 with Navy for Water Pollution -- Operational Systems Development (R&D). Signed on 2003-08-19. Completion date: 2003-08-19.
DELSEA FASTENERS, INC. (351 LANDING ROAD in BLACKWOOD, NJ; small business)
$34,020 with Defense Logistics Agency for Screws. Signed on 2000-02-22. Completion date: 2000-08-04.
Q S R INDUSTRIAL SUPPLY INC (534 SOUTH BLACK HORSE PIKE in BLACKWOOD, NJ; small business)
$19,152 with Defense Logistics Agency for Electric Lamps. Signed on 2005-10-18. Completion date: 2005-11-18.
Top industries in this zip code by the number of employees in 2005:
2002 - 2018 National Fire Incident Reporting System (NFIRS) incidents
According to the data from the years 2002 - 2018 the average number of fire incidents per year is 156. The highest number of reported fires - 228 took place in 2017, and the least - 16 in 2002. The data has a growing trend.
When looking into fire subcategories, the most reports belonged to: Structure Fires (57.1%), and Outside Fires (26.8%).
Fire incident types reported to NFIRS in Zip Code 08012


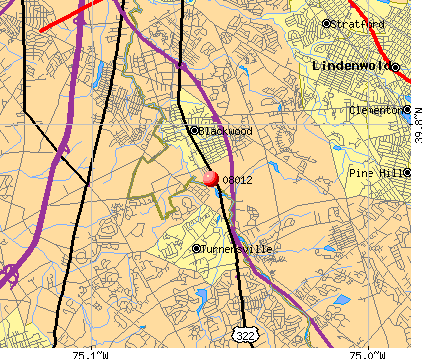 Nearest zip codes: 08029, 08021, 08084, 08083, 08080, 08078.


 According to the data from the years 2002 - 2018 the average number of fire incidents per year is 156. The highest number of reported fires - 228 took place in 2017, and the least - 16 in 2002. The data has a growing trend.
 When looking into fire subcategories, the most reports belonged to: Structure Fires (57.1%), and Outside Fires (26.8%).