Estimated zip code population in 2022: 13,586
Zip code population in 2010: 13,675
Zip code population in 2000: 13,500
Houses and condos: 6,238
Renter-occupied apartments: 2,762
% of renters here:
47%State:
35%
March 2022 cost of living index in zip code 08107: 101.9
(near average, U.S. average is 100)
Land area: 1.8
sq. mi.
Water area: 0.1
sq. mi.
Population density: 7,606 people per square mile (high).
OSM Map
Google Map
MSN Map
OSM Map
General Map
Google Map
MSN Map
OSM Map
Google Map
MSN Map
OSM Map
Google Map
MSN Map
Please wait while loading the map...
Real estate property taxes paid for housing units in 2022:
This zip code:
3.0% ($7,765)New Jersey:
2.1% ($8,897)
Median real estate property taxes paid for housing units with mortgages in 2022: $7,852 (3.0%)
Median real estate property taxes paid for housing units with no mortgage in 2022: $7,582 (3.3%)
Profiles of local businesses
Business Search - 14 Million verified businesses
Males: 6,569 Females: 7,017
For population 25 years and over in 08107:
High school or higher: 89.8%Bachelor's degree or higher: 35.1%Graduate or professional degree: 11.7%Unemployed: 6.8%Mean travel time to work (commute): 26.5 minutes
For population 15 years and over in 08107:
Never married: 44.0%Now married: 38.2%Separated: 2.7%Widowed: 5.2%Divorced: 9.9%
Zip code 08107 compared to state average:
Median house value below state average. Foreign-born population percentage significantly below state average. Length of stay since moving in significantly above state average. House age above state average. 8,042 59.2% White 2,496 18.4% Black 2,214 16.3% Hispanic or Latino 372 2.7% Two or more races 357 2.6% Asian 92 0.7% Some other race 11 0.08% American Indian
Data:
Median household income ($)
Median household income (% change since 2000)
Household income diversity
Ratio of average income to average house value (%)
Ratio of average income to average rent
Median household income ($) - White
Median household income ($) - Black or African American
Median household income ($) - Asian
Median household income ($) - Hispanic or Latino
Median household income ($) - American Indian and Alaska Native
Median household income ($) - Multirace
Median household income ($) - Other Race
Median household income for houses/condos with a mortgage ($)
Median household income for apartments without a mortgage ($)
Races - White alone (%)
Races - White alone (% change since 2000)
Races - Black alone (%)
Races - Black alone (% change since 2000)
Races - American Indian alone (%)
Races - American Indian alone (% change since 2000)
Races - Asian alone (%)
Races - Asian alone (% change since 2000)
Races - Hispanic (%)
Races - Hispanic (% change since 2000)
Races - Native Hawaiian and Other Pacific Islander alone (%)
Races - Native Hawaiian and Other Pacific Islander alone (% change since 2000)
Races - Two or more races (%)
Races - Two or more races (% change since 2000)
Races - Other race alone (%)
Races - Other race alone (% change since 2000)
Racial diversity
Unemployment (%)
Unemployment (% change since 2000)
Unemployment (%) - White
Unemployment (%) - Black or African American
Unemployment (%) - Asian
Unemployment (%) - Hispanic or Latino
Unemployment (%) - American Indian and Alaska Native
Unemployment (%) - Multirace
Unemployment (%) - Other Race
Population density (people per square mile)
Population - Males (%)
Population - Females (%)
Population - Males (%) - White
Population - Males (%) - Black or African American
Population - Males (%) - Asian
Population - Males (%) - Hispanic or Latino
Population - Males (%) - American Indian and Alaska Native
Population - Males (%) - Multirace
Population - Males (%) - Other Race
Population - Females (%) - White
Population - Females (%) - Black or African American
Population - Females (%) - Asian
Population - Females (%) - Hispanic or Latino
Population - Females (%) - American Indian and Alaska Native
Population - Females (%) - Multirace
Population - Females (%) - Other Race
Coronavirus confirmed cases (Apr 27, 2024)
Deaths caused by coronavirus (Apr 27, 2024)
Coronavirus confirmed cases (per 100k population) (Apr 27, 2024)
Deaths caused by coronavirus (per 100k population) (Apr 27, 2024)
Daily increase in number of cases (Apr 27, 2024)
Weekly increase in number of cases (Apr 27, 2024)
Cases doubled (in days) (Apr 27, 2024)
Hospitalized patients (Apr 18, 2022)
Negative test results (Apr 18, 2022)
Total test results (Apr 18, 2022)
COVID Vaccine doses distributed (per 100k population) (Sep 19, 2023)
COVID Vaccine doses administered (per 100k population) (Sep 19, 2023)
COVID Vaccine doses distributed (Sep 19, 2023)
COVID Vaccine doses administered (Sep 19, 2023)
Likely homosexual households (%)
Likely homosexual households (% change since 2000)
Likely homosexual households - Lesbian couples (%)
Likely homosexual households - Lesbian couples (% change since 2000)
Likely homosexual households - Gay men (%)
Likely homosexual households - Gay men (% change since 2000)
Cost of living index
Median gross rent ($)
Median contract rent ($)
Median monthly housing costs ($)
Median house or condo value ($)
Median house or condo value ($ change since 2000)
Mean house or condo value by units in structure - 1, detached ($)
Mean house or condo value by units in structure - 1, attached ($)
Mean house or condo value by units in structure - 2 ($)
Mean house or condo value by units in structure by units in structure - 3 or 4 ($)
Mean house or condo value by units in structure - 5 or more ($)
Mean house or condo value by units in structure - Boat, RV, van, etc. ($)
Mean house or condo value by units in structure - Mobile home ($)
Median house or condo value ($) - White
Median house or condo value ($) - Black or African American
Median house or condo value ($) - Asian
Median house or condo value ($) - Hispanic or Latino
Median house or condo value ($) - American Indian and Alaska Native
Median house or condo value ($) - Multirace
Median house or condo value ($) - Other Race
Median resident age
Resident age diversity
Median resident age - Males
Median resident age - Females
Median resident age - White
Median resident age - Black or African American
Median resident age - Asian
Median resident age - Hispanic or Latino
Median resident age - American Indian and Alaska Native
Median resident age - Multirace
Median resident age - Other Race
Median resident age - Males - White
Median resident age - Males - Black or African American
Median resident age - Males - Asian
Median resident age - Males - Hispanic or Latino
Median resident age - Males - American Indian and Alaska Native
Median resident age - Males - Multirace
Median resident age - Males - Other Race
Median resident age - Females - White
Median resident age - Females - Black or African American
Median resident age - Females - Asian
Median resident age - Females - Hispanic or Latino
Median resident age - Females - American Indian and Alaska Native
Median resident age - Females - Multirace
Median resident age - Females - Other Race
Commute - mean travel time to work (minutes)
Travel time to work - Less than 5 minutes (%)
Travel time to work - Less than 5 minutes (% change since 2000)
Travel time to work - 5 to 9 minutes (%)
Travel time to work - 5 to 9 minutes (% change since 2000)
Travel time to work - 10 to 19 minutes (%)
Travel time to work - 10 to 19 minutes (% change since 2000)
Travel time to work - 20 to 29 minutes (%)
Travel time to work - 20 to 29 minutes (% change since 2000)
Travel time to work - 30 to 39 minutes (%)
Travel time to work - 30 to 39 minutes (% change since 2000)
Travel time to work - 40 to 59 minutes (%)
Travel time to work - 40 to 59 minutes (% change since 2000)
Travel time to work - 60 to 89 minutes (%)
Travel time to work - 60 to 89 minutes (% change since 2000)
Travel time to work - 90 or more minutes (%)
Travel time to work - 90 or more minutes (% change since 2000)
Marital status - Never married (%)
Marital status - Now married (%)
Marital status - Separated (%)
Marital status - Widowed (%)
Marital status - Divorced (%)
Median family income ($)
Median family income (% change since 2000)
Median non-family income ($)
Median non-family income (% change since 2000)
Median per capita income ($)
Median per capita income (% change since 2000)
Median family income ($) - White
Median family income ($) - Black or African American
Median family income ($) - Asian
Median family income ($) - Hispanic or Latino
Median family income ($) - American Indian and Alaska Native
Median family income ($) - Multirace
Median family income ($) - Other Race
Median year house/condo built
Median year apartment built
Year house built - Built 2005 or later (%)
Year house built - Built 2000 to 2004 (%)
Year house built - Built 1990 to 1999 (%)
Year house built - Built 1980 to 1989 (%)
Year house built - Built 1970 to 1979 (%)
Year house built - Built 1960 to 1969 (%)
Year house built - Built 1950 to 1959 (%)
Year house built - Built 1940 to 1949 (%)
Year house built - Built 1939 or earlier (%)
Average household size
Household density (households per square mile)
Average household size - White
Average household size - Black or African American
Average household size - Asian
Average household size - Hispanic or Latino
Average household size - American Indian and Alaska Native
Average household size - Multirace
Average household size - Other Race
Occupied housing units (%)
Vacant housing units (%)
Owner occupied housing units (%)
Renter occupied housing units (%)
Vacancy status - For rent (%)
Vacancy status - For sale only (%)
Vacancy status - Rented or sold, not occupied (%)
Vacancy status - For seasonal, recreational, or occasional use (%)
Vacancy status - For migrant workers (%)
Vacancy status - Other vacant (%)
Residents with income below the poverty level (%)
Residents with income below 50% of the poverty level (%)
Children below poverty level (%)
Poor families by family type - Married-couple family (%)
Poor families by family type - Male, no wife present (%)
Poor families by family type - Female, no husband present (%)
Poverty status for native-born residents (%)
Poverty status for foreign-born residents (%)
Poverty among high school graduates not in families (%)
Poverty among people who did not graduate high school not in families (%)
Residents with income below the poverty level (%) - White
Residents with income below the poverty level (%) - Black or African American
Residents with income below the poverty level (%) - Asian
Residents with income below the poverty level (%) - Hispanic or Latino
Residents with income below the poverty level (%) - American Indian and Alaska Native
Residents with income below the poverty level (%) - Multirace
Residents with income below the poverty level (%) - Other Race
Air pollution - Air Quality Index (AQI)
Air pollution - CO
Air pollution - NO2
Air pollution - SO2
Air pollution - Ozone
Air pollution - PM10
Air pollution - PM25
Air pollution - Pb
Crime - Murders per 100,000 population
Crime - Rapes per 100,000 population
Crime - Robberies per 100,000 population
Crime - Assaults per 100,000 population
Crime - Burglaries per 100,000 population
Crime - Thefts per 100,000 population
Crime - Auto thefts per 100,000 population
Crime - Arson per 100,000 population
Crime - City-data.com crime index
Crime - Violent crime index
Crime - Property crime index
Crime - Murders per 100,000 population (5 year average)
Crime - Rapes per 100,000 population (5 year average)
Crime - Robberies per 100,000 population (5 year average)
Crime - Assaults per 100,000 population (5 year average)
Crime - Burglaries per 100,000 population (5 year average)
Crime - Thefts per 100,000 population (5 year average)
Crime - Auto thefts per 100,000 population (5 year average)
Crime - Arson per 100,000 population (5 year average)
Crime - City-data.com crime index (5 year average)
Crime - Violent crime index (5 year average)
Crime - Property crime index (5 year average)
1996 Presidential Elections Results (%) - Democratic Party (Clinton)
1996 Presidential Elections Results (%) - Republican Party (Dole)
1996 Presidential Elections Results (%) - Other
2000 Presidential Elections Results (%) - Democratic Party (Gore)
2000 Presidential Elections Results (%) - Republican Party (Bush)
2000 Presidential Elections Results (%) - Other
2004 Presidential Elections Results (%) - Democratic Party (Kerry)
2004 Presidential Elections Results (%) - Republican Party (Bush)
2004 Presidential Elections Results (%) - Other
2008 Presidential Elections Results (%) - Democratic Party (Obama)
2008 Presidential Elections Results (%) - Republican Party (McCain)
2008 Presidential Elections Results (%) - Other
2012 Presidential Elections Results (%) - Democratic Party (Obama)
2012 Presidential Elections Results (%) - Republican Party (Romney)
2012 Presidential Elections Results (%) - Other
2016 Presidential Elections Results (%) - Democratic Party (Clinton)
2016 Presidential Elections Results (%) - Republican Party (Trump)
2016 Presidential Elections Results (%) - Other
2020 Presidential Elections Results (%) - Democratic Party (Biden)
2020 Presidential Elections Results (%) - Republican Party (Trump)
2020 Presidential Elections Results (%) - Other
Ancestries Reported - Arab (%)
Ancestries Reported - Czech (%)
Ancestries Reported - Danish (%)
Ancestries Reported - Dutch (%)
Ancestries Reported - English (%)
Ancestries Reported - French (%)
Ancestries Reported - French Canadian (%)
Ancestries Reported - German (%)
Ancestries Reported - Greek (%)
Ancestries Reported - Hungarian (%)
Ancestries Reported - Irish (%)
Ancestries Reported - Italian (%)
Ancestries Reported - Lithuanian (%)
Ancestries Reported - Norwegian (%)
Ancestries Reported - Polish (%)
Ancestries Reported - Portuguese (%)
Ancestries Reported - Russian (%)
Ancestries Reported - Scotch-Irish (%)
Ancestries Reported - Scottish (%)
Ancestries Reported - Slovak (%)
Ancestries Reported - Subsaharan African (%)
Ancestries Reported - Swedish (%)
Ancestries Reported - Swiss (%)
Ancestries Reported - Ukrainian (%)
Ancestries Reported - United States (%)
Ancestries Reported - Welsh (%)
Ancestries Reported - West Indian (%)
Ancestries Reported - Other (%)
Educational Attainment - No schooling completed (%)
Educational Attainment - Less than high school (%)
Educational Attainment - High school or equivalent (%)
Educational Attainment - Less than 1 year of college (%)
Educational Attainment - 1 or more years of college (%)
Educational Attainment - Associate degree (%)
Educational Attainment - Bachelor's degree (%)
Educational Attainment - Master's degree (%)
Educational Attainment - Professional school degree (%)
Educational Attainment - Doctorate degree (%)
School Enrollment - Nursery, preschool (%)
School Enrollment - Kindergarten (%)
School Enrollment - Grade 1 to 4 (%)
School Enrollment - Grade 5 to 8 (%)
School Enrollment - Grade 9 to 12 (%)
School Enrollment - College undergrad (%)
School Enrollment - Graduate or professional (%)
School Enrollment - Not enrolled in school (%)
School enrollment - Public schools (%)
School enrollment - Private schools (%)
School enrollment - Not enrolled (%)
Median number of rooms in houses and condos
Median number of rooms in apartments
Housing units lacking complete plumbing facilities (%)
Housing units lacking complete kitchen facilities (%)
Density of houses
Urban houses (%)
Rural houses (%)
Households with people 60 years and over (%)
Households with people 65 years and over (%)
Households with people 75 years and over (%)
Households with one or more nonrelatives (%)
Households with no nonrelatives (%)
Population in households (%)
Family households (%)
Nonfamily households (%)
Population in families (%)
Family households with own children (%)
Median number of bedrooms in owner occupied houses
Mean number of bedrooms in owner occupied houses
Median number of bedrooms in renter occupied houses
Mean number of bedrooms in renter occupied houses
Median number of vehichles in owner occupied houses
Mean number of vehichles in owner occupied houses
Median number of vehichles in renter occupied houses
Mean number of vehichles in renter occupied houses
Mortgage status - with mortgage (%)
Mortgage status - with second mortgage (%)
Mortgage status - with home equity loan (%)
Mortgage status - with both second mortgage and home equity loan (%)
Mortgage status - without a mortgage (%)
Average family size
Average family size - White
Average family size - Black or African American
Average family size - Asian
Average family size - Hispanic or Latino
Average family size - American Indian and Alaska Native
Average family size - Multirace
Average family size - Other Race
Geographical mobility - Same house 1 year ago (%)
Geographical mobility - Moved within same county (%)
Geographical mobility - Moved from different county within same state (%)
Geographical mobility - Moved from different state (%)
Geographical mobility - Moved from abroad (%)
Place of birth - Born in state of residence (%)
Place of birth - Born in other state (%)
Place of birth - Native, outside of US (%)
Place of birth - Foreign born (%)
Housing units in structures - 1, detached (%)
Housing units in structures - 1, attached (%)
Housing units in structures - 2 (%)
Housing units in structures - 3 or 4 (%)
Housing units in structures - 5 to 9 (%)
Housing units in structures - 10 to 19 (%)
Housing units in structures - 20 to 49 (%)
Housing units in structures - 50 or more (%)
Housing units in structures - Mobile home (%)
Housing units in structures - Boat, RV, van, etc. (%)
House/condo owner moved in on average (years ago)
Renter moved in on average (years ago)
Year householder moved into unit - Moved in 1999 to March 2000 (%)
Year householder moved into unit - Moved in 1995 to 1998 (%)
Year householder moved into unit - Moved in 1990 to 1994 (%)
Year householder moved into unit - Moved in 1980 to 1989 (%)
Year householder moved into unit - Moved in 1970 to 1979 (%)
Year householder moved into unit - Moved in 1969 or earlier (%)
Means of transportation to work - Drove car alone (%)
Means of transportation to work - Carpooled (%)
Means of transportation to work - Public transportation (%)
Means of transportation to work - Bus or trolley bus (%)
Means of transportation to work - Streetcar or trolley car (%)
Means of transportation to work - Subway or elevated (%)
Means of transportation to work - Railroad (%)
Means of transportation to work - Ferryboat (%)
Means of transportation to work - Taxicab (%)
Means of transportation to work - Motorcycle (%)
Means of transportation to work - Bicycle (%)
Means of transportation to work - Walked (%)
Means of transportation to work - Other means (%)
Working at home (%)
Industry diversity
Most Common Industries - Agriculture, forestry, fishing and hunting, and mining (%)
Most Common Industries - Agriculture, forestry, fishing and hunting (%)
Most Common Industries - Mining, quarrying, and oil and gas extraction (%)
Most Common Industries - Construction (%)
Most Common Industries - Manufacturing (%)
Most Common Industries - Wholesale trade (%)
Most Common Industries - Retail trade (%)
Most Common Industries - Transportation and warehousing, and utilities (%)
Most Common Industries - Transportation and warehousing (%)
Most Common Industries - Utilities (%)
Most Common Industries - Information (%)
Most Common Industries - Finance and insurance, and real estate and rental and leasing (%)
Most Common Industries - Finance and insurance (%)
Most Common Industries - Real estate and rental and leasing (%)
Most Common Industries - Professional, scientific, and management, and administrative and waste management services (%)
Most Common Industries - Professional, scientific, and technical services (%)
Most Common Industries - Management of companies and enterprises (%)
Most Common Industries - Administrative and support and waste management services (%)
Most Common Industries - Educational services, and health care and social assistance (%)
Most Common Industries - Educational services (%)
Most Common Industries - Health care and social assistance (%)
Most Common Industries - Arts, entertainment, and recreation, and accommodation and food services (%)
Most Common Industries - Arts, entertainment, and recreation (%)
Most Common Industries - Accommodation and food services (%)
Most Common Industries - Other services, except public administration (%)
Most Common Industries - Public administration (%)
Occupation diversity
Most Common Occupations - Management, business, science, and arts occupations (%)
Most Common Occupations - Management, business, and financial occupations (%)
Most Common Occupations - Management occupations (%)
Most Common Occupations - Business and financial operations occupations (%)
Most Common Occupations - Computer, engineering, and science occupations (%)
Most Common Occupations - Computer and mathematical occupations (%)
Most Common Occupations - Architecture and engineering occupations (%)
Most Common Occupations - Life, physical, and social science occupations (%)
Most Common Occupations - Education, legal, community service, arts, and media occupations (%)
Most Common Occupations - Community and social service occupations (%)
Most Common Occupations - Legal occupations (%)
Most Common Occupations - Education, training, and library occupations (%)
Most Common Occupations - Arts, design, entertainment, sports, and media occupations (%)
Most Common Occupations - Healthcare practitioners and technical occupations (%)
Most Common Occupations - Health diagnosing and treating practitioners and other technical occupations (%)
Most Common Occupations - Health technologists and technicians (%)
Most Common Occupations - Service occupations (%)
Most Common Occupations - Healthcare support occupations (%)
Most Common Occupations - Protective service occupations (%)
Most Common Occupations - Fire fighting and prevention, and other protective service workers including supervisors (%)
Most Common Occupations - Law enforcement workers including supervisors (%)
Most Common Occupations - Food preparation and serving related occupations (%)
Most Common Occupations - Building and grounds cleaning and maintenance occupations (%)
Most Common Occupations - Personal care and service occupations (%)
Most Common Occupations - Sales and office occupations (%)
Most Common Occupations - Sales and related occupations (%)
Most Common Occupations - Office and administrative support occupations (%)
Most Common Occupations - Natural resources, construction, and maintenance occupations (%)
Most Common Occupations - Farming, fishing, and forestry occupations (%)
Most Common Occupations - Construction and extraction occupations (%)
Most Common Occupations - Installation, maintenance, and repair occupations (%)
Most Common Occupations - Production, transportation, and material moving occupations (%)
Most Common Occupations - Production occupations (%)
Most Common Occupations - Transportation occupations (%)
Most Common Occupations - Material moving occupations (%)
People in Group quarters - Institutionalized population (%)
People in Group quarters - Correctional institutions (%)
People in Group quarters - Federal prisons and detention centers (%)
People in Group quarters - Halfway houses (%)
People in Group quarters - Local jails and other confinement facilities (including police lockups) (%)
People in Group quarters - Military disciplinary barracks (%)
People in Group quarters - State prisons (%)
People in Group quarters - Other types of correctional institutions (%)
People in Group quarters - Nursing homes (%)
People in Group quarters - Hospitals/wards, hospices, and schools for the handicapped (%)
People in Group quarters - Hospitals/wards and hospices for chronically ill (%)
People in Group quarters - Hospices or homes for chronically ill (%)
People in Group quarters - Military hospitals or wards for chronically ill (%)
People in Group quarters - Other hospitals or wards for chronically ill (%)
People in Group quarters - Hospitals or wards for drug/alcohol abuse (%)
People in Group quarters - Mental (Psychiatric) hospitals or wards (%)
People in Group quarters - Schools, hospitals, or wards for the mentally retarded (%)
People in Group quarters - Schools, hospitals, or wards for the physically handicapped (%)
People in Group quarters - Institutions for the deaf (%)
People in Group quarters - Institutions for the blind (%)
People in Group quarters - Orthopedic wards and institutions for the physically handicapped (%)
People in Group quarters - Wards in general hospitals for patients who have no usual home elsewhere (%)
People in Group quarters - Wards in military hospitals for patients who have no usual home elsewhere (%)
People in Group quarters - Juvenile institutions (%)
People in Group quarters - Long-term care (%)
People in Group quarters - Homes for abused, dependent, and neglected children (%)
People in Group quarters - Residential treatment centers for emotionally disturbed children (%)
People in Group quarters - Training schools for juvenile delinquents (%)
People in Group quarters - Short-term care, detention or diagnostic centers for delinquent children (%)
People in Group quarters - Type of juvenile institution unknown (%)
People in Group quarters - Noninstitutionalized population (%)
People in Group quarters - College dormitories (includes college quarters off campus) (%)
People in Group quarters - Military quarters (%)
People in Group quarters - On base (%)
People in Group quarters - Barracks, unaccompanied personnel housing (UPH), (Enlisted/Officer), ;and similar group living quarters for military personnel (%)
People in Group quarters - Transient quarters for temporary residents (%)
People in Group quarters - Military ships (%)
People in Group quarters - Group homes (%)
People in Group quarters - Homes or halfway houses for drug/alcohol abuse (%)
People in Group quarters - Homes for the mentally ill (%)
People in Group quarters - Homes for the mentally retarded (%)
People in Group quarters - Homes for the physically handicapped (%)
People in Group quarters - Other group homes (%)
People in Group quarters - Religious group quarters (%)
People in Group quarters - Dormitories (%)
People in Group quarters - Agriculture workers' dormitories on farms (%)
People in Group quarters - Job Corps and vocational training facilities (%)
People in Group quarters - Other workers' dormitories (%)
People in Group quarters - Crews of maritime vessels (%)
People in Group quarters - Other nonhousehold living situations (%)
People in Group quarters - Other noninstitutional group quarters (%)
Residents speaking English at home (%)
Residents speaking English at home - Born in the United States (%)
Residents speaking English at home - Native, born elsewhere (%)
Residents speaking English at home - Foreign born (%)
Residents speaking Spanish at home (%)
Residents speaking Spanish at home - Born in the United States (%)
Residents speaking Spanish at home - Native, born elsewhere (%)
Residents speaking Spanish at home - Foreign born (%)
Residents speaking other language at home (%)
Residents speaking other language at home - Born in the United States (%)
Residents speaking other language at home - Native, born elsewhere (%)
Residents speaking other language at home - Foreign born (%)
Class of Workers - Employee of private company (%)
Class of Workers - Self-employed in own incorporated business (%)
Class of Workers - Private not-for-profit wage and salary workers (%)
Class of Workers - Local government workers (%)
Class of Workers - State government workers (%)
Class of Workers - Federal government workers (%)
Class of Workers - Self-employed workers in own not incorporated business and Unpaid family workers (%)
House heating fuel used in houses and condos - Utility gas (%)
House heating fuel used in houses and condos - Bottled, tank, or LP gas (%)
House heating fuel used in houses and condos - Electricity (%)
House heating fuel used in houses and condos - Fuel oil, kerosene, etc. (%)
House heating fuel used in houses and condos - Coal or coke (%)
House heating fuel used in houses and condos - Wood (%)
House heating fuel used in houses and condos - Solar energy (%)
House heating fuel used in houses and condos - Other fuel (%)
House heating fuel used in houses and condos - No fuel used (%)
House heating fuel used in apartments - Utility gas (%)
House heating fuel used in apartments - Bottled, tank, or LP gas (%)
House heating fuel used in apartments - Electricity (%)
House heating fuel used in apartments - Fuel oil, kerosene, etc. (%)
House heating fuel used in apartments - Coal or coke (%)
House heating fuel used in apartments - Wood (%)
House heating fuel used in apartments - Solar energy (%)
House heating fuel used in apartments - Other fuel (%)
House heating fuel used in apartments - No fuel used (%)
Armed forces status - In Armed Forces (%)
Armed forces status - Civilian (%)
Armed forces status - Civilian - Veteran (%)
Armed forces status - Civilian - Nonveteran (%)
Fatal accidents locations in years 2005-2021
Fatal accidents locations in 2005
Fatal accidents locations in 2006
Fatal accidents locations in 2007
Fatal accidents locations in 2008
Fatal accidents locations in 2009
Fatal accidents locations in 2010
Fatal accidents locations in 2011
Fatal accidents locations in 2012
Fatal accidents locations in 2013
Fatal accidents locations in 2014
Fatal accidents locations in 2015
Fatal accidents locations in 2016
Fatal accidents locations in 2017
Fatal accidents locations in 2018
Fatal accidents locations in 2019
Fatal accidents locations in 2020
Fatal accidents locations in 2021
Alcohol use - People drinking some alcohol every month (%)
Alcohol use - People not drinking at all (%)
Alcohol use - Average days/month drinking alcohol
Alcohol use - Average drinks/week
Alcohol use - Average days/year people drink much
Audiometry - Average condition of hearing (%)
Audiometry - People that can hear a whisper from across a quiet room (%)
Audiometry - People that can hear normal voice from across a quiet room (%)
Audiometry - Ears ringing, roaring, buzzing (%)
Audiometry - Had a job exposure to loud noise (%)
Audiometry - Had off-work exposure to loud noise (%)
Blood Pressure & Cholesterol - Has high blood pressure (%)
Blood Pressure & Cholesterol - Checking blood pressure at home (%)
Blood Pressure & Cholesterol - Frequently checking blood cholesterol (%)
Blood Pressure & Cholesterol - Has high cholesterol level (%)
Consumer Behavior - Money monthly spent on food at supermarket/grocery store
Consumer Behavior - Money monthly spent on food at other stores
Consumer Behavior - Money monthly spent on eating out
Consumer Behavior - Money monthly spent on carryout/delivered foods
Consumer Behavior - Income spent on food at supermarket/grocery store (%)
Consumer Behavior - Income spent on food at other stores (%)
Consumer Behavior - Income spent on eating out (%)
Consumer Behavior - Income spent on carryout/delivered foods (%)
Current Health Status - General health condition (%)
Current Health Status - Blood donors (%)
Current Health Status - Has blood ever tested for HIV virus (%)
Current Health Status - Left-handed people (%)
Dermatology - People using sunscreen (%)
Diabetes - Diabetics (%)
Diabetes - Had a blood test for high blood sugar (%)
Diabetes - People taking insulin (%)
Diet Behavior & Nutrition - Diet health (%)
Diet Behavior & Nutrition - Milk product consumption (# of products/month)
Diet Behavior & Nutrition - Meals not home prepared (#/week)
Diet Behavior & Nutrition - Meals from fast food or pizza place (#/week)
Diet Behavior & Nutrition - Ready-to-eat foods (#/month)
Diet Behavior & Nutrition - Frozen meals/pizza (#/month)
Drug Use - People that ever used marijuana or hashish (%)
Drug Use - Ever used hard drugs (%)
Drug Use - Ever used any form of cocaine (%)
Drug Use - Ever used heroin (%)
Drug Use - Ever used methamphetamine (%)
Health Insurance - People covered by health insurance (%)
Kidney Conditions-Urology - Avg. # of times urinating at night
Medical Conditions - People with asthma (%)
Medical Conditions - People with anemia (%)
Medical Conditions - People with psoriasis (%)
Medical Conditions - People with overweight (%)
Medical Conditions - Elderly people having difficulties in thinking or remembering (%)
Medical Conditions - People who ever received blood transfusion (%)
Medical Conditions - People having trouble seeing even with glass/contacts (%)
Medical Conditions - People with arthritis (%)
Medical Conditions - People with gout (%)
Medical Conditions - People with congestive heart failure (%)
Medical Conditions - People with coronary heart disease (%)
Medical Conditions - People with angina pectoris (%)
Medical Conditions - People who ever had heart attack (%)
Medical Conditions - People who ever had stroke (%)
Medical Conditions - People with emphysema (%)
Medical Conditions - People with thyroid problem (%)
Medical Conditions - People with chronic bronchitis (%)
Medical Conditions - People with any liver condition (%)
Medical Conditions - People who ever had cancer or malignancy (%)
Mental Health - People who have little interest in doing things (%)
Mental Health - People feeling down, depressed, or hopeless (%)
Mental Health - People who have trouble sleeping or sleeping too much (%)
Mental Health - People feeling tired or having little energy (%)
Mental Health - People with poor appetite or overeating (%)
Mental Health - People feeling bad about themself (%)
Mental Health - People who have trouble concentrating on things (%)
Mental Health - People moving or speaking slowly or too fast (%)
Mental Health - People having thoughts they would be better off dead (%)
Oral Health - Average years since last visit a dentist
Oral Health - People embarrassed because of mouth (%)
Oral Health - People with gum disease (%)
Oral Health - General health of teeth and gums (%)
Oral Health - Average days a week using dental floss/device
Oral Health - Average days a week using mouthwash for dental problem
Oral Health - Average number of teeth
Pesticide Use - Households using pesticides to control insects (%)
Pesticide Use - Households using pesticides to kill weeds (%)
Physical Activity - People doing vigorous-intensity work activities (%)
Physical Activity - People doing moderate-intensity work activities (%)
Physical Activity - People walking or bicycling (%)
Physical Activity - People doing vigorous-intensity recreational activities (%)
Physical Activity - People doing moderate-intensity recreational activities (%)
Physical Activity - Average hours a day doing sedentary activities
Physical Activity - Average hours a day watching TV or videos
Physical Activity - Average hours a day using computer
Physical Functioning - People having limitations keeping them from working (%)
Physical Functioning - People limited in amount of work they can do (%)
Physical Functioning - People that need special equipment to walk (%)
Physical Functioning - People experiencing confusion/memory problems (%)
Physical Functioning - People requiring special healthcare equipment (%)
Prescription Medications - Average number of prescription medicines taking
Preventive Aspirin Use - Adults 40+ taking low-dose aspirin (%)
Reproductive Health - Vaginal deliveries (%)
Reproductive Health - Cesarean deliveries (%)
Reproductive Health - Deliveries resulted in a live birth (%)
Reproductive Health - Pregnancies resulted in a delivery (%)
Reproductive Health - Women breastfeeding newborns (%)
Reproductive Health - Women that had a hysterectomy (%)
Reproductive Health - Women that had both ovaries removed (%)
Reproductive Health - Women that have ever taken birth control pills (%)
Reproductive Health - Women taking birth control pills (%)
Reproductive Health - Women that have ever used Depo-Provera or injectables (%)
Reproductive Health - Women that have ever used female hormones (%)
Sexual Behavior - People 18+ that ever had sex (vaginal, anal, or oral) (%)
Sexual Behavior - Males 18+ that ever had vaginal sex with a woman (%)
Sexual Behavior - Males 18+ that ever performed oral sex on a woman (%)
Sexual Behavior - Males 18+ that ever had anal sex with a woman (%)
Sexual Behavior - Males 18+ that ever had any sex with a man (%)
Sexual Behavior - Females 18+ that ever had vaginal sex with a man (%)
Sexual Behavior - Females 18+ that ever performed oral sex on a man (%)
Sexual Behavior - Females 18+ that ever had anal sex with a man (%)
Sexual Behavior - Females 18+ that ever had any kind of sex with a woman (%)
Sexual Behavior - Average age people first had sex
Sexual Behavior - Average number of female sex partners in lifetime (males 18+)
Sexual Behavior - Average number of female vaginal sex partners in lifetime (males 18+)
Sexual Behavior - Average age people first performed oral sex on a woman (18+)
Sexual Behavior - Average number of woman performed oral sex on in lifetime (18+)
Sexual Behavior - Average number of male sex partners in lifetime (males 18+)
Sexual Behavior - Average number of male anal sex partners in lifetime (males 18+)
Sexual Behavior - Average age people first performed oral sex on a man (18+)
Sexual Behavior - Average number of male oral sex partners in lifetime (18+)
Sexual Behavior - People using protection when performing oral sex (%)
Sexual Behavior - Average number of times people have vaginal or anal sex a year
Sexual Behavior - People having sex without condom (%)
Sexual Behavior - Average number of male sex partners in lifetime (females 18+)
Sexual Behavior - Average number of male vaginal sex partners in lifetime (females 18+)
Sexual Behavior - Average number of female sex partners in lifetime (females 18+)
Sexual Behavior - Circumcised males 18+ (%)
Sleep Disorders - Average hours sleeping at night
Sleep Disorders - People that has trouble sleeping (%)
Smoking-Cigarette Use - People smoking cigarettes (%)
Taste & Smell - People 40+ having problems with smell (%)
Taste & Smell - People 40+ having problems with taste (%)
Taste & Smell - People 40+ that ever had wisdom teeth removed (%)
Taste & Smell - People 40+ that ever had tonsils teeth removed (%)
Taste & Smell - People 40+ that ever had a loss of consciousness because of a head injury (%)
Taste & Smell - People 40+ that ever had a broken nose or other serious injury to face or skull (%)
Taste & Smell - People 40+ that ever had two or more sinus infections (%)
Weight - Average height (inches)
Weight - Average weight (pounds)
Weight - Average BMI
Weight - People that are obese (%)
Weight - People that ever were obese (%)
Weight - People trying to lose weight (%)
100%
urban population.
Estimated median house/condo value in 2022: $254,733
08107:
$254,733New Jersey:
$428,900
Median resident age: This zip code:
39.0 yearsNew Jersey median age:
40.4 years
Average household size: This zip code:
2.3 peopleNew Jersey:
2.6 people
Averages for the 2020 tax year for zip code 08107, filed in 2021:
Average Adjusted Gross Income (AGI) in 2020: $58,370 (Individual Income Tax Returns) Here:
$58,370State:
$95,247
Salary/wage: $52,759 (reported on 86.6% of returns )Here:
$52,759State:
$80,635
(% of AGI for various income ranges: 1162.9% for AGIs below $25k , 3795.4% for AGIs $25k-50k , 6759.6% for AGIs $50k-75k , 10204.9% for AGIs $75k-100k , 18479.6% for AGIs $100k-200k , 56575.7% for AGIs over 200k ) Taxable interest for individuals: $682 (reported on 22.8% of returns )This zip code:
$682New Jersey:
$2,414
(% of AGI for various income ranges: 7.1% for AGIs below $25k , 7.4% for AGIs $25k-50k , 19.1% for AGIs $50k-75k , 41.5% for AGIs $75k-100k , 66.4% for AGIs $100k-200k , 217.1% for AGIs over 200k ) Ordinary dividends: $3,195 (reported on 14.4% of returns )(% of AGI for various income ranges: 13.1% for AGIs below $25k , 14.6% for AGIs $25k-50k , 59.9% for AGIs $50k-75k , 90.0% for AGIs $75k-100k , 197.0% for AGIs $100k-200k , 1121.4% for AGIs over 200k ) Net capital gain/loss in AGI: +$7,826 (reported on 12.0% of returns )Here:
+$7,826State:
+$25,022
(% of AGI for various income ranges: 4.7% for AGIs below $25k , 7.2% for AGIs $25k-50k , 57.0% for AGIs $50k-75k , 176.4% for AGIs $75k-100k , 272.9% for AGIs $100k-200k , 5101.4% for AGIs over 200k ) Profit/loss from business: +$13,720 (reported on 13.8% of returns )Here:
+$13,720State:
+$18,035
(% of AGI for various income ranges: 117.8% for AGIs below $25k , 124.4% for AGIs $25k-50k , 161.4% for AGIs $50k-75k , 462.6% for AGIs $75k-100k , 569.8% for AGIs $100k-200k , 4224.3% for AGIs over 200k ) Taxable individual retirement arrangement distribution: $15,144 (reported on 6.0% of returns )08107:
$15,144New Jersey:
$21,558
(% of AGI for various income ranges: 34.3% for AGIs below $25k , 64.0% for AGIs $25k-50k , 112.9% for AGIs $50k-75k , 214.6% for AGIs $75k-100k , 378.0% for AGIs $100k-200k , 1248.6% for AGIs over 200k ) Total itemized deductions: $23,664 (reported on 9.4% of returns )Here:
$23,664State:
$32,863
(% of AGI for various income ranges: 55.7% for AGIs below $25k , 170.6% for AGIs $25k-50k , 442.5% for AGIs $50k-75k , 606.7% for AGIs $75k-100k , 713.9% for AGIs $100k-200k , 2660.0% for AGIs over 200k ) Charity contributions: $4,527 (reported on 7.0% of returns )(% of AGI for various income ranges: 4.4% for AGIs below $25k , 11.9% for AGIs $25k-50k , 46.1% for AGIs $50k-75k , 53.8% for AGIs $75k-100k , 150.9% for AGIs $100k-200k , 724.3% for AGIs over 200k ) Taxes paid: $10,052 (reported on 9.3% of returns )08107:
$10,052State:
$9,183
(% of AGI for various income ranges: 19.3% for AGIs below $25k , 88.1% for AGIs $25k-50k , 185.7% for AGIs $50k-75k , 294.9% for AGIs $75k-100k , 277.0% for AGIs $100k-200k , 774.3% for AGIs over 200k ) Earned income credit: $2,143 (reported on 16.9% of returns )(% of AGI for various income ranges: 96.4% for AGIs below $25k , 66.2% for AGIs $25k-50k ) Percentage of individuals using paid preparers for their 2020 taxes: 92.4%(% for various income ranges: 90.3% for AGIs below $25k , 92.4% for AGIs $25k-50k , 93.5% for AGIs $50k-75k , 93.2% for AGIs $75k-100k , 94.6% for AGIs $100k-200k , 94.7% for AGIs over 200k )
Averages for the 2012 tax year for zip code 08107, filed in 2013:
Average Adjusted Gross Income (AGI) in 2012: $46,841 (Individual Income Tax Returns) Here:
$46,841State:
$79,688
Salary/wage: $43,685 (reported on 87.2% of returns )Here:
$43,685State:
$68,122
(% of AGI for various income ranges: 75.3% for AGIs below $25k , 84.9% for AGIs $25k-50k , 79.6% for AGIs $50k-75k , 83.3% for AGIs $75k-100k , 84.6% for AGIs $100k-200k , 64.7% for AGIs over 200k ) Taxable interest for individuals: $777 (reported on 26.0% of returns )This zip code:
$777New Jersey:
$2,193
(% of AGI for various income ranges: 0.9% for AGIs below $25k , 0.4% for AGIs $25k-50k , 0.4% for AGIs $50k-75k , 0.3% for AGIs $75k-100k , 0.4% for AGIs $100k-200k , 0.4% for AGIs over 200k ) Ordinary dividends: $2,268 (reported on 15.4% of returns )(% of AGI for various income ranges: 1.1% for AGIs below $25k , 0.5% for AGIs $25k-50k , 0.8% for AGIs $50k-75k , 0.7% for AGIs $75k-100k , 0.7% for AGIs $100k-200k , 1.2% for AGIs over 200k ) Net capital gain/loss in AGI: +$2,861 (reported on 9.9% of returns )Here:
+$2,861State:
+$15,358
(% of AGI for various income ranges: 0.2% for AGIs $25k-50k , 0.3% for AGIs $50k-75k , 0.2% for AGIs $75k-100k , 0.8% for AGIs $100k-200k , 4.7% for AGIs over 200k ) Profit/loss from business: +$12,926 (reported on 10.7% of returns )Here:
+$12,926State:
+$19,577
(% of AGI for various income ranges: 5.9% for AGIs below $25k , 2.3% for AGIs $25k-50k , 2.0% for AGIs $50k-75k , 2.1% for AGIs $75k-100k , 2.2% for AGIs $100k-200k , 9.2% for AGIs over 200k ) Taxable individual retirement arrangement distribution: $11,400 (reported on 7.4% of returns )08107:
$11,400New Jersey:
$18,214
(% of AGI for various income ranges: 2.4% for AGIs below $25k , 1.1% for AGIs $25k-50k , 2.2% for AGIs $50k-75k , 1.9% for AGIs $75k-100k , 2.3% for AGIs $100k-200k ) Total itemized deductions: $18,775 (24% of AGI, reported on 37.8% of returns )Here:
$18,775State:
$30,827
Here:
24.4% of AGIState:
21.2% of AGI
(% of AGI for various income ranges: 9.3% for AGIs below $25k , 14.0% for AGIs $25k-50k , 16.0% for AGIs $50k-75k , 16.8% for AGIs $75k-100k , 16.6% for AGIs $100k-200k , 16.0% for AGIs over 200k ) Charity contributions: $2,145 (reported on 31.0% of returns )(% of AGI for various income ranges: 0.7% for AGIs below $25k , 1.1% for AGIs $25k-50k , 1.5% for AGIs $50k-75k , 1.5% for AGIs $75k-100k , 1.7% for AGIs $100k-200k , 2.3% for AGIs over 200k ) Taxes paid: $8,298 (reported on 37.7% of returns )08107:
$8,298State:
$15,801
(% of AGI for various income ranges: 3.6% for AGIs below $25k , 4.3% for AGIs $25k-50k , 7.1% for AGIs $50k-75k , 7.7% for AGIs $75k-100k , 8.5% for AGIs $100k-200k , 8.7% for AGIs over 200k ) Earned income credit: $2,157 (reported on 17.1% of returns )(% of AGI for various income ranges: 5.8% for AGIs below $25k , 0.9% for AGIs $25k-50k ) Percentage of individuals using paid preparers for their 2012 taxes: 56.1%(% for various income ranges: 50.0% for AGIs below $25k , 59.2% for AGIs $25k-50k , 57.6% for AGIs $50k-75k , 60.7% for AGIs $75k-100k , 61.9% for AGIs $100k-200k , 71.4% for AGIs over 200k )
Averages for the 2004 tax year for zip code 08107, filed in 2005:
Average Adjusted Gross Income (AGI) in 2004: $41,091 (Individual Income Tax Returns) Here:
$41,091State:
$64,921
Salary/wage: $39,345 (reported on 87.5% of returns )Here:
$39,345State:
$57,755
(% of AGI for various income ranges: 88.5% for AGIs below $10k , 75.9% for AGIs $10k-25k , 87.6% for AGIs $25k-50k , 87.4% for AGIs $50k-75k , 89.7% for AGIs $75k-100k , 74.6% for AGIs over 100k ) Taxable interest for individuals: $1,235 (reported on 39.8% of returns )This zip code:
$1,235New Jersey:
$2,068
(% of AGI for various income ranges: 3.3% for AGIs below $10k , 2.4% for AGIs $10k-25k , 1.0% for AGIs $25k-50k , 1.2% for AGIs $50k-75k , 0.8% for AGIs $75k-100k , 1.1% for AGIs over 100k ) Taxable dividends: $1,920 (reported on 20.7% of returns )(% of AGI for various income ranges: 2.6% for AGIs below $10k , 1.5% for AGIs $10k-25k , 0.8% for AGIs $25k-50k , 0.9% for AGIs $50k-75k , 0.7% for AGIs $75k-100k , 1.1% for AGIs over 100k ) Net capital gain/loss: +$3,076 (reported on 13.9% of returns )Here:
+$3,076State:
+$13,591
(% of AGI for various income ranges: -0.5% for AGIs below $10k , -0.2% for AGIs $10k-25k , -0.1% for AGIs $25k-50k , 0.5% for AGIs $50k-75k , 0.6% for AGIs $75k-100k , 3.9% for AGIs over 100k ) Profit/loss from business: +$9,752 (reported on 10.1% of returns )Here:
+$9,752State:
+$17,520
(% of AGI for various income ranges: 3.5% for AGIs below $10k , 4.5% for AGIs $10k-25k , 2.2% for AGIs $25k-50k , 1.6% for AGIs $50k-75k , 1.8% for AGIs $75k-100k , 2.8% for AGIs over 100k ) IRA payment deduction: $2,768 (reported on 2.4% of returns )08107:
$2,768New Jersey:
$3,270
(% of AGI for various income ranges: 0.2% for AGIs $10k-25k , 0.2% for AGIs $25k-50k , 0.2% for AGIs $50k-75k , 0.1% for AGIs $75k-100k , 0.1% for AGIs over 100k ) Self-employed pension: $8,781 (reported on 0.5% of returns )Here:
$8,781New Jersey:
$17,258
Total itemized deductions: $15,685 (23% of AGI, reported on 36.7% of returns )Here:
$15,685State:
$23,924
Here:
22.9% of AGIState:
21.1% of AGI
(% of AGI for various income ranges: 10.2% for AGIs below $10k , 10.3% for AGIs $10k-25k , 12.0% for AGIs $25k-50k , 15.5% for AGIs $50k-75k , 16.4% for AGIs $75k-100k , 15.1% for AGIs over 100k ) Charity contributions deductions: $2,153 (3% of AGI, reported on 32.7% of returns )Here:
3.0% of AGIState:
2.7% of AGI
(% of AGI for various income ranges: 0.5% for AGIs below $10k , 1.0% for AGIs $10k-25k , 1.3% for AGIs $25k-50k , 2.0% for AGIs $50k-75k , 2.1% for AGIs $75k-100k , 2.1% for AGIs over 100k ) Total tax: $5,402 (reported on 76.3% of returns )08107:
$5,402State:
$12,321
(% of AGI for various income ranges: 2.4% for AGIs below $10k , 4.2% for AGIs $10k-25k , 7.5% for AGIs $25k-50k , 9.6% for AGIs $50k-75k , 10.5% for AGIs $75k-100k , 16.2% for AGIs over 100k ) Earned income credit: $1,671 (reported on 15.0% of returns )Percentage of individuals using paid preparers for their 2004 taxes: 54.3%(% for various income ranges: 45.5% for AGIs below $10k , 56.6% for AGIs $10k-25k , 53.6% for AGIs $25k-50k , 55.2% for AGIs $50k-75k , 63.5% for AGIs $75k-100k , 59.4% for AGIs over 100k )
Estimated median household income in 2022: This zip code:
$68,076New Jersey:
$96,346
Nearest zip codes: 08106 ,
08108 ,
08059 ,
08104 ,
08035 ,
08030 .
Woodlynne Zip Code Map
Percentage of family households: This zip code:
40.4%New Jersey:
47.0%
Percentage of households with unmarried partners: This zip code:
7.6%New Jersey:
49.9%
No gay or lesbian households reported
Household received Food Stamps/SNAP in the past 12 months: 776Household did not receive Food Stamps/SNAP in the past 12 months: 5,121
Women who had a birth in the past 12 months: 109 (83 now married , 26 unmarried) Women who did not have a birth in the past 12 months: 3,195 (1,010 now married , 2,192 unmarried)
Housing units in zip code 08107 with a mortgage: 2,052 (255
second mortgage , 1
home equity loan , 234
both second mortgage and home equity loan )
Houses without a mortgage: 39
Median monthly owner costs for units with a mortgage: $1,967
Median monthly owner costs for units without a mortgage: $1,023
Residents with income below the poverty level in 2022:
This zip code:
11.7%Whole state:
9.7%
Residents with income below 50% of the poverty level in 2022:
This zip code:
7.9%Whole state:
5.2%
Median number of rooms in houses and condos: Median number of rooms in apartments:
Year house built (houses)
0 2020 or later43 2010 to 201944 2000 to 200987 1990 to 1999192 1980 to 1989566 1970 to 1979732 1960 to 19691,107 1950 to 1959897 1940 to 19492,395 1939 or earlier
Zip code 08107 household income distribution in 2022 328 Less than $10,000208 $10,000 to $14,999198 $15,000 to $19,999320 $20,000 to $24,999364 $25,000 to $29,999180 $30,000 to $34,999201 $35,000 to $39,999186 $40,000 to $44,999120 $45,000 to $49,999468 $50,000 to $59,999529 $60,000 to $74,999762 $75,000 to $99,999395 $100,000 to $124,999603 $125,000 to $149,999526 $150,000 to $199,999458 $200,000 or moreEstimate of home value of owner-occupied houses/condos in 2022 in zip code 08107 33 Less than $10,0004 $15,000 to $19,9998 $20,000 to $24,9998 $35,000 to $39,9998 $40,000 to $49,99933 $50,000 to $59,9998 $60,000 to $69,99923 $70,000 to $79,99983 $80,000 to $89,99957 $90,000 to $99,99999 $100,000 to $124,999121 $125,000 to $149,999175 $150,000 to $174,999152 $175,000 to $199,999575 $200,000 to $249,999563 $250,000 to $299,999393 $300,000 to $399,999175 $400,000 to $499,999180 $500,000 to $749,999Rent paid by renters in 2022 in zip code 08107 5 $300 to $34972 $400 to $44917 $450 to $49912 $500 to $5498 $550 to $59925 $600 to $64932 $650 to $69954 $750 to $799355 $800 to $899425 $900 to $999779 $1,000 to $1,249348 $1,250 to $1,499587 $1,500 to $1,99926 $2,500 to $2,99941 No cash rent
Median gross rent in 2022: $1,192.
Median price asked for vacant for-sale houses and condos in 2022: $1,168,559.
Estimated median house (or condo) value in 2022 for: White Non-Hispanic householders: $259,579Black or African American householders: $157,525Asian householders: $194,684Some other race householders: $171,258Two or more races householders: $156,447Hispanic or Latino householders: $158,602Estimated median house or condo value in 2022: $254,733
08107:
$254,733New Jersey:
$428,900
Lower value quartile - upper value quartile: $189,736 - $312,249
Mean price in 2022: Detached houses: $333,075Here:
$333,075State:
$537,591
Townhouses or other attached units: $186,015Here:
$186,015State:
$381,113
In 2-unit structures: $226,244Here:
$226,244State:
$444,476
In 3-to-4-unit structures: $276,796Here:
$276,796State:
$457,463
In 5-or-more-unit structures: $162,522Here:
$162,522State:
$368,745
Mobile homes: $66,350Here:
$66,350State:
$119,788
Housing units in structures:
One, detached: 2,827One, attached: 764Two: 3893 or 4: 2595 to 9: 20910 to 19: 19720 to 49: 27250 or more: 1,363Unemployment : 6.8%
Means of transportation to work in zip code 08107 62.4% 4,530 Drove a car alone14.2% 1,035 Carpooled3.2% 234 Bus or trolley bus2.5% 185 Streetcar or trolley car0.4% 31 Subway or elevated1.2% 90 Railroad0.1% 6 Taxi0.5% 37 Bicycle1.0% 75 Walked0.6% 40 Other means13.5% 979 Worked at homeTravel time to work (commute) in zip code 08107 85 Less than 5 minutes357 5 to 9 minutes756 10 to 14 minutes853 15 to 19 minutes946 20 to 24 minutes688 25 to 29 minutes829 30 to 34 minutes376 35 to 39 minutes317 40 to 44 minutes571 45 to 59 minutes366 60 to 89 minutes78 90 or more minutes
Percentage of zip code residents living and working in this county: 52.1%
Household type by relationship:
Households: 13,586
Male householders: 2,623 (990 living alone ), Female householders: 3,257 (963 living alone )1,947 spouses (1,908 opposite-sex spouses ), 681 unmarried partners , (613 opposite-sex unmarried partners ), 3,580 children (3,412 natural , 46 adopted , 119 stepchildren ), 570 grandchildren , 167 brothers or sisters , 122 parents , 7 foster children , 312 other relatives , 383 non-relatives In group quarters: 5 (-1 institutionalized population )
Size of family households: 1,380 2-persons , 850 3-persons , 580 4-persons , 237 5-persons , 89 6-persons , 80 7-or-more-persons
Size of nonfamily households: 1,955 1-person , 680 2-persons , 25 3-persons , 25 4-persons
1,175 married couples with children. single-parent households (376 men , 570 women ).
79.3% of residents of 08107 zip code speak English at home. of residents speak Spanish at home (53% very well, 13% well, 26% not well, 8% not at all ).of residents speak other Indo-European language at home (63% very well, 5% well, 31% not well ).of residents speak Asian or Pacific Island language at home (48% very well, 18% well, 28% not well, 6% not at all ).of residents speak other language at home (9% very well, 53% well, 38% not well ).
Foreign born population: 1,209 (8.9%)
(51.5%
of them are naturalized citizens )
This zip code:
8.9%Whole state:
23.5%
21% Honduras 20% Dominica 12% Eritrea 8% Thailand 5% Mexico 4% St. Vincent and the Grenadines 4% Bhutan 13% Irish 9% Italian 6% German 4% Ethiopian 3% Polish 3% English 2% Greek
Year of entry for the foreign-born population
485 2010 or later 243 2000 to 2009 354 1990 to 1999 541 Before 1990
Facilities with environmental interests located in this zip code:
OAKLYN BORO WASTEWATER COLL SYSTEM (500 WHITEHORSE PK in OAKLYN BORO, NJ)
STATE MASTER (New Jersey environmental info) - NJEMS-160410, WASTEWATER FACILITY, NJEMS-206137, REFUSE DISPOSAL, NJEMS-207223, National Pollutant Discharge Elimination System Permit National Pollutant Discharge Elimination System NON-MAJOR (Tracking pollutant discharge elimination systems) - permit
AMERICAN ASPHALT CO (116 MAIN ST in WEST COLLINGSWOOD, NJ)
AIR SYNTHETIC MINOR (AIRS/AFS) STATE MASTER (New Jersey environmental info) - NJEMS-64414000000, EPCRA, NJEMS-G000014969, STATE CLEANUP SITE, NJEMS-201958, REFUSE DISPOSAL, NJEMS-47608, National Pollutant Discharge Elimination System Permit, NJEMS-50094, AIR PROGRAM National Pollutant Discharge Elimination System NON-MAJOR (Tracking pollutant discharge elimination systems) - permit Business SIC classification: ASPHALT PAVING MIXTURES AND BLOCKS; ASPHALT FELTS AND COATINGSOrganizations: AMERICAN ASPHALT CO INC, AMERICAN ASPHALT CO. INC. (CONTACT/OWNER)
OAKLYN ELEM (KENDALL BLVD in OAKLYN, NJ)
(National Center for Education Statistics) - STATE ID-060 Organizations: OAKLYN BORO (SCHOOL DISTRICT)
OAKLYN JUNIOR (KENDALL BLVD in OAKLYN, NJ)
(National Center for Education Statistics) - STATE ID-050 Organizations: OAKLYN BORO (SCHOOL DISTRICT)
NJDOT RT 30/130 COLLINSWOOD CL (604 A WHITE HORSE PIKE in OAKLAND, NJ)
National Pollutant Discharge Elimination System NON-MAJOR (Tracking pollutant discharge elimination systems) - permit Organizations: JPC GROUP INC (CONTACT/OWNER)
NJDEP - JOHNNY DS TEXACO (W COLLINGSWOOD AVE & RTE 30 in OAKLYN, NJ)
(Resource Conservation and Recovery Act (tracking hazardous waste))
OAKLYN BOARD OF ED (KENDALL BOULEVARD in OAKLYN, NJ)
COMPLIANCE ACTIVITY (Tracking inspections of insecticide, fungicide, and rodenticide, and toxic substances)
Housing units lacking complete plumbing facilities: 0.6%
Housing units lacking complete kitchen facilities: 2.1%
72.9% Utility gas 17.8% Electricity 7.3% Fuel oil, kerosene, etc. 1.3% No fuel used
Population in 1990: 14,161.
Place of birth for U.S.-born residents:
This state: 8,197Northeast: 2,854Midwest: 149South: 587West: 137
64% of the 08107 zip code residents lived in the same house 5 years ago.
Out of people who lived in different houses, 69% lived in this county.
Out of people who lived in different counties, 50% lived in New Jersey.
87% of the 08107 zip code residents lived in the same house 1 year ago.
Out of people who lived in different houses, 52% moved from this county.
Out of people who lived in different houses, 9% moved from different county within same state.
Out of people who lived in different houses, 36% moved from different state.
Out of people who lived in different houses, 3% moved from abroad.
Private vs. public school enrollment:
Students in private schools in grades 1 to 8 (elementary and middle school): 138
Here:
11.4%New Jersey:
12.3%
Students in private schools in grades 9 to 12 (high school): 9
Here:
2.1%New Jersey:
13.1%
Students in private undergraduate colleges: 137
Here:
21.9%New Jersey:
33.2%
Occupation by median earnings in the past 12 months ($)
109,503 Computer and mathematical occupations 93,542 Architecture and engineering occupations 88,631 Health diagnosing and treating practitioners and other technical occupations 83,418 Life, physical, and social science occupations 82,472 Business and financial operations occupations 80,750 Construction and extraction occupations
Companies with federal contracts located in this zip code:
KERFOOT, LLC (207 W CLINTON AVE in OAKLYN, NJ; small business)
$10,499 with Army for Installation of Equipment -- Alarm, Signal, and Security Detection Systems. Signed on 2003-09-08. Completion date: 2003-09-30.
Top industries in this zip code by the number of employees in 2005:
Construction: Plumbing, Heating, and Air-Conditioning Contractors (20-49 employees: 2 establishments, 1-4 employees: 3 establishments)Construction: Electrical Contractors (10-19: 4, 5-9: 1, 1-4: 1)Accommodation and Food Services: Full-Service Restaurants (10-19: 3, 5-9: 1, 1-4: 1)Health Care and Social Assistance: Child Day Care Services (20-49: 1, 10-19: 1, 1-4: 1)Other Services (except Public Administration): Religious Organizations (10-19: 1, 5-9: 1, 1-4: 10)Accommodation and Food Services: Limited-Service Restaurants (10-19: 1, 5-9: 2, 1-4: 6)Health Care and Social Assistance: Offices of Physicians (except Mental Health Specialists) (10-19: 1, 5-9: 2, 1-4: 3)Professional, Scientific, and Technical Services: Engineering Services (20-49: 1, 1-4: 1)
People in group quarters in 2000:
2 people in other nonhousehold living situations
Fatal accident statistics in 2014:
Fatal accident count: 1Vehicles involved in fatal accidents: 3Fatal accidents caused by drunken drivers: 0Fatalities: 1Persons involved in fatal accidents: 1Pedestrians involved in fatal accidents: 0
Fatal accident statistics in 2013:
Fatal accident count: 1Vehicles involved in fatal accidents: 1Fatal accidents caused by drunken drivers: 0Fatalities: 1Persons involved in fatal accidents: 1Pedestrians involved in fatal accidents: 1
Home Mortgage Disclosure Act Aggregated Statistics For Year 2009(Based on 6 full and 8 partial tracts) A) FHA, FSA/RHS & VA B) Conventional C) Refinancings D) Home Improvement Loans E) Loans on Dwellings For 5+ Families F) Non-occupant Loans on Number Average Value Number Average Value Number Average Value Number Average Value Number Average Value Number Average Value
LOANS ORIGINATED 121 $168,611 67 $152,660 401 $157,442 43 $68,131 3 $738,520 38 $116,182 APPLICATIONS APPROVED, NOT ACCEPTED 6 $156,638 11 $134,552 59 $134,031 2 $10,275 0 $0 10 $58,355 APPLICATIONS DENIED 21 $154,665 13 $161,067 172 $152,128 47 $18,684 0 $0 12 $68,138 APPLICATIONS WITHDRAWN 16 $161,737 13 $147,918 108 $147,079 8 $94,522 0 $0 4 $52,788 FILES CLOSED FOR INCOMPLETENESS 8 $188,244 3 $171,350 25 $156,781 0 $0 0 $0 0 $0
Aggregated Statistics For Year 2008(Based on 6 full and 8 partial tracts) A) FHA, FSA/RHS & VA B) Conventional C) Refinancings D) Home Improvement Loans E) Loans on Dwellings For 5+ Families F) Non-occupant Loans on Number Average Value Number Average Value Number Average Value Number Average Value Number Average Value Number Average Value
LOANS ORIGINATED 66 $157,682 119 $162,270 302 $144,089 92 $54,032 3 $252,407 40 $188,514 APPLICATIONS APPROVED, NOT ACCEPTED 7 $162,434 18 $184,845 47 $147,653 15 $37,529 0 $0 6 $103,583 APPLICATIONS DENIED 16 $135,979 34 $173,734 245 $150,702 113 $32,880 0 $0 30 $131,100 APPLICATIONS WITHDRAWN 9 $222,820 12 $207,542 66 $149,237 11 $74,023 0 $0 2 $151,865 FILES CLOSED FOR INCOMPLETENESS 4 $124,175 0 $0 23 $147,617 4 $29,830 0 $0 0 $0
Aggregated Statistics For Year 2007(Based on 6 full and 8 partial tracts) A) FHA, FSA/RHS & VA B) Conventional C) Refinancings D) Home Improvement Loans E) Loans on Dwellings For 5+ Families F) Non-occupant Loans on G) Loans On Manufactured Number Average Value Number Average Value Number Average Value Number Average Value Number Average Value Number Average Value Number Average Value
LOANS ORIGINATED 51 $151,222 233 $147,604 489 $136,144 142 $37,088 2 $3,622,195 91 $126,571 2 $5,530 APPLICATIONS APPROVED, NOT ACCEPTED 6 $120,342 36 $140,276 105 $128,364 58 $48,297 0 $0 14 $126,430 0 $0 APPLICATIONS DENIED 3 $132,063 86 $142,347 363 $137,972 164 $37,064 2 $146,580 60 $123,803 2 $29,830 APPLICATIONS WITHDRAWN 8 $166,620 45 $149,367 171 $157,976 18 $77,318 0 $0 5 $131,242 0 $0 FILES CLOSED FOR INCOMPLETENESS 0 $0 15 $147,611 34 $136,405 2 $87,950 0 $0 8 $132,766 0 $0
Aggregated Statistics For Year 2006(Based on 6 full and 8 partial tracts) A) FHA, FSA/RHS & VA B) Conventional C) Refinancings D) Home Improvement Loans E) Loans on Dwellings For 5+ Families F) Non-occupant Loans on G) Loans On Manufactured Number Average Value Number Average Value Number Average Value Number Average Value Number Average Value Number Average Value Number Average Value
LOANS ORIGINATED 46 $165,448 451 $129,766 649 $124,052 198 $43,406 2 $377,395 155 $110,394 0 $0 APPLICATIONS APPROVED, NOT ACCEPTED 10 $125,938 59 $133,722 131 $129,112 50 $47,477 0 $0 34 $118,968 2 $44,745 APPLICATIONS DENIED 8 $141,158 103 $122,031 343 $134,088 185 $38,890 0 $0 62 $94,807 0 $0 APPLICATIONS WITHDRAWN 11 $167,606 92 $111,243 218 $130,965 38 $75,579 0 $0 33 $108,354 0 $0 FILES CLOSED FOR INCOMPLETENESS 2 $105,540 23 $143,518 58 $161,272 3 $40,380 0 $0 4 $69,138 0 $0
Aggregated Statistics For Year 2005(Based on 6 full and 8 partial tracts) A) FHA, FSA/RHS & VA B) Conventional C) Refinancings D) Home Improvement Loans E) Loans on Dwellings For 5+ Families F) Non-occupant Loans on G) Loans On Manufactured Number Average Value Number Average Value Number Average Value Number Average Value Number Average Value Number Average Value Number Average Value
LOANS ORIGINATED 61 $153,290 543 $116,127 792 $119,258 182 $54,103 9 $509,673 237 $96,162 2 $107,860 APPLICATIONS APPROVED, NOT ACCEPTED 2 $111,400 65 $102,032 136 $105,346 43 $51,532 4 $436,468 21 $96,476 2 $110,425 APPLICATIONS DENIED 12 $132,828 76 $105,582 390 $118,063 166 $50,039 0 $0 60 $89,370 2 $101,420 APPLICATIONS WITHDRAWN 11 $156,473 69 $127,431 346 $117,650 38 $104,884 2 $264,915 31 $95,251 2 $122,150 FILES CLOSED FOR INCOMPLETENESS 2 $140,715 18 $116,254 36 $138,856 1 $109,750 0 $0 4 $70,358 0 $0
Aggregated Statistics For Year 2004(Based on 6 full and 8 partial tracts) A) FHA, FSA/RHS & VA B) Conventional C) Refinancings D) Home Improvement Loans E) Loans on Dwellings For 5+ Families F) Non-occupant Loans on G) Loans On Manufactured Number Average Value Number Average Value Number Average Value Number Average Value Number Average Value Number Average Value Number Average Value
LOANS ORIGINATED 51 $136,195 449 $115,549 678 $105,609 181 $48,927 6 $286,187 174 $91,467 0 $0 APPLICATIONS APPROVED, NOT ACCEPTED 7 $63,486 73 $95,889 141 $97,413 34 $38,299 0 $0 27 $85,660 2 $23,045 APPLICATIONS DENIED 16 $112,210 78 $100,912 354 $97,369 150 $26,726 0 $0 47 $57,350 0 $0 APPLICATIONS WITHDRAWN 2 $106,390 99 $113,587 254 $94,945 17 $37,606 0 $0 35 $93,967 0 $0 FILES CLOSED FOR INCOMPLETENESS 2 $39,090 26 $137,024 29 $111,514 13 $75,412 0 $0 3 $153,080 0 $0
Aggregated Statistics For Year 2003(Based on 6 full and 8 partial tracts) A) FHA, FSA/RHS & VA B) Conventional C) Refinancings D) Home Improvement Loans E) Loans on Dwellings For 5+ Families F) Non-occupant Loans on Number Average Value Number Average Value Number Average Value Number Average Value Number Average Value Number Average Value
LOANS ORIGINATED 90 $111,882 320 $102,648 1,069 $94,621 114 $34,045 6 $284,147 155 $77,687 APPLICATIONS APPROVED, NOT ACCEPTED 14 $100,561 32 $83,444 198 $82,961 33 $23,947 2 $565,095 12 $70,488 APPLICATIONS DENIED 4 $78,705 45 $81,983 410 $84,982 112 $23,373 0 $0 41 $47,798 APPLICATIONS WITHDRAWN 18 $95,646 53 $94,523 280 $97,213 15 $53,799 2 $489,215 17 $71,356 FILES CLOSED FOR INCOMPLETENESS 8 $105,292 6 $131,485 36 $97,099 13 $56,648 0 $0 7 $72,111
Aggregated Statistics For Year 2002(Based on 6 full and 6 partial tracts) A) FHA, FSA/RHS & VA B) Conventional C) Refinancings D) Home Improvement Loans E) Loans on Dwellings For 5+ Families F) Non-occupant Loans on Number Average Value Number Average Value Number Average Value Number Average Value Number Average Value Number Average Value
LOANS ORIGINATED 110 $94,608 238 $108,519 541 $85,481 83 $24,267 6 $754,720 94 $81,024 APPLICATIONS APPROVED, NOT ACCEPTED 3 $95,047 34 $81,505 116 $76,141 34 $21,164 0 $0 14 $46,775 APPLICATIONS DENIED 11 $91,465 51 $71,846 331 $70,964 126 $19,160 4 $274,150 31 $50,692 APPLICATIONS WITHDRAWN 13 $80,838 44 $104,605 215 $82,623 17 $76,856 0 $0 26 $53,765 FILES CLOSED FOR INCOMPLETENESS 9 $102,931 6 $142,580 28 $79,631 4 $32,015 0 $0 2 $53,745
Aggregated Statistics For Year 2001(Based on 6 full and 6 partial tracts) A) FHA, FSA/RHS & VA B) Conventional C) Refinancings D) Home Improvement Loans E) Loans on Dwellings For 5+ Families F) Non-occupant Loans on Number Average Value Number Average Value Number Average Value Number Average Value Number Average Value Number Average Value
LOANS ORIGINATED 153 $84,350 170 $84,635 340 $76,734 78 $26,078 2 $168,035 49 $64,577 APPLICATIONS APPROVED, NOT ACCEPTED 8 $87,382 21 $77,561 95 $63,673 40 $20,438 2 $251,560 6 $54,072 APPLICATIONS DENIED 7 $72,474 33 $68,702 246 $52,281 124 $16,176 0 $0 23 $49,493 APPLICATIONS WITHDRAWN 11 $66,447 20 $68,854 174 $69,571 27 $21,958 0 $0 26 $51,961 FILES CLOSED FOR INCOMPLETENESS 4 $85,198 2 $79,545 33 $83,202 6 $26,870 0 $0 0 $0
Aggregated Statistics For Year 2000(Based on 6 full and 6 partial tracts) A) FHA, FSA/RHS & VA B) Conventional C) Refinancings D) Home Improvement Loans E) Loans on Dwellings For 5+ Families F) Non-occupant Loans on Number Average Value Number Average Value Number Average Value Number Average Value Number Average Value Number Average Value
LOANS ORIGINATED 151 $77,751 177 $75,540 132 $53,870 84 $21,223 6 $584,362 37 $47,680 APPLICATIONS APPROVED, NOT ACCEPTED 7 $65,814 9 $70,099 70 $62,635 25 $13,858 0 $0 8 $44,955 APPLICATIONS DENIED 18 $77,198 47 $66,076 175 $42,678 104 $17,721 2 $249,600 28 $39,446 APPLICATIONS WITHDRAWN 24 $72,995 19 $63,827 76 $61,824 21 $16,480 4 $219,380 7 $89,127 FILES CLOSED FOR INCOMPLETENESS 0 $0 0 $0 10 $95,202 4 $23,405 0 $0 0 $0
Aggregated Statistics For Year 1999(Based on 2 full and 5 partial tracts) A) FHA, FSA/RHS & VA B) Conventional C) Refinancings D) Home Improvement Loans E) Loans on Dwellings For 5+ Families F) Non-occupant Loans on Number Average Value Number Average Value Number Average Value Number Average Value Number Average Value Number Average Value
LOANS ORIGINATED 71 $76,273 72 $77,082 138 $64,046 53 $27,182 2 $440,820 19 $47,602 APPLICATIONS APPROVED, NOT ACCEPTED 2 $87,285 7 $76,464 29 $49,214 23 $20,776 0 $0 2 $55,530 APPLICATIONS DENIED 3 $55,040 19 $62,186 89 $51,153 51 $16,511 0 $0 11 $37,185 APPLICATIONS WITHDRAWN 5 $73,282 11 $109,044 80 $67,342 14 $33,380 0 $0 7 $66,123 FILES CLOSED FOR INCOMPLETENESS 3 $69,407 2 $49,975 19 $68,155 1 $26,130 0 $0 1 $86,620
Private Mortgage Insurance Companies Aggregated Statistics For Year 2009(Based on 6 full and 8 partial tracts) A) Conventional B) Refinancings C) Non-occupant Loans on Number Average Value Number Average Value Number Average Value
LOANS ORIGINATED 20 $176,588 8 $177,676 0 $0 APPLICATIONS APPROVED, NOT ACCEPTED 12 $136,191 6 $171,895 2 $52,770 APPLICATIONS DENIED 8 $145,970 0 $0 0 $0 APPLICATIONS WITHDRAWN 4 $158,610 0 $0 0 $0 FILES CLOSED FOR INCOMPLETENESS 4 $175,912 0 $0 0 $0
Aggregated Statistics For Year 2008(Based on 6 full and 8 partial tracts) A) Conventional B) Refinancings C) Non-occupant Loans on Number Average Value Number Average Value Number Average Value
LOANS ORIGINATED 47 $181,533 24 $214,775 3 $221,657 APPLICATIONS APPROVED, NOT ACCEPTED 15 $192,920 24 $188,099 2 $95,765 APPLICATIONS DENIED 6 $280,678 4 $171,982 6 $270,037 APPLICATIONS WITHDRAWN 4 $135,630 0 $0 0 $0 FILES CLOSED FOR INCOMPLETENESS 0 $0 0 $0 0 $0
Aggregated Statistics For Year 2007(Based on 6 full and 8 partial tracts) A) Conventional B) Refinancings C) Non-occupant Loans on Number Average Value Number Average Value Number Average Value
LOANS ORIGINATED 114 $162,431 34 $190,458 12 $165,591 APPLICATIONS APPROVED, NOT ACCEPTED 13 $183,113 16 $187,919 2 $129,065 APPLICATIONS DENIED 2 $203,675 0 $0 0 $0 APPLICATIONS WITHDRAWN 14 $164,030 6 $246,405 0 $0 FILES CLOSED FOR INCOMPLETENESS 0 $0 2 $165,020 2 $165,020
Aggregated Statistics For Year 2006(Based on 6 full and 8 partial tracts) A) Conventional B) Refinancings C) Non-occupant Loans on Number Average Value Number Average Value Number Average Value
LOANS ORIGINATED 86 $164,678 26 $189,955 14 $104,333 APPLICATIONS APPROVED, NOT ACCEPTED 12 $163,085 7 $166,156 4 $135,030 APPLICATIONS DENIED 2 $60,585 2 $167,370 2 $60,585 APPLICATIONS WITHDRAWN 4 $222,905 2 $177,925 2 $92,835 FILES CLOSED FOR INCOMPLETENESS 0 $0 0 $0 0 $0
Aggregated Statistics For Year 2005(Based on 6 full and 8 partial tracts) A) Conventional B) Refinancings C) Non-occupant Loans on Number Average Value Number Average Value Number Average Value
LOANS ORIGINATED 131 $130,755 31 $137,911 45 $102,159 APPLICATIONS APPROVED, NOT ACCEPTED 26 $123,443 5 $147,114 8 $108,522 APPLICATIONS DENIED 4 $156,518 0 $0 4 $156,518 APPLICATIONS WITHDRAWN 6 $126,972 0 $0 0 $0 FILES CLOSED FOR INCOMPLETENESS 0 $0 2 $139,775 2 $139,775
Aggregated Statistics For Year 2004(Based on 6 full and 8 partial tracts) A) Conventional B) Refinancings C) Non-occupant Loans on Number Average Value Number Average Value Number Average Value
LOANS ORIGINATED 154 $123,439 39 $112,710 41 $86,654 APPLICATIONS APPROVED, NOT ACCEPTED 22 $106,130 12 $140,524 5 $106,760 APPLICATIONS DENIED 6 $194,083 0 $0 2 $326,130 APPLICATIONS WITHDRAWN 6 $131,750 2 $172,110 2 $138,780 FILES CLOSED FOR INCOMPLETENESS 2 $61,645 0 $0 0 $0
Aggregated Statistics For Year 2003(Based on 6 full and 8 partial tracts) A) Conventional B) Refinancings C) Non-occupant Loans on Number Average Value Number Average Value Number Average Value
LOANS ORIGINATED 138 $105,372 86 $107,735 30 $87,084 APPLICATIONS APPROVED, NOT ACCEPTED 19 $105,675 34 $102,418 6 $91,088 APPLICATIONS DENIED 1 $166,460 0 $0 0 $0 APPLICATIONS WITHDRAWN 2 $113,820 6 $78,047 0 $0 FILES CLOSED FOR INCOMPLETENESS 0 $0 0 $0 0 $0
Aggregated Statistics For Year 2002(Based on 6 full and 6 partial tracts) A) Conventional B) Refinancings C) Non-occupant Loans on Number Average Value Number Average Value Number Average Value
LOANS ORIGINATED 114 $93,598 55 $98,634 13 $63,931 APPLICATIONS APPROVED, NOT ACCEPTED 15 $93,873 33 $85,578 0 $0 APPLICATIONS DENIED 4 $98,362 4 $140,448 2 $206,815 APPLICATIONS WITHDRAWN 5 $94,510 3 $111,610 0 $0 FILES CLOSED FOR INCOMPLETENESS 0 $0 2 $116,160 0 $0
Aggregated Statistics For Year 2001(Based on 6 full and 6 partial tracts) A) Conventional B) Refinancings C) Non-occupant Loans on Number Average Value Number Average Value Number Average Value
LOANS ORIGINATED 82 $91,423 34 $105,231 11 $52,479 APPLICATIONS APPROVED, NOT ACCEPTED 20 $81,851 5 $113,890 4 $52,770 APPLICATIONS DENIED 0 $0 2 $62,540 0 $0 APPLICATIONS WITHDRAWN 1 $170,550 1 $105,180 0 $0 FILES CLOSED FOR INCOMPLETENESS 0 $0 0 $0 0 $0
Aggregated Statistics For Year 2000(Based on 6 full and 6 partial tracts) A) Conventional B) Refinancings C) Non-occupant Loans on Number Average Value Number Average Value Number Average Value
LOANS ORIGINATED 90 $77,861 12 $84,842 16 $42,178 APPLICATIONS APPROVED, NOT ACCEPTED 8 $65,255 1 $85,060 0 $0 APPLICATIONS DENIED 2 $74,640 2 $47,885 2 $47,885 APPLICATIONS WITHDRAWN 0 $0 0 $0 0 $0 FILES CLOSED FOR INCOMPLETENESS 0 $0 0 $0 0 $0
Aggregated Statistics For Year 1999(Based on 2 full and 5 partial tracts) A) Conventional B) Refinancings C) Non-occupant Loans on Number Average Value Number Average Value Number Average Value
LOANS ORIGINATED 28 $82,753 11 $98,637 3 $36,823 APPLICATIONS APPROVED, NOT ACCEPTED 4 $82,238 5 $85,842 0 $0 APPLICATIONS DENIED 2 $43,100 0 $0 1 $27,140 APPLICATIONS WITHDRAWN 1 $63,980 1 $89,140 0 $0 FILES CLOSED FOR INCOMPLETENESS 0 $0 0 $0 0 $0
2002 - 2018 National Fire Incident Reporting System (NFIRS) incidents See full 2006 National Fire Incident Reporting System statistics for zip code 08107, New Jersey
Most common first names in zip code 08107 among deceased individuals Name Count Lived (average)
John 210 73.6 years William 184 75.3 years Mary 158 79.6 years Joseph 152 74.6 years Edward 97 72.2 years Helen 88 78.8 years Charles 88 76.2 years Anna 87 81.2 years James 85 70.0 years Robert 85 71.5 years
Most common last names in zip code 08107 among deceased individuals Last name Count Lived (average)
Smith 32 79.4 years Williams 25 79.1 years Miller 23 77.7 years Brown 19 76.2 years Jones 18 77.1 years Taylor 16 70.6 years Martin 16 77.2 years Moore 15 73.0 years Johnson 14 74.4 years Thompson 13 80.2 years
Businesses in zip code 08107
Name Count Name Count
7-Eleven 1 Rite Aid 1 Advance Auto Parts 1 Taco Bell 1 CVS 1 UPS 1 Dunkin Donuts 1


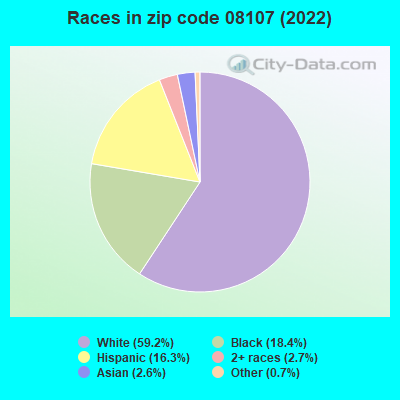


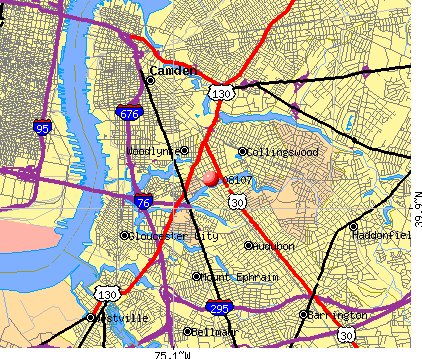 Nearest zip codes: 08106, 08108, 08059, 08104, 08035, 08030.
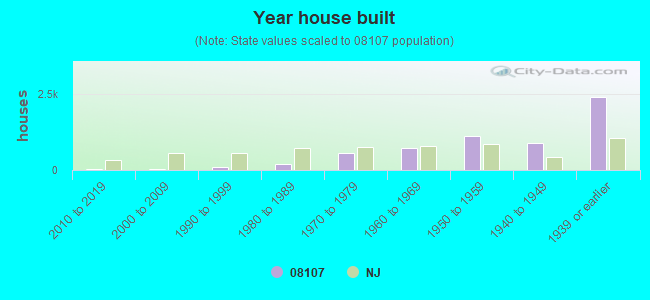

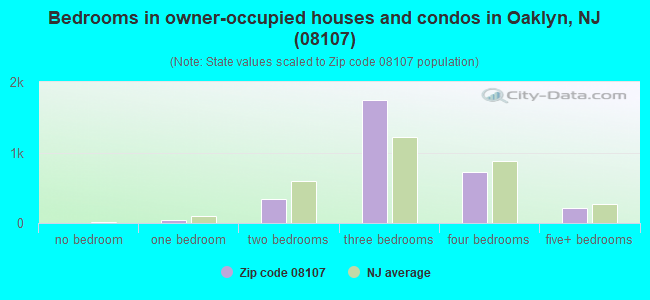
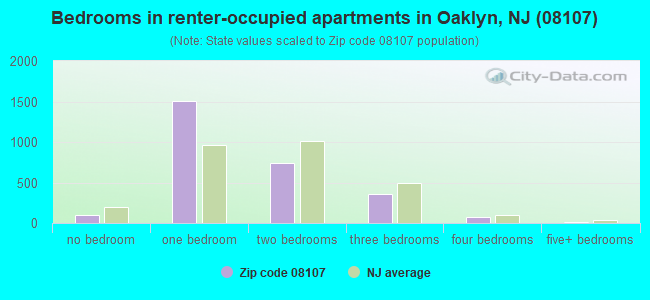
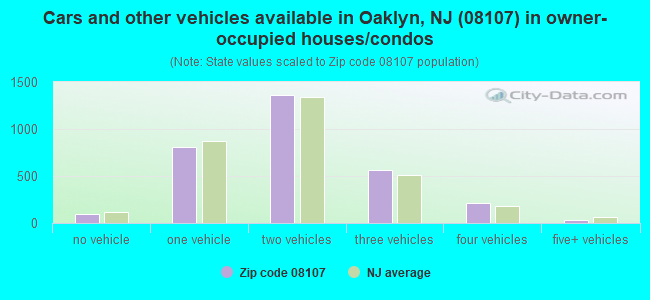
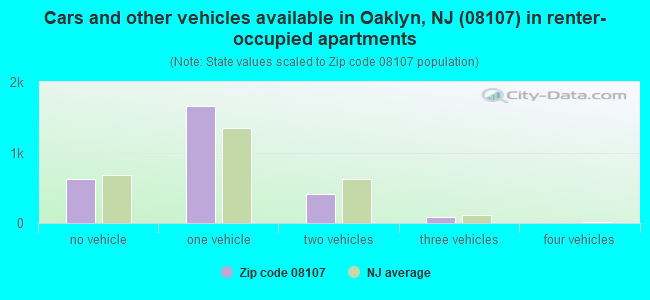


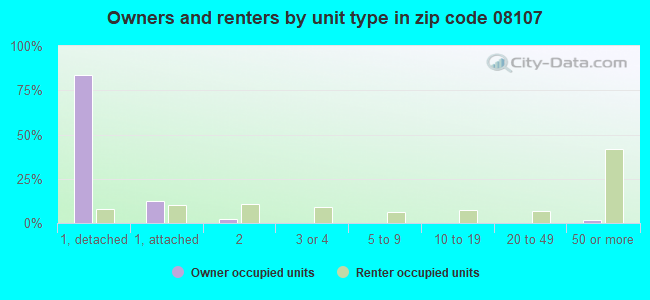
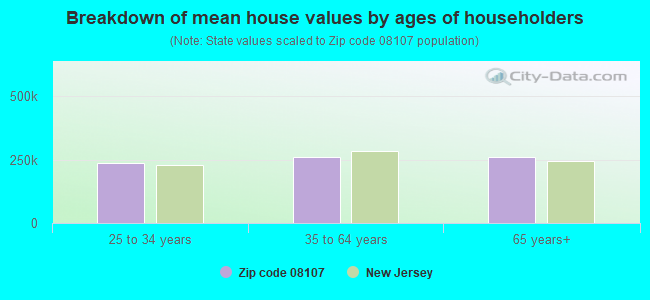


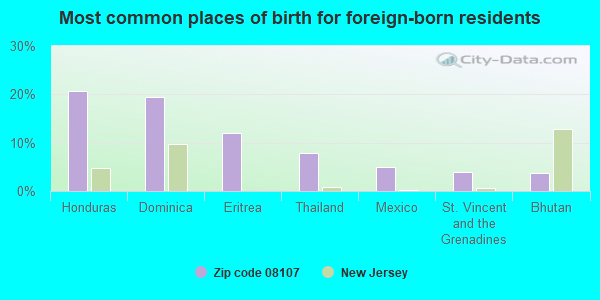
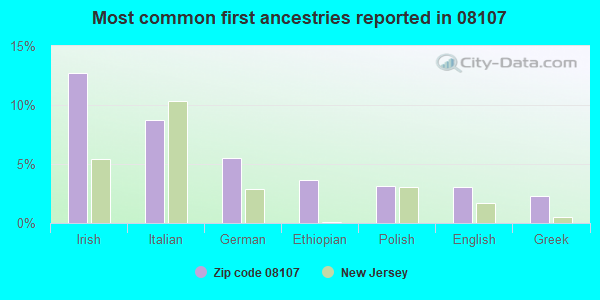
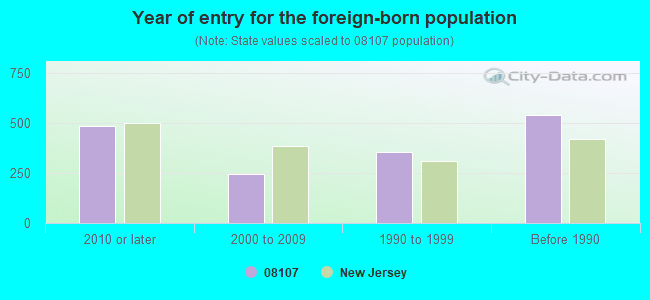
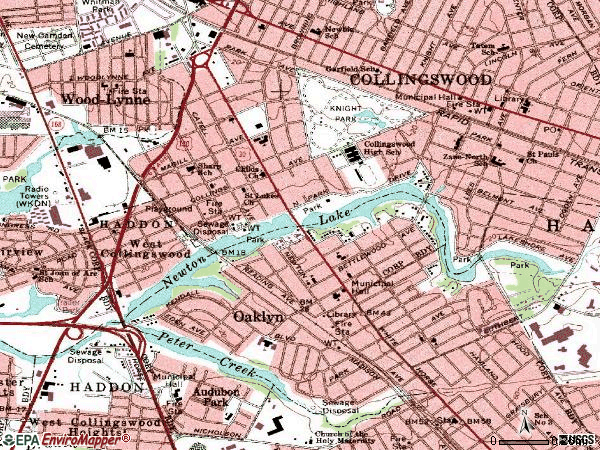

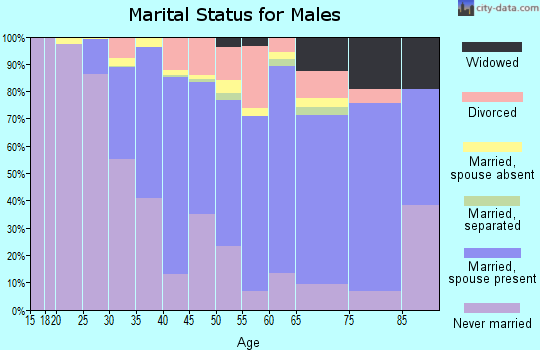
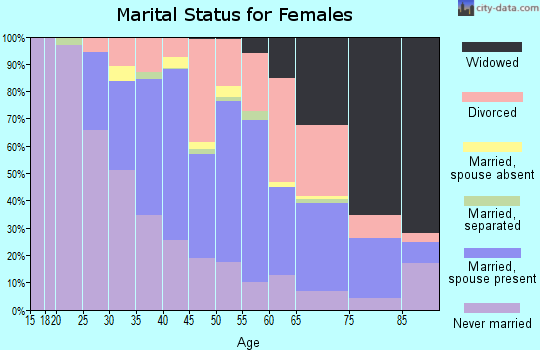
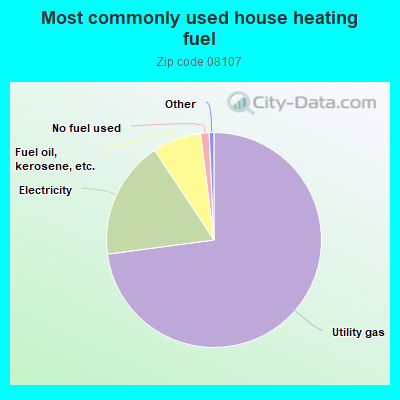
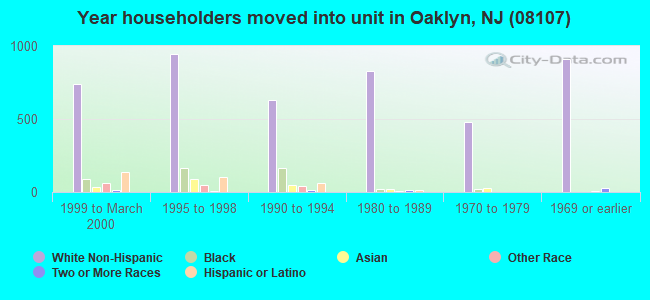
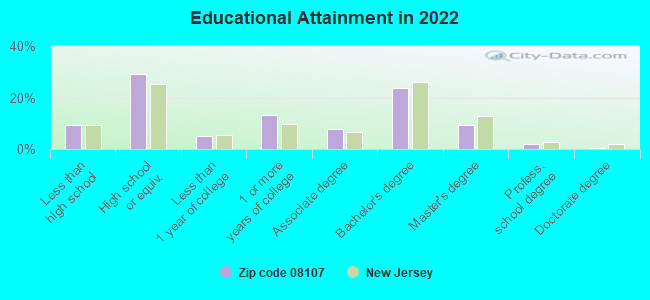
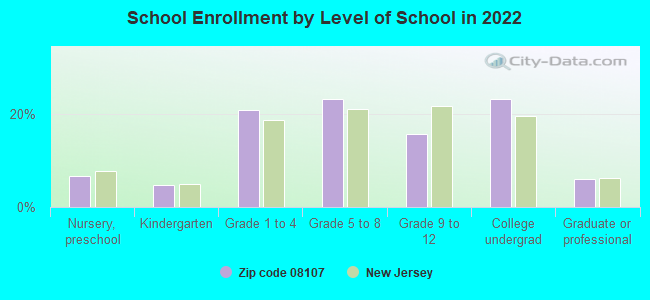
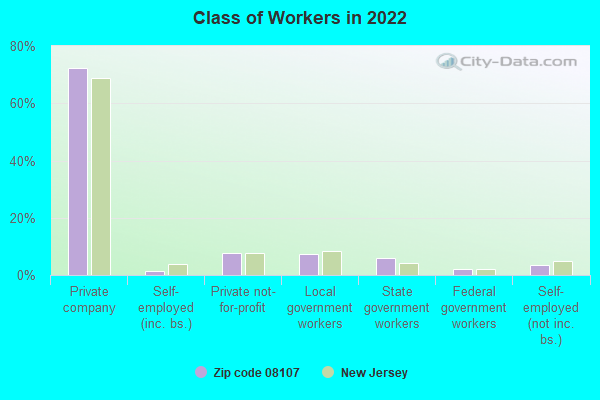
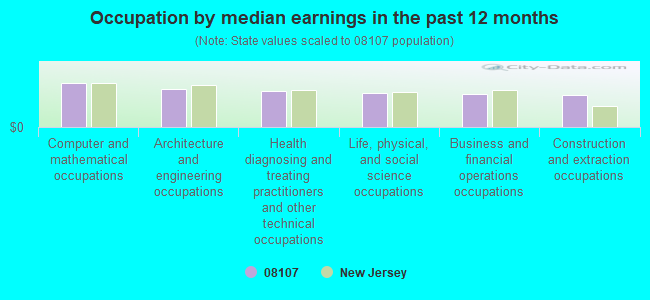
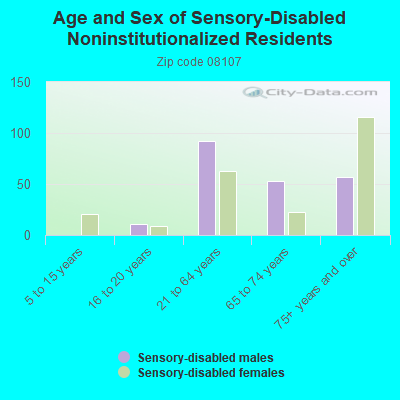
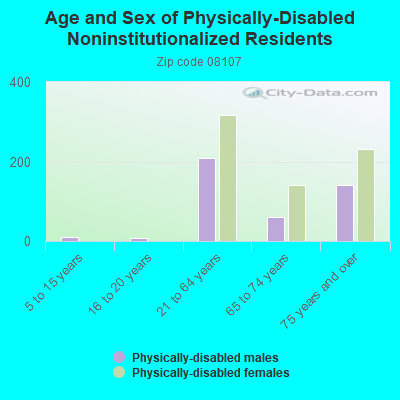
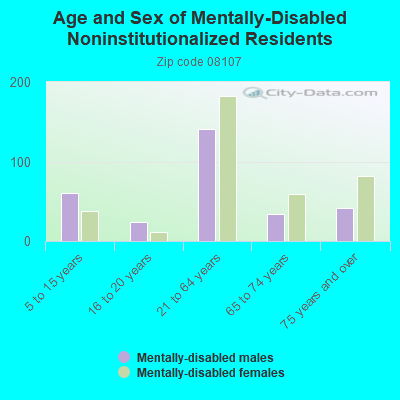
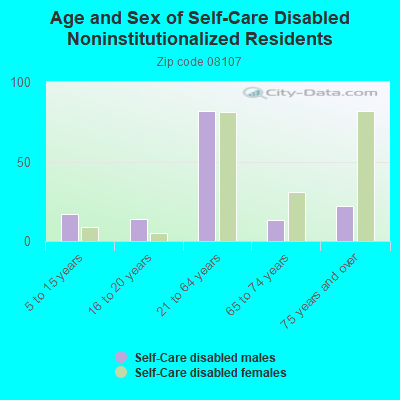
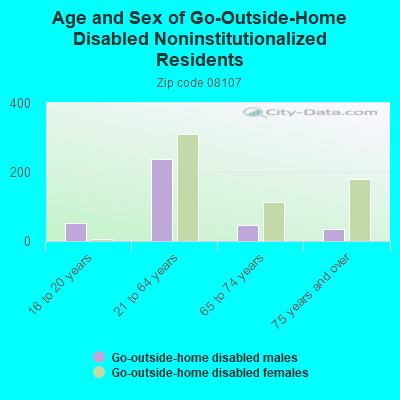
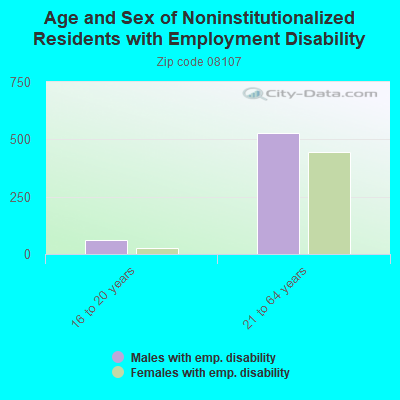
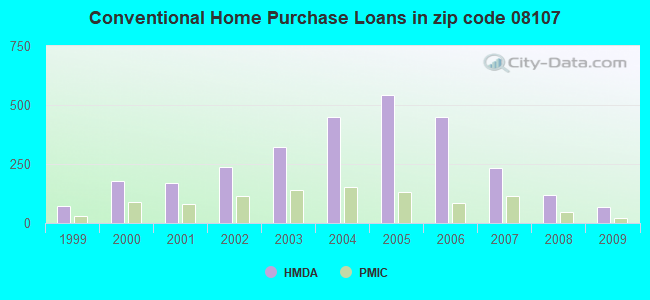
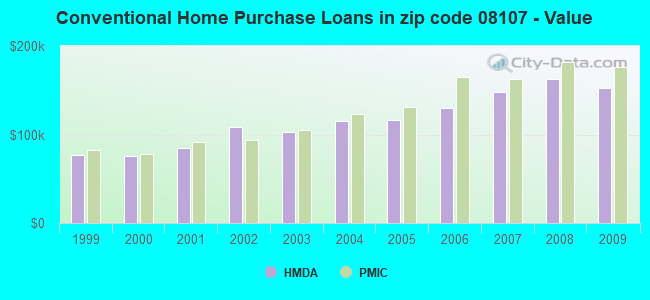
 According to the data from the years 2002 - 2018 the average number of fires per year is 81. The highest number of reported fire incidents - 129 took place in 2006, and the least - 0 in 2003. The data has a growing trend.
 When looking into fire subcategories, the most incidents belonged to: Structure Fires (72.6%), and Outside Fires (18.7%).