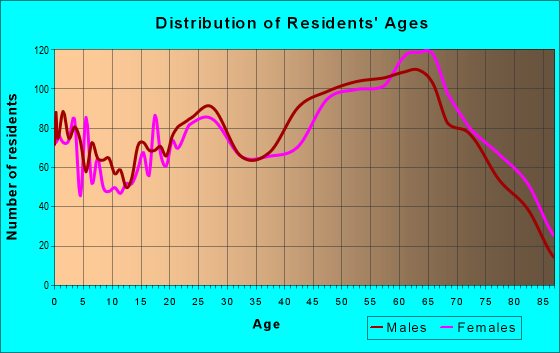
Estimated zip code population in 2022: 12,697 Zip code population in 2010: 13,661 Zip code population in 2000: 15,326
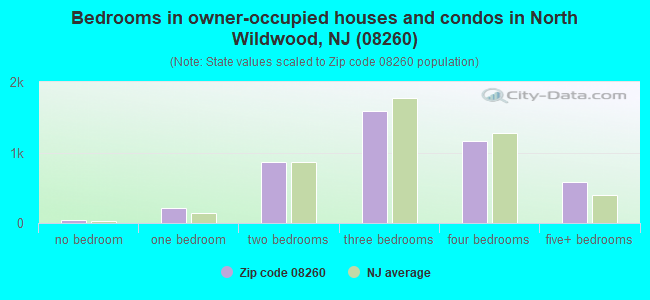
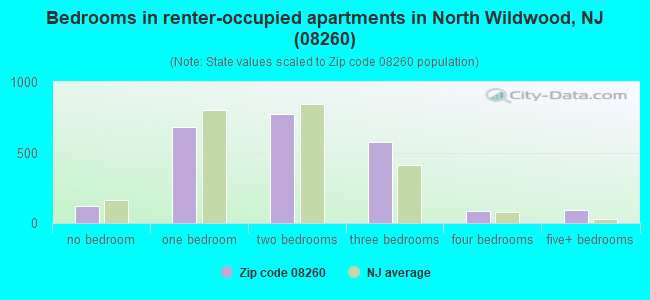
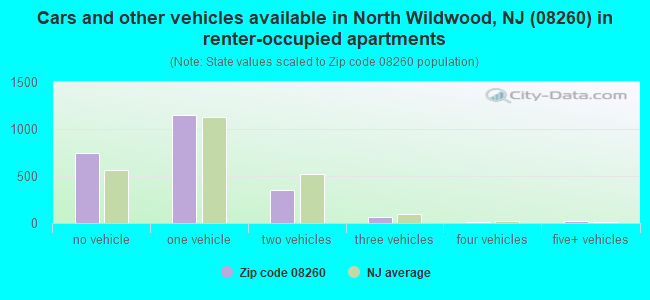
Houses and condos: 23,535 Renter-occupied apartments: 2,333
% of renters here:
34%
State:
35%
March 2022 cost of living index in zip code 08260: 104.3 (near average, U.S. average is 100)
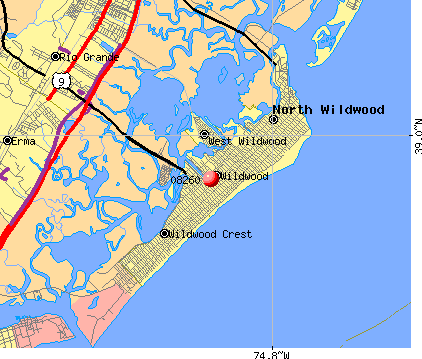
Land area: 15.9 sq. mi. Water area: 8.9 sq. mi.
Population density: 800 people per square mile
(low).
OSM Map
Google Map
MSN Map
OSM Map
General Map
Google Map
MSN Map
OSM Map
Google Map
MSN Map
OSM Map
Google Map
MSN Map
Please wait while loading the map...
Real estate property taxes paid for housing units in 2022:
This zip code:
1.3% ($5,609)
New Jersey:
2.1% ($8,897)
Median real estate property taxes paid for housing units with mortgages in 2022: $5,722 (1.3%) Median real estate property taxes paid for housing units with no mortgage in 2022: $5,472 (1.2%)
Averages for the 2020 tax year for zip code 08260, filed in 2021:
Average Adjusted Gross Income (AGI) in 2020: $61,602 (Individual Income Tax Returns)
Here:
$61,602
State:
$95,247
Salary/wage: $43,978 (reported on 75.5% of returns)
Here:
$43,978
State:
$80,635
(% of AGI for various income ranges: 1192.5% for AGIs below $25k, 3129.3% for AGIs $25k-50k, 5276.5% for AGIs $50k-75k, 7688.1% for AGIs $75k-100k, 15070.7% for AGIs $100k-200k, 81532.5% for AGIs over 200k)
Taxable interest for individuals: $1,778 (reported on 33.5% of returns)
This zip code:
$1,778
New Jersey:
$2,414
(% of AGI for various income ranges: 16.6% for AGIs below $25k, 28.0% for AGIs $25k-50k, 101.5% for AGIs $50k-75k, 231.1% for AGIs $75k-100k, 262.7% for AGIs $100k-200k, 1717.5% for AGIs over 200k)
Ordinary dividends: $5,442 (reported on 22.0% of returns)
Here:
$5,442
State:
$8,057
(% of AGI for various income ranges: 23.1% for AGIs below $25k, 64.0% for AGIs $25k-50k, 145.9% for AGIs $50k-75k, 338.1% for AGIs $75k-100k, 617.1% for AGIs $100k-200k, 3937.5% for AGIs over 200k)
Net capital gain/loss in AGI: +$18,289 (reported on 19.1% of returns)
Here:
+$18,289
State:
+$25,022
(% of AGI for various income ranges: 1.7% for AGIs below $25k, 73.1% for AGIs $25k-50k, 157.6% for AGIs $50k-75k, 355.2% for AGIs $75k-100k, 1446.1% for AGIs $100k-200k, 20638.8% for AGIs over 200k)
Profit/loss from business: +$22,657 (reported on 12.9% of returns)
Here:
+$22,657
State:
+$18,035
(% of AGI for various income ranges: 86.6% for AGIs below $25k, 196.1% for AGIs $25k-50k, 389.4% for AGIs $50k-75k, 359.3% for AGIs $75k-100k, 1336.8% for AGIs $100k-200k, 10398.8% for AGIs over 200k)
Taxable individual retirement arrangement distribution: $18,619 (reported on 11.8% of returns)
08260:
$18,619
New Jersey:
$21,558
(% of AGI for various income ranges: 52.8% for AGIs below $25k, 120.2% for AGIs $25k-50k, 476.1% for AGIs $50k-75k, 1005.9% for AGIs $75k-100k, 1390.7% for AGIs $100k-200k, 2837.5% for AGIs over 200k)
Self-employed (Keogh) retirement plans: $26,150 (reported on 0.6% of returns)
08260:
$26,150
New Jersey:
$30,844
(% of AGI for various income ranges: 25.3% for AGIs $25k-50k, 892.5% for AGIs over 200k)
Total itemized deductions: $28,828 (reported on 9.6% of returns)
Here:
$28,828
State:
$32,863
(% of AGI for various income ranges: 67.8% for AGIs below $25k, 171.1% for AGIs $25k-50k, 479.8% for AGIs $50k-75k, 857.8% for AGIs $75k-100k, 1385.4% for AGIs $100k-200k, 7235.0% for AGIs over 200k)
Charity contributions: $4,272 (reported on 8.0% of returns)
Here:
$4,272
State:
$7,880
(% of AGI for various income ranges: 4.0% for AGIs below $25k, 17.3% for AGIs $25k-50k, 46.3% for AGIs $50k-75k, 101.5% for AGIs $75k-100k, 153.4% for AGIs $100k-200k, 1278.8% for AGIs over 200k)
Taxes paid: $8,346 (reported on 9.4% of returns)
08260:
$8,346
State:
$9,183
(% of AGI for various income ranges: 19.6% for AGIs below $25k, 45.4% for AGIs $25k-50k, 132.4% for AGIs $50k-75k, 285.9% for AGIs $75k-100k, 450.7% for AGIs $100k-200k, 1720.0% for AGIs over 200k)
Earned income credit: $2,070 (reported on 16.8% of returns)
Here:
$2,070
State:
$2,148
(% of AGI for various income ranges: 88.8% for AGIs below $25k, 63.8% for AGIs $25k-50k)
Percentage of individuals using paid preparers for their 2020 taxes: 92.2%
Here:
92%
State:
92%
(% for various income ranges: 90.8% for AGIs below $25k, 93.5% for AGIs $25k-50k, 92.1% for AGIs $50k-75k, 92.0% for AGIs $75k-100k, 94.0% for AGIs $100k-200k, 93.3% for AGIs over 200k)
Averages for the 2012 tax year for zip code 08260, filed in 2013:
Average Adjusted Gross Income (AGI) in 2012: $44,032 (Individual Income Tax Returns)
Here:
$44,032
State:
$79,688
Salary/wage: $31,784 (reported on 79.8% of returns)
Here:
$31,784
State:
$68,122
(% of AGI for various income ranges: 66.2% for AGIs below $25k, 62.7% for AGIs $25k-50k, 54.9% for AGIs $50k-75k, 53.5% for AGIs $75k-100k, 57.2% for AGIs $100k-200k, 51.1% for AGIs over 200k)
Taxable interest for individuals: $1,770 (reported on 34.6% of returns)
This zip code:
$1,770
New Jersey:
$2,193
(% of AGI for various income ranges: 1.3% for AGIs below $25k, 1.1% for AGIs $25k-50k, 1.3% for AGIs $50k-75k, 1.4% for AGIs $75k-100k, 1.4% for AGIs $100k-200k, 1.8% for AGIs over 200k)
Ordinary dividends: $3,592 (reported on 21.0% of returns)
Here:
$3,592
State:
$6,828
(% of AGI for various income ranges: 1.3% for AGIs below $25k, 1.4% for AGIs $25k-50k, 1.7% for AGIs $50k-75k, 1.8% for AGIs $75k-100k, 1.9% for AGIs $100k-200k, 2.0% for AGIs over 200k)
Net capital gain/loss in AGI: +$11,510 (reported on 15.4% of returns)
Here:
+$11,510
State:
+$15,358
(% of AGI for various income ranges: 0.4% for AGIs $25k-50k, 1.3% for AGIs $50k-75k, 1.3% for AGIs $75k-100k, 2.9% for AGIs $100k-200k, 16.5% for AGIs over 200k)
Profit/loss from business: +$14,685 (reported on 11.8% of returns)
Here:
+$14,685
State:
+$19,577
(% of AGI for various income ranges: 4.7% for AGIs below $25k, 4.0% for AGIs $25k-50k, 3.9% for AGIs $50k-75k, 3.8% for AGIs $75k-100k, 3.1% for AGIs $100k-200k, 4.4% for AGIs over 200k)
Taxable individual retirement arrangement distribution: $14,244 (reported on 11.7% of returns)
08260:
$14,244
New Jersey:
$18,214
(% of AGI for various income ranges: 2.3% for AGIs below $25k, 3.3% for AGIs $25k-50k, 4.2% for AGIs $50k-75k, 5.3% for AGIs $75k-100k, 5.3% for AGIs $100k-200k, 2.1% for AGIs over 200k)
Self-employment retirement plans: $14,900 (reported on 0.3% of returns)
08260:
$14,900
New Jersey:
$24,511
Total itemized deductions: $23,162 (24% of AGI, reported on 26.5% of returns)
Here:
$23,162
State:
$30,827
Here:
24.4% of AGI
State:
21.2% of AGI
(% of AGI for various income ranges: 10.3% for AGIs below $25k, 10.7% for AGIs $25k-50k, 14.6% for AGIs $50k-75k, 15.9% for AGIs $75k-100k, 16.5% for AGIs $100k-200k, 14.8% for AGIs over 200k)
Charity contributions: $2,346 (reported on 21.3% of returns)
Here:
$2,346
State:
$3,451
(% of AGI for various income ranges: 0.5% for AGIs below $25k, 0.8% for AGIs $25k-50k, 1.3% for AGIs $50k-75k, 1.2% for AGIs $75k-100k, 1.5% for AGIs $100k-200k, 1.4% for AGIs over 200k)
Taxes paid: $9,401 (reported on 26.5% of returns)
08260:
$9,401
State:
$15,801
(% of AGI for various income ranges: 3.0% for AGIs below $25k, 3.2% for AGIs $25k-50k, 5.1% for AGIs $50k-75k, 5.8% for AGIs $75k-100k, 7.2% for AGIs $100k-200k, 8.7% for AGIs over 200k)
Earned income credit: $2,141 (reported on 21.8% of returns)
Here:
$2,141
State:
$2,182
(% of AGI for various income ranges: 6.1% for AGIs below $25k, 0.9% for AGIs $25k-50k)
Percentage of individuals using paid preparers for their 2012 taxes: 63.9%
Here:
64%
State:
65%
(% for various income ranges: 60.5% for AGIs below $25k, 62.0% for AGIs $25k-50k, 63.2% for AGIs $50k-75k, 72.3% for AGIs $75k-100k, 79.6% for AGIs $100k-200k, 92.9% for AGIs over 200k)
Averages for the 2004 tax year for zip code 08260, filed in 2005:
Average Adjusted Gross Income (AGI) in 2004: $41,225 (Individual Income Tax Returns)
Here:
$41,225
State:
$64,921
Salary/wage: $28,308 (reported on 80.1% of returns)
Here:
$28,308
State:
$57,755
(% of AGI for various income ranges: 105.4% for AGIs below $10k, 69.1% for AGIs $10k-25k, 69.2% for AGIs $25k-50k, 65.3% for AGIs $50k-75k, 64.2% for AGIs $75k-100k, 34.8% for AGIs over 100k)
Taxable interest for individuals: $2,220 (reported on 47.0% of returns)
This zip code:
$2,220
New Jersey:
$2,068
(% of AGI for various income ranges: 7.8% for AGIs below $10k, 2.2% for AGIs $10k-25k, 2.2% for AGIs $25k-50k, 2.8% for AGIs $50k-75k, 2.1% for AGIs $75k-100k, 2.5% for AGIs over 100k)
Taxable dividends: $2,742 (reported on 26.1% of returns)
Here:
$2,742
State:
$3,959
(% of AGI for various income ranges: 5.4% for AGIs below $10k, 1.7% for AGIs $10k-25k, 1.5% for AGIs $25k-50k, 1.7% for AGIs $50k-75k, 1.3% for AGIs $75k-100k, 1.8% for AGIs over 100k)
Net capital gain/loss: +$28,303 (reported on 19.6% of returns)
Here:
+$28,303
State:
+$13,591
(% of AGI for various income ranges: 0.0% for AGIs below $10k, 0.1% for AGIs $10k-25k, 0.6% for AGIs $25k-50k, 2.6% for AGIs $50k-75k, 4.4% for AGIs $75k-100k, 31.0% for AGIs over 100k)
Profit/loss from business: +$18,918 (reported on 10.7% of returns)
Here:
+$18,918
State:
+$17,520
(% of AGI for various income ranges: 2.2% for AGIs below $10k, 4.1% for AGIs $10k-25k, 3.7% for AGIs $25k-50k, 3.7% for AGIs $50k-75k, 4.3% for AGIs $75k-100k, 6.4% for AGIs over 100k)
IRA payment deduction: $3,585 (reported on 3.8% of returns)
08260:
$3,585
New Jersey:
$3,270
(% of AGI for various income ranges: 0.5% for AGIs below $10k, 0.3% for AGIs $10k-25k, 0.4% for AGIs $25k-50k, 0.4% for AGIs $50k-75k, 0.3% for AGIs $75k-100k, 0.2% for AGIs over 100k)
Self-employed pension: $16,241 (reported on 0.7% of returns)
Here:
$16,241
New Jersey:
$17,258
Total itemized deductions: $18,850 (21% of AGI, reported on 25.9% of returns)
Here:
$18,850
State:
$23,924
Here:
21.1% of AGI
State:
21.1% of AGI
(% of AGI for various income ranges: 12.9% for AGIs below $10k, 9.1% for AGIs $10k-25k, 10.7% for AGIs $25k-50k, 14.7% for AGIs $50k-75k, 16.4% for AGIs $75k-100k, 11.0% for AGIs over 100k)
Charity contributions deductions: $2,387 (3% of AGI, reported on 22.8% of returns)
Here:
$2,387
State:
$3,242
Here:
2.5% of AGI
State:
2.7% of AGI
(% of AGI for various income ranges: 0.6% for AGIs below $10k, 0.8% for AGIs $10k-25k, 1.1% for AGIs $25k-50k, 1.8% for AGIs $50k-75k, 1.8% for AGIs $75k-100k, 1.4% for AGIs over 100k)
Total tax: $7,449 (reported on 68.1% of returns)
08260:
$7,449
State:
$12,321
(% of AGI for various income ranges: 2.2% for AGIs below $10k, 3.8% for AGIs $10k-25k, 7.6% for AGIs $25k-50k, 9.8% for AGIs $50k-75k, 11.4% for AGIs $75k-100k, 19.1% for AGIs over 100k)
Earned income credit: $1,692 (reported on 19.0% of returns)
Here:
$1,692
State:
$1,711
Percentage of individuals using paid preparers for their 2004 taxes: 67.6%
Here:
68%
State:
65%
(% for various income ranges: 60.6% for AGIs below $10k, 66.9% for AGIs $10k-25k, 66.6% for AGIs $25k-50k, 70.1% for AGIs $50k-75k, 73.3% for AGIs $75k-100k, 90.4% for AGIs over 100k)
Likely homosexual households (counted as self-reported same-sex unmarried-partner households)
Lesbian couples: 0.0% of all households
Gay men: 0.1% of all households
Household received Food Stamps/SNAP in the past 12 months: 1,014 Household did not receive Food Stamps/SNAP in the past 12 months: 5,809
Women who had a birth in the past 12 months: 50 (10 now married, 38 unmarried) Women who did not have a birth in the past 12 months: 1,857 (620 now married, 1,240 unmarried)
Housing units in zip code 08260 with a mortgage: 2,315 (89 second mortgage, 90 both second mortgage and home equity loan) Houses without a mortgage: 105
Median monthly owner costs for units with a mortgage: $2,039 Median monthly owner costs for units without a mortgage: $926
Residents with income below the poverty level in 2022:
This zip code:
12.1%
Whole state:
9.7%
Residents with income below 50% of the poverty level in 2022:
This zip code:
5.9%
Whole state:
5.2%
Median number of rooms in houses and condos:
Here:
6.3
State:
6.8
Median number of rooms in apartments:
Here:
4.0
State:
3.9
Notable locations in this zip code not listed on our city pages
Notable locations in zip code 08260: Cold Spring Harbor Dock (A), Wildwood Crest Emergency Medical Services / Rescue (B), West Wildwood Fire Department (C), Wildwood Crest Borough Emergency Management Services (D), North Wildwood Fire Department Anglesea Volunteer Fire Company (E), Wildwood Fire Department Station 3 - 1 Holly Beach Volunteer Fire Company 1 (F), Wildwood Fire Department Station 3 Headquarters (G), Wildwood Fire Department Station 3 - 2 Wildwood Volunteer Fire Company 1 (H), Wildwood Crest Volunteer Fire Company 1 (I), North Wildwood Fire Department (J), Bureau of Fire Inspection (K), North Wildwood Volunteer Fire Company (L). Display/hide their locations on the map
Lakes and swamps: Sunset Lake (A), Hildreth Meadow (B), Beach Creek Meadow (C), Anglesea Marsh (D), Grassy Sound Meadow (E). Display/hide their locations on the map
Streams, rivers, and creeks: Jones Creek (A), Gravelly Run (B), Gar Creek (C), Meadow Creek (D), Warren Creek (E), York Creek (F), Cresse Creek (G), Clubhouse Creek (H), Tempe Creek (I). Display/hide their locations on the map
666 married couples with children.
447 single-parent households (65 men, 382 women).
87.9% of residents of 08260 zip code speak English at home.
10.3% of residents speak Spanish at home (49% very well, 29% well, 21% not well).
2.0% of residents speak other Indo-European language at home (86% very well, 7% well, 6% not well).
0.1% of residents speak Asian or Pacific Island language at home (100% very well).
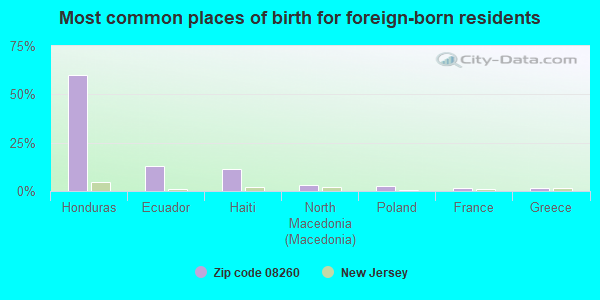
Foreign born population: 956 (7.5%) (20.8% of them are naturalized citizens)
This zip code:
7.5%
Whole state:
23.5%
60%Honduras
13%Ecuador
11%Haiti
3%North Macedonia (Macedonia)
3%Poland
2%France
2%Greece
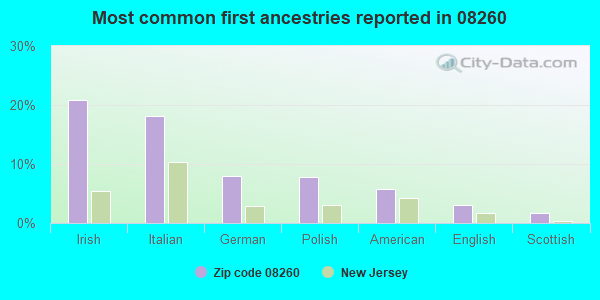
21%Irish
18%Italian
8%German
8%Polish
6%American
3%English
2%Scottish
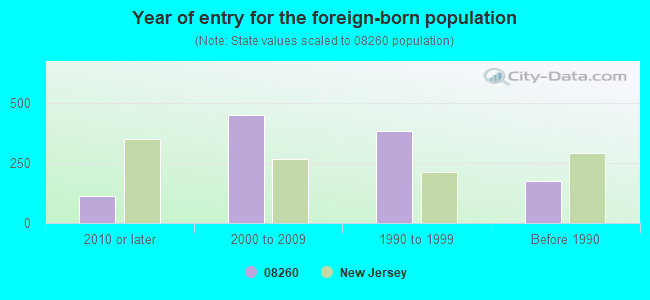
Year of entry for the foreign-born population
1142010 or later
4492000 to 2009
3841990 to 1999
176Before 1990
Major facilities with environmental interests located in this zip code:
OTTENS HARBOR MARINE SERVICE (788 W MONTGOMERY AVE in WILDWOOD CITY, NJ)
ENFORCEMENT/COMPLIANCE ACTIVITY (Integrated Compliance Information System) - ICIS-02-2004-0913, FORMAL ENFORCEMENT ACTION (Integrated Compliance Information System) - ICIS-02-2004-0913, FORMAL ENFORCEMENT ACTION STATE MASTER (New Jersey environmental info) - NJEMS-G000062911, STATE CLEANUP SITE Business SIC classification: MARINAS Alternative names: OTTEN'S HARBOR
B&E MARINE INC (626 W 26TH ST in WEST WILDWOOD, NJ)
ENFORCEMENT/COMPLIANCE ACTIVITY (Integrated Compliance Information System) STATE MASTER (New Jersey environmental info) - NJEMS-012149, STATE CLEANUP SITE, NJEMS-236623, REFUSE DISPOSAL, NJEMS-47930, National Pollutant Discharge Elimination System Permit, NJEMS-NRG100000179, HAZARDOUS WASTE PROGRAM National Pollutant Discharge Elimination System NON-MAJOR (Tracking pollutant discharge elimination systems) - permit Business SIC classification: MARINAS Organizations: MARTA EILEEN, BARDE MARINE, B & E MARINE INC (CONTACT/OWNER)
, MARTA ROBERT & EILEEN (CONTACT/OWNER)
Alternative names: B & E MARINA
ABS SIGN CO INC (3008 PARK BLVD in WILDWOOD CITY, NJ)
STATE MASTER (New Jersey environmental info) - NJEMS-18721700000, EPCRA, NJEMS-216228, National Pollutant Discharge Elimination System Permit National Pollutant Discharge Elimination System NON-MAJOR (Tracking pollutant discharge elimination systems) - permit Business SIC classification: SIGNS AND ADVERTISING SPECIALTIES Alternative names: A B S SIGN CO INC
HENRI JS SERVICE STATION (301 WEST SPRUCE STREET in NORTH WILDWOOD, NJ)
(Integrated Compliance Information System) - ICIS-HQ-2001-0533, FORMAL ENFORCEMENT ACTION STATE MASTER (New Jersey environmental info) - NJEMS-00000001048, EPCRA, NJEMS-010099, STATE CLEANUP SITE, NJEMS-A7347, AIR PROGRAM Business SIC classification: GASOLINE SERVICE STATIONS Organizations: BEDARD HENRI J (CONTACT/OWNER)
Alternative names: HENRY J'S
NORTH WILDWOOD CITY MUNICIPAL BUILDING (901 ATLANTIC AVE in NORTH WILDWOOD CITY, NJ)
STATE MASTER (New Jersey environmental info) - NJEMS-000105, STATE CLEANUP SITE, NJEMS-159878, NPDES STORMWATER PERMIT, NJEMS-203745, National Pollutant Discharge Elimination System Permit, NJEMS-93926, WASTEWATER FACILITY, NJEMS-H7310, AIR PROGRAM National Pollutant Discharge Elimination System NON-MAJOR (Tracking pollutant discharge elimination systems) - permit Business SIC classification: GASOLINE SERVICE STATIONS
PIER 47 MARINA (3001 WILDWOOD BOULEVARD in WILDWOOD CITY, NJ)
ENFORCEMENT/COMPLIANCE ACTIVITY (Integrated Compliance Information System) STATE MASTER (New Jersey environmental info) - NJEMS-47940, National Pollutant Discharge Elimination System Permit, NJEMS-NRG100000267, HAZARDOUS WASTE PROGRAM National Pollutant Discharge Elimination System NON-MAJOR (Tracking pollutant discharge elimination systems) - permit Business SIC classification: MARINAS Organizations: PIER 47 INC Alternative names: PIER 47 INC
EXXON SERVICE STATION #39689 (NEW YORK & SPRUCE AVE in NORTH WILDWOOD, NJ)
STATE MASTER (New Jersey environmental info) - NJEMS-007854, STATE CLEANUP SITE (Resource Conservation and Recovery Act (tracking hazardous waste)) Organizations: EXXON CO USA (CONTACT/OPERATOR)
Alternative names: EXXON CO USA 39689
BOBS CLEANERS (4407 PARK BLVD in WILDWOOD CITY, NJ)
STATE MASTER (New Jersey environmental info) - NJEMS-00000000250, EPCRA, NJEMS-L7308, AIR PROGRAM (Resource Conservation and Recovery Act (tracking hazardous waste)) Business SIC classification: DRYCLEANING PLANTS, EXCEPT RUG CLEANING
NORTH WILDWOOD CITY DPW (511 W OAK AVE in NORTH WILDWOOD, NJ)
STATE MASTER (New Jersey environmental info) - NJEMS-H8760, AIR PROGRAM, NJEMS-198138, REFUSE DISPOSAL (Resource Conservation and Recovery Act (tracking hazardous waste)) Business SIC classification: GASOLINE SERVICE STATIONS Alternative names: NORTH WILDWOOD CITY OF - DPW
NY GAS MART (1411 NEW YORK AVE in NORTH WILDWOOD, NJ)
STATE MASTER (New Jersey environmental info) - NJEMS-013110, STATE CLEANUP SITE (Resource Conservation and Recovery Act (tracking hazardous waste)) Organizations: GUZZONE ROCCO & SITTINER SADIE (CONTACT/OWNER)
OSWALDS CLEANERS (1003 NEW JERSEY AVE in NORTH WILDWOOD CITY, NJ)
STATE MASTER (New Jersey environmental info) - NJEMS-L7301, AIR PROGRAM (Resource Conservation and Recovery Act (tracking hazardous waste)) Business SIC classification: DRYCLEANING PLANTS, EXCEPT RUG CLEANING Organizations: OSWALD & TAYLOR INC Alternative names: MICHAELS FABRICARE
NORTH WILDWOOD CITY BD OF ED MARGARET MACE SCHOOL (1201 ATLANTIC AVE in NORTH WILDWOOD, NJ)
COMPLIANCE ACTIVITY (Tracking inspections of insecticide, fungicide, and rodenticide, and toxic substances) STATE MASTER (New Jersey environmental info) - NJEMS-011243, STATE CLEANUP SITE, NJEMS-73231, AIR PROGRAM, NJEMS-3680-060-09, PESTICIDES - APPLICATION Alternative names: MARGARET MACE ELEM, NORTH WILDWOOD BOARD OF ED
NORTH WILDWOOD SCHOOL DIST (13TH & ATLANTIC AVE in NORTH WILDWOOD, NJ)
(Integrated Compliance Information System) - ICIS-02-1987-0043, FORMAL ENFORCEMENT ACTION
Housing units lacking complete plumbing facilities: 0.6% Housing units lacking complete kitchen facilities: 0.8%
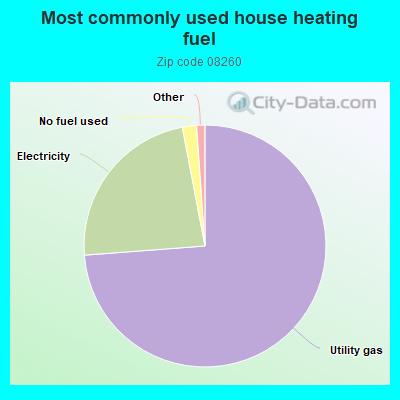
73.8%Utility gas
23.2%Electricity
1.9%No fuel used
Population in 1990: 14,194. Population change in the 1990s: +1,132 (+8.0%).
Place of birth for U.S.-born residents:
This state: 4,689
Northeast: 6,088
Midwest: 147
South: 586
West: 120
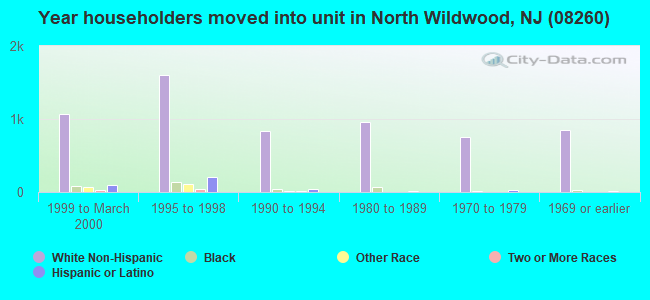
56% of the 08260 zip code residents lived in the same house 5 years ago. Out of people who lived in different houses, 54% lived in this county. Out of people who lived in different counties, 50% lived in New Jersey.
87% of the 08260 zip code residents lived in the same house 1 year ago. Out of people who lived in different houses, 30% moved from this county. Out of people who lived in different houses, 34% moved from different county within same state. Out of people who lived in different houses, 36% moved from different state.
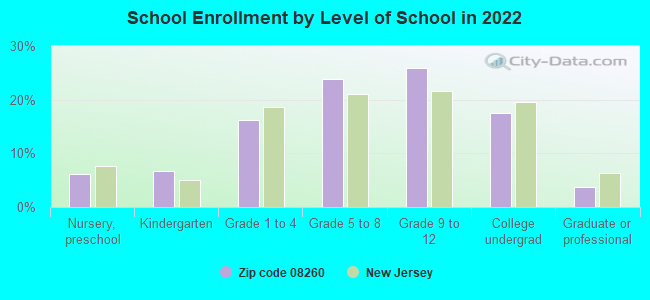
Private vs. public school enrollment:
Students in private schools in grades 1 to 8 (elementary and middle school): 23
Here:
3.6%
New Jersey:
12.3%
Students in private schools in grades 9 to 12 (high school): 47
Here:
11.0%
New Jersey:
13.1%
Students in private undergraduate colleges: 91
Here:
31.4%
New Jersey:
33.2%
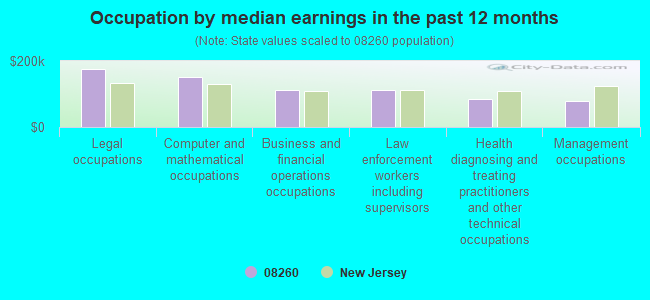
Occupation by median earnings in the past 12 months ($)
174,748Legal occupations
152,639Computer and mathematical occupations
113,364Business and financial operations occupations
111,924Law enforcement workers including supervisors
84,653Health diagnosing and treating practitioners and other technical occupations
79,525Management occupations
Companies with federal contracts located in this zip code:
CONAIR AVIATION ASSOCIATES (138 E RIO GRANDE AVE in WILDWOOD, NJ; small business) : $227,340 in 40 contractsfrom 2000 to 2006
Contracts for Packing and Gasket Materials, O-Ring, Water Distillation Equipment, Marine and Industrial, Guns, 75 mm through 125 mm by Defense Logistics Agency, Navy Signed by year:2000: $48,050; 2001: $0; 2002: $0; 2003: $0; 2004: $31,097; 2005: $93,492; 2006: $54,701.
Biggest contracts:
$48,050 with Defense Logistics Agency for Packing and Gasket Materials. Signed on 2000-11-28. Completion date: 2000-11-28.
$13,802 with Defense Logistics Agency for O-Ring. Signed on 2005-07-18. Completion date: 2005-10-16.
$8,546 with Defense Logistics Agency for Packing and Gasket Materials. Signed on 2005-05-23. Completion date: 2005-09-20.
$8,502 with Defense Logistics Agency for O-Ring. Signed on 2006-04-04. Completion date: 2006-07-29.
BOLERO CORPORATION (3320 ATLANTIC AVE in WILDWOOD, NJ; small business)
$45,064 with Army for Lodging - Hotel/Motel. Signed on 2006-03-20. Completion date: 2006-09-30.
HARRIS MINIATURE GOLF COURSES (141 W BURK AVE in WILDWOOD, NJ; small business)
$3,000 with Army for Engineering and Technical Services. Taking place in TX. Signed on 2002-09-26. Completion date: 2002-10-15.
Top industries in this zip code by the number of employees in 2005:
2002 - 2018 National Fire Incident Reporting System (NFIRS) incidents
Based on the data from the years 2002 - 2018 the average number of fires per year is 158. The highest number of fire incidents - 215 took place in 2008, and the least - 36 in 2003. The data has a rising trend.
When looking into fire subcategories, the most incidents belonged to: Structure Fires (64.9%), and Outside Fires (26.1%).
Fire incident types reported to NFIRS in Zip Code 08260


 Nearest zip codes: 08242, 08247, 08204, 08251, 08210, 08212.


 Based on the data from the years 2002 - 2018 the average number of fires per year is 158. The highest number of fire incidents - 215 took place in 2008, and the least - 36 in 2003. The data has a rising trend.
 When looking into fire subcategories, the most incidents belonged to: Structure Fires (64.9%), and Outside Fires (26.1%).