Estimated zip code population in 2022: 18,911
Zip code population in 2010: 17,352
Zip code population in 2000: 16,400
Houses and condos: 6,981
Renter-occupied apartments: 1,341
% of renters here:
20%State:
35%
March 2022 cost of living index in zip code 08361: 100.8
(near average, U.S. average is 100)
Land area: 30.3
sq. mi.
Water area: 0.2
sq. mi.
Population density: 623 people per square mile (low).
OSM Map
Google Map
MSN Map
OSM Map
General Map
Google Map
MSN Map
OSM Map
Google Map
MSN Map
OSM Map
Google Map
MSN Map
Please wait while loading the map...
Real estate property taxes paid for housing units in 2022:
This zip code:
2.1% ($5,821)New Jersey:
2.1% ($8,897)
Median real estate property taxes paid for housing units with mortgages in 2022: $5,969 (2.1%)
Median real estate property taxes paid for housing units with no mortgage in 2022: $5,553 (2.1%)
Profiles of local businesses
Business Search - 14 Million verified businesses
Males: 9,532 Females: 9,379
For population 25 years and over in 08361:
High school or higher: 86.4%Bachelor's degree or higher: 36.9%Graduate or professional degree: 16.0%Unemployed: 4.4%Mean travel time to work (commute): 22.3 minutes
For population 15 years and over in 08361:
Never married: 32.3%Now married: 50.9%Separated: 1.1%Widowed: 7.1%Divorced: 8.7%
Zip code 08361 compared to state average:
Median house value below state average. Foreign-born population percentage significantly below state average. Renting percentage below state average. House age below state average. 10,700 56.6% White 5,031 26.6% Hispanic or Latino 2,037 10.8% Black 630 3.3% Two or more races 510 2.7% Asian
Data:
Median household income ($)
Median household income (% change since 2000)
Household income diversity
Ratio of average income to average house value (%)
Ratio of average income to average rent
Median household income ($) - White
Median household income ($) - Black or African American
Median household income ($) - Asian
Median household income ($) - Hispanic or Latino
Median household income ($) - American Indian and Alaska Native
Median household income ($) - Multirace
Median household income ($) - Other Race
Median household income for houses/condos with a mortgage ($)
Median household income for apartments without a mortgage ($)
Races - White alone (%)
Races - White alone (% change since 2000)
Races - Black alone (%)
Races - Black alone (% change since 2000)
Races - American Indian alone (%)
Races - American Indian alone (% change since 2000)
Races - Asian alone (%)
Races - Asian alone (% change since 2000)
Races - Hispanic (%)
Races - Hispanic (% change since 2000)
Races - Native Hawaiian and Other Pacific Islander alone (%)
Races - Native Hawaiian and Other Pacific Islander alone (% change since 2000)
Races - Two or more races (%)
Races - Two or more races (% change since 2000)
Races - Other race alone (%)
Races - Other race alone (% change since 2000)
Racial diversity
Unemployment (%)
Unemployment (% change since 2000)
Unemployment (%) - White
Unemployment (%) - Black or African American
Unemployment (%) - Asian
Unemployment (%) - Hispanic or Latino
Unemployment (%) - American Indian and Alaska Native
Unemployment (%) - Multirace
Unemployment (%) - Other Race
Population density (people per square mile)
Population - Males (%)
Population - Females (%)
Population - Males (%) - White
Population - Males (%) - Black or African American
Population - Males (%) - Asian
Population - Males (%) - Hispanic or Latino
Population - Males (%) - American Indian and Alaska Native
Population - Males (%) - Multirace
Population - Males (%) - Other Race
Population - Females (%) - White
Population - Females (%) - Black or African American
Population - Females (%) - Asian
Population - Females (%) - Hispanic or Latino
Population - Females (%) - American Indian and Alaska Native
Population - Females (%) - Multirace
Population - Females (%) - Other Race
Coronavirus confirmed cases (Apr 27, 2024)
Deaths caused by coronavirus (Apr 27, 2024)
Coronavirus confirmed cases (per 100k population) (Apr 27, 2024)
Deaths caused by coronavirus (per 100k population) (Apr 27, 2024)
Daily increase in number of cases (Apr 27, 2024)
Weekly increase in number of cases (Apr 27, 2024)
Cases doubled (in days) (Apr 27, 2024)
Hospitalized patients (Apr 18, 2022)
Negative test results (Apr 18, 2022)
Total test results (Apr 18, 2022)
COVID Vaccine doses distributed (per 100k population) (Sep 19, 2023)
COVID Vaccine doses administered (per 100k population) (Sep 19, 2023)
COVID Vaccine doses distributed (Sep 19, 2023)
COVID Vaccine doses administered (Sep 19, 2023)
Likely homosexual households (%)
Likely homosexual households (% change since 2000)
Likely homosexual households - Lesbian couples (%)
Likely homosexual households - Lesbian couples (% change since 2000)
Likely homosexual households - Gay men (%)
Likely homosexual households - Gay men (% change since 2000)
Cost of living index
Median gross rent ($)
Median contract rent ($)
Median monthly housing costs ($)
Median house or condo value ($)
Median house or condo value ($ change since 2000)
Mean house or condo value by units in structure - 1, detached ($)
Mean house or condo value by units in structure - 1, attached ($)
Mean house or condo value by units in structure - 2 ($)
Mean house or condo value by units in structure by units in structure - 3 or 4 ($)
Mean house or condo value by units in structure - 5 or more ($)
Mean house or condo value by units in structure - Boat, RV, van, etc. ($)
Mean house or condo value by units in structure - Mobile home ($)
Median house or condo value ($) - White
Median house or condo value ($) - Black or African American
Median house or condo value ($) - Asian
Median house or condo value ($) - Hispanic or Latino
Median house or condo value ($) - American Indian and Alaska Native
Median house or condo value ($) - Multirace
Median house or condo value ($) - Other Race
Median resident age
Resident age diversity
Median resident age - Males
Median resident age - Females
Median resident age - White
Median resident age - Black or African American
Median resident age - Asian
Median resident age - Hispanic or Latino
Median resident age - American Indian and Alaska Native
Median resident age - Multirace
Median resident age - Other Race
Median resident age - Males - White
Median resident age - Males - Black or African American
Median resident age - Males - Asian
Median resident age - Males - Hispanic or Latino
Median resident age - Males - American Indian and Alaska Native
Median resident age - Males - Multirace
Median resident age - Males - Other Race
Median resident age - Females - White
Median resident age - Females - Black or African American
Median resident age - Females - Asian
Median resident age - Females - Hispanic or Latino
Median resident age - Females - American Indian and Alaska Native
Median resident age - Females - Multirace
Median resident age - Females - Other Race
Commute - mean travel time to work (minutes)
Travel time to work - Less than 5 minutes (%)
Travel time to work - Less than 5 minutes (% change since 2000)
Travel time to work - 5 to 9 minutes (%)
Travel time to work - 5 to 9 minutes (% change since 2000)
Travel time to work - 10 to 19 minutes (%)
Travel time to work - 10 to 19 minutes (% change since 2000)
Travel time to work - 20 to 29 minutes (%)
Travel time to work - 20 to 29 minutes (% change since 2000)
Travel time to work - 30 to 39 minutes (%)
Travel time to work - 30 to 39 minutes (% change since 2000)
Travel time to work - 40 to 59 minutes (%)
Travel time to work - 40 to 59 minutes (% change since 2000)
Travel time to work - 60 to 89 minutes (%)
Travel time to work - 60 to 89 minutes (% change since 2000)
Travel time to work - 90 or more minutes (%)
Travel time to work - 90 or more minutes (% change since 2000)
Marital status - Never married (%)
Marital status - Now married (%)
Marital status - Separated (%)
Marital status - Widowed (%)
Marital status - Divorced (%)
Median family income ($)
Median family income (% change since 2000)
Median non-family income ($)
Median non-family income (% change since 2000)
Median per capita income ($)
Median per capita income (% change since 2000)
Median family income ($) - White
Median family income ($) - Black or African American
Median family income ($) - Asian
Median family income ($) - Hispanic or Latino
Median family income ($) - American Indian and Alaska Native
Median family income ($) - Multirace
Median family income ($) - Other Race
Median year house/condo built
Median year apartment built
Year house built - Built 2005 or later (%)
Year house built - Built 2000 to 2004 (%)
Year house built - Built 1990 to 1999 (%)
Year house built - Built 1980 to 1989 (%)
Year house built - Built 1970 to 1979 (%)
Year house built - Built 1960 to 1969 (%)
Year house built - Built 1950 to 1959 (%)
Year house built - Built 1940 to 1949 (%)
Year house built - Built 1939 or earlier (%)
Average household size
Household density (households per square mile)
Average household size - White
Average household size - Black or African American
Average household size - Asian
Average household size - Hispanic or Latino
Average household size - American Indian and Alaska Native
Average household size - Multirace
Average household size - Other Race
Occupied housing units (%)
Vacant housing units (%)
Owner occupied housing units (%)
Renter occupied housing units (%)
Vacancy status - For rent (%)
Vacancy status - For sale only (%)
Vacancy status - Rented or sold, not occupied (%)
Vacancy status - For seasonal, recreational, or occasional use (%)
Vacancy status - For migrant workers (%)
Vacancy status - Other vacant (%)
Residents with income below the poverty level (%)
Residents with income below 50% of the poverty level (%)
Children below poverty level (%)
Poor families by family type - Married-couple family (%)
Poor families by family type - Male, no wife present (%)
Poor families by family type - Female, no husband present (%)
Poverty status for native-born residents (%)
Poverty status for foreign-born residents (%)
Poverty among high school graduates not in families (%)
Poverty among people who did not graduate high school not in families (%)
Residents with income below the poverty level (%) - White
Residents with income below the poverty level (%) - Black or African American
Residents with income below the poverty level (%) - Asian
Residents with income below the poverty level (%) - Hispanic or Latino
Residents with income below the poverty level (%) - American Indian and Alaska Native
Residents with income below the poverty level (%) - Multirace
Residents with income below the poverty level (%) - Other Race
Air pollution - Air Quality Index (AQI)
Air pollution - CO
Air pollution - NO2
Air pollution - SO2
Air pollution - Ozone
Air pollution - PM10
Air pollution - PM25
Air pollution - Pb
Crime - Murders per 100,000 population
Crime - Rapes per 100,000 population
Crime - Robberies per 100,000 population
Crime - Assaults per 100,000 population
Crime - Burglaries per 100,000 population
Crime - Thefts per 100,000 population
Crime - Auto thefts per 100,000 population
Crime - Arson per 100,000 population
Crime - City-data.com crime index
Crime - Violent crime index
Crime - Property crime index
Crime - Murders per 100,000 population (5 year average)
Crime - Rapes per 100,000 population (5 year average)
Crime - Robberies per 100,000 population (5 year average)
Crime - Assaults per 100,000 population (5 year average)
Crime - Burglaries per 100,000 population (5 year average)
Crime - Thefts per 100,000 population (5 year average)
Crime - Auto thefts per 100,000 population (5 year average)
Crime - Arson per 100,000 population (5 year average)
Crime - City-data.com crime index (5 year average)
Crime - Violent crime index (5 year average)
Crime - Property crime index (5 year average)
1996 Presidential Elections Results (%) - Democratic Party (Clinton)
1996 Presidential Elections Results (%) - Republican Party (Dole)
1996 Presidential Elections Results (%) - Other
2000 Presidential Elections Results (%) - Democratic Party (Gore)
2000 Presidential Elections Results (%) - Republican Party (Bush)
2000 Presidential Elections Results (%) - Other
2004 Presidential Elections Results (%) - Democratic Party (Kerry)
2004 Presidential Elections Results (%) - Republican Party (Bush)
2004 Presidential Elections Results (%) - Other
2008 Presidential Elections Results (%) - Democratic Party (Obama)
2008 Presidential Elections Results (%) - Republican Party (McCain)
2008 Presidential Elections Results (%) - Other
2012 Presidential Elections Results (%) - Democratic Party (Obama)
2012 Presidential Elections Results (%) - Republican Party (Romney)
2012 Presidential Elections Results (%) - Other
2016 Presidential Elections Results (%) - Democratic Party (Clinton)
2016 Presidential Elections Results (%) - Republican Party (Trump)
2016 Presidential Elections Results (%) - Other
2020 Presidential Elections Results (%) - Democratic Party (Biden)
2020 Presidential Elections Results (%) - Republican Party (Trump)
2020 Presidential Elections Results (%) - Other
Ancestries Reported - Arab (%)
Ancestries Reported - Czech (%)
Ancestries Reported - Danish (%)
Ancestries Reported - Dutch (%)
Ancestries Reported - English (%)
Ancestries Reported - French (%)
Ancestries Reported - French Canadian (%)
Ancestries Reported - German (%)
Ancestries Reported - Greek (%)
Ancestries Reported - Hungarian (%)
Ancestries Reported - Irish (%)
Ancestries Reported - Italian (%)
Ancestries Reported - Lithuanian (%)
Ancestries Reported - Norwegian (%)
Ancestries Reported - Polish (%)
Ancestries Reported - Portuguese (%)
Ancestries Reported - Russian (%)
Ancestries Reported - Scotch-Irish (%)
Ancestries Reported - Scottish (%)
Ancestries Reported - Slovak (%)
Ancestries Reported - Subsaharan African (%)
Ancestries Reported - Swedish (%)
Ancestries Reported - Swiss (%)
Ancestries Reported - Ukrainian (%)
Ancestries Reported - United States (%)
Ancestries Reported - Welsh (%)
Ancestries Reported - West Indian (%)
Ancestries Reported - Other (%)
Educational Attainment - No schooling completed (%)
Educational Attainment - Less than high school (%)
Educational Attainment - High school or equivalent (%)
Educational Attainment - Less than 1 year of college (%)
Educational Attainment - 1 or more years of college (%)
Educational Attainment - Associate degree (%)
Educational Attainment - Bachelor's degree (%)
Educational Attainment - Master's degree (%)
Educational Attainment - Professional school degree (%)
Educational Attainment - Doctorate degree (%)
School Enrollment - Nursery, preschool (%)
School Enrollment - Kindergarten (%)
School Enrollment - Grade 1 to 4 (%)
School Enrollment - Grade 5 to 8 (%)
School Enrollment - Grade 9 to 12 (%)
School Enrollment - College undergrad (%)
School Enrollment - Graduate or professional (%)
School Enrollment - Not enrolled in school (%)
School enrollment - Public schools (%)
School enrollment - Private schools (%)
School enrollment - Not enrolled (%)
Median number of rooms in houses and condos
Median number of rooms in apartments
Housing units lacking complete plumbing facilities (%)
Housing units lacking complete kitchen facilities (%)
Density of houses
Urban houses (%)
Rural houses (%)
Households with people 60 years and over (%)
Households with people 65 years and over (%)
Households with people 75 years and over (%)
Households with one or more nonrelatives (%)
Households with no nonrelatives (%)
Population in households (%)
Family households (%)
Nonfamily households (%)
Population in families (%)
Family households with own children (%)
Median number of bedrooms in owner occupied houses
Mean number of bedrooms in owner occupied houses
Median number of bedrooms in renter occupied houses
Mean number of bedrooms in renter occupied houses
Median number of vehichles in owner occupied houses
Mean number of vehichles in owner occupied houses
Median number of vehichles in renter occupied houses
Mean number of vehichles in renter occupied houses
Mortgage status - with mortgage (%)
Mortgage status - with second mortgage (%)
Mortgage status - with home equity loan (%)
Mortgage status - with both second mortgage and home equity loan (%)
Mortgage status - without a mortgage (%)
Average family size
Average family size - White
Average family size - Black or African American
Average family size - Asian
Average family size - Hispanic or Latino
Average family size - American Indian and Alaska Native
Average family size - Multirace
Average family size - Other Race
Geographical mobility - Same house 1 year ago (%)
Geographical mobility - Moved within same county (%)
Geographical mobility - Moved from different county within same state (%)
Geographical mobility - Moved from different state (%)
Geographical mobility - Moved from abroad (%)
Place of birth - Born in state of residence (%)
Place of birth - Born in other state (%)
Place of birth - Native, outside of US (%)
Place of birth - Foreign born (%)
Housing units in structures - 1, detached (%)
Housing units in structures - 1, attached (%)
Housing units in structures - 2 (%)
Housing units in structures - 3 or 4 (%)
Housing units in structures - 5 to 9 (%)
Housing units in structures - 10 to 19 (%)
Housing units in structures - 20 to 49 (%)
Housing units in structures - 50 or more (%)
Housing units in structures - Mobile home (%)
Housing units in structures - Boat, RV, van, etc. (%)
House/condo owner moved in on average (years ago)
Renter moved in on average (years ago)
Year householder moved into unit - Moved in 1999 to March 2000 (%)
Year householder moved into unit - Moved in 1995 to 1998 (%)
Year householder moved into unit - Moved in 1990 to 1994 (%)
Year householder moved into unit - Moved in 1980 to 1989 (%)
Year householder moved into unit - Moved in 1970 to 1979 (%)
Year householder moved into unit - Moved in 1969 or earlier (%)
Means of transportation to work - Drove car alone (%)
Means of transportation to work - Carpooled (%)
Means of transportation to work - Public transportation (%)
Means of transportation to work - Bus or trolley bus (%)
Means of transportation to work - Streetcar or trolley car (%)
Means of transportation to work - Subway or elevated (%)
Means of transportation to work - Railroad (%)
Means of transportation to work - Ferryboat (%)
Means of transportation to work - Taxicab (%)
Means of transportation to work - Motorcycle (%)
Means of transportation to work - Bicycle (%)
Means of transportation to work - Walked (%)
Means of transportation to work - Other means (%)
Working at home (%)
Industry diversity
Most Common Industries - Agriculture, forestry, fishing and hunting, and mining (%)
Most Common Industries - Agriculture, forestry, fishing and hunting (%)
Most Common Industries - Mining, quarrying, and oil and gas extraction (%)
Most Common Industries - Construction (%)
Most Common Industries - Manufacturing (%)
Most Common Industries - Wholesale trade (%)
Most Common Industries - Retail trade (%)
Most Common Industries - Transportation and warehousing, and utilities (%)
Most Common Industries - Transportation and warehousing (%)
Most Common Industries - Utilities (%)
Most Common Industries - Information (%)
Most Common Industries - Finance and insurance, and real estate and rental and leasing (%)
Most Common Industries - Finance and insurance (%)
Most Common Industries - Real estate and rental and leasing (%)
Most Common Industries - Professional, scientific, and management, and administrative and waste management services (%)
Most Common Industries - Professional, scientific, and technical services (%)
Most Common Industries - Management of companies and enterprises (%)
Most Common Industries - Administrative and support and waste management services (%)
Most Common Industries - Educational services, and health care and social assistance (%)
Most Common Industries - Educational services (%)
Most Common Industries - Health care and social assistance (%)
Most Common Industries - Arts, entertainment, and recreation, and accommodation and food services (%)
Most Common Industries - Arts, entertainment, and recreation (%)
Most Common Industries - Accommodation and food services (%)
Most Common Industries - Other services, except public administration (%)
Most Common Industries - Public administration (%)
Occupation diversity
Most Common Occupations - Management, business, science, and arts occupations (%)
Most Common Occupations - Management, business, and financial occupations (%)
Most Common Occupations - Management occupations (%)
Most Common Occupations - Business and financial operations occupations (%)
Most Common Occupations - Computer, engineering, and science occupations (%)
Most Common Occupations - Computer and mathematical occupations (%)
Most Common Occupations - Architecture and engineering occupations (%)
Most Common Occupations - Life, physical, and social science occupations (%)
Most Common Occupations - Education, legal, community service, arts, and media occupations (%)
Most Common Occupations - Community and social service occupations (%)
Most Common Occupations - Legal occupations (%)
Most Common Occupations - Education, training, and library occupations (%)
Most Common Occupations - Arts, design, entertainment, sports, and media occupations (%)
Most Common Occupations - Healthcare practitioners and technical occupations (%)
Most Common Occupations - Health diagnosing and treating practitioners and other technical occupations (%)
Most Common Occupations - Health technologists and technicians (%)
Most Common Occupations - Service occupations (%)
Most Common Occupations - Healthcare support occupations (%)
Most Common Occupations - Protective service occupations (%)
Most Common Occupations - Fire fighting and prevention, and other protective service workers including supervisors (%)
Most Common Occupations - Law enforcement workers including supervisors (%)
Most Common Occupations - Food preparation and serving related occupations (%)
Most Common Occupations - Building and grounds cleaning and maintenance occupations (%)
Most Common Occupations - Personal care and service occupations (%)
Most Common Occupations - Sales and office occupations (%)
Most Common Occupations - Sales and related occupations (%)
Most Common Occupations - Office and administrative support occupations (%)
Most Common Occupations - Natural resources, construction, and maintenance occupations (%)
Most Common Occupations - Farming, fishing, and forestry occupations (%)
Most Common Occupations - Construction and extraction occupations (%)
Most Common Occupations - Installation, maintenance, and repair occupations (%)
Most Common Occupations - Production, transportation, and material moving occupations (%)
Most Common Occupations - Production occupations (%)
Most Common Occupations - Transportation occupations (%)
Most Common Occupations - Material moving occupations (%)
People in Group quarters - Institutionalized population (%)
People in Group quarters - Correctional institutions (%)
People in Group quarters - Federal prisons and detention centers (%)
People in Group quarters - Halfway houses (%)
People in Group quarters - Local jails and other confinement facilities (including police lockups) (%)
People in Group quarters - Military disciplinary barracks (%)
People in Group quarters - State prisons (%)
People in Group quarters - Other types of correctional institutions (%)
People in Group quarters - Nursing homes (%)
People in Group quarters - Hospitals/wards, hospices, and schools for the handicapped (%)
People in Group quarters - Hospitals/wards and hospices for chronically ill (%)
People in Group quarters - Hospices or homes for chronically ill (%)
People in Group quarters - Military hospitals or wards for chronically ill (%)
People in Group quarters - Other hospitals or wards for chronically ill (%)
People in Group quarters - Hospitals or wards for drug/alcohol abuse (%)
People in Group quarters - Mental (Psychiatric) hospitals or wards (%)
People in Group quarters - Schools, hospitals, or wards for the mentally retarded (%)
People in Group quarters - Schools, hospitals, or wards for the physically handicapped (%)
People in Group quarters - Institutions for the deaf (%)
People in Group quarters - Institutions for the blind (%)
People in Group quarters - Orthopedic wards and institutions for the physically handicapped (%)
People in Group quarters - Wards in general hospitals for patients who have no usual home elsewhere (%)
People in Group quarters - Wards in military hospitals for patients who have no usual home elsewhere (%)
People in Group quarters - Juvenile institutions (%)
People in Group quarters - Long-term care (%)
People in Group quarters - Homes for abused, dependent, and neglected children (%)
People in Group quarters - Residential treatment centers for emotionally disturbed children (%)
People in Group quarters - Training schools for juvenile delinquents (%)
People in Group quarters - Short-term care, detention or diagnostic centers for delinquent children (%)
People in Group quarters - Type of juvenile institution unknown (%)
People in Group quarters - Noninstitutionalized population (%)
People in Group quarters - College dormitories (includes college quarters off campus) (%)
People in Group quarters - Military quarters (%)
People in Group quarters - On base (%)
People in Group quarters - Barracks, unaccompanied personnel housing (UPH), (Enlisted/Officer), ;and similar group living quarters for military personnel (%)
People in Group quarters - Transient quarters for temporary residents (%)
People in Group quarters - Military ships (%)
People in Group quarters - Group homes (%)
People in Group quarters - Homes or halfway houses for drug/alcohol abuse (%)
People in Group quarters - Homes for the mentally ill (%)
People in Group quarters - Homes for the mentally retarded (%)
People in Group quarters - Homes for the physically handicapped (%)
People in Group quarters - Other group homes (%)
People in Group quarters - Religious group quarters (%)
People in Group quarters - Dormitories (%)
People in Group quarters - Agriculture workers' dormitories on farms (%)
People in Group quarters - Job Corps and vocational training facilities (%)
People in Group quarters - Other workers' dormitories (%)
People in Group quarters - Crews of maritime vessels (%)
People in Group quarters - Other nonhousehold living situations (%)
People in Group quarters - Other noninstitutional group quarters (%)
Residents speaking English at home (%)
Residents speaking English at home - Born in the United States (%)
Residents speaking English at home - Native, born elsewhere (%)
Residents speaking English at home - Foreign born (%)
Residents speaking Spanish at home (%)
Residents speaking Spanish at home - Born in the United States (%)
Residents speaking Spanish at home - Native, born elsewhere (%)
Residents speaking Spanish at home - Foreign born (%)
Residents speaking other language at home (%)
Residents speaking other language at home - Born in the United States (%)
Residents speaking other language at home - Native, born elsewhere (%)
Residents speaking other language at home - Foreign born (%)
Class of Workers - Employee of private company (%)
Class of Workers - Self-employed in own incorporated business (%)
Class of Workers - Private not-for-profit wage and salary workers (%)
Class of Workers - Local government workers (%)
Class of Workers - State government workers (%)
Class of Workers - Federal government workers (%)
Class of Workers - Self-employed workers in own not incorporated business and Unpaid family workers (%)
House heating fuel used in houses and condos - Utility gas (%)
House heating fuel used in houses and condos - Bottled, tank, or LP gas (%)
House heating fuel used in houses and condos - Electricity (%)
House heating fuel used in houses and condos - Fuel oil, kerosene, etc. (%)
House heating fuel used in houses and condos - Coal or coke (%)
House heating fuel used in houses and condos - Wood (%)
House heating fuel used in houses and condos - Solar energy (%)
House heating fuel used in houses and condos - Other fuel (%)
House heating fuel used in houses and condos - No fuel used (%)
House heating fuel used in apartments - Utility gas (%)
House heating fuel used in apartments - Bottled, tank, or LP gas (%)
House heating fuel used in apartments - Electricity (%)
House heating fuel used in apartments - Fuel oil, kerosene, etc. (%)
House heating fuel used in apartments - Coal or coke (%)
House heating fuel used in apartments - Wood (%)
House heating fuel used in apartments - Solar energy (%)
House heating fuel used in apartments - Other fuel (%)
House heating fuel used in apartments - No fuel used (%)
Armed forces status - In Armed Forces (%)
Armed forces status - Civilian (%)
Armed forces status - Civilian - Veteran (%)
Armed forces status - Civilian - Nonveteran (%)
Fatal accidents locations in years 2005-2021
Fatal accidents locations in 2005
Fatal accidents locations in 2006
Fatal accidents locations in 2007
Fatal accidents locations in 2008
Fatal accidents locations in 2009
Fatal accidents locations in 2010
Fatal accidents locations in 2011
Fatal accidents locations in 2012
Fatal accidents locations in 2013
Fatal accidents locations in 2014
Fatal accidents locations in 2015
Fatal accidents locations in 2016
Fatal accidents locations in 2017
Fatal accidents locations in 2018
Fatal accidents locations in 2019
Fatal accidents locations in 2020
Fatal accidents locations in 2021
Alcohol use - People drinking some alcohol every month (%)
Alcohol use - People not drinking at all (%)
Alcohol use - Average days/month drinking alcohol
Alcohol use - Average drinks/week
Alcohol use - Average days/year people drink much
Audiometry - Average condition of hearing (%)
Audiometry - People that can hear a whisper from across a quiet room (%)
Audiometry - People that can hear normal voice from across a quiet room (%)
Audiometry - Ears ringing, roaring, buzzing (%)
Audiometry - Had a job exposure to loud noise (%)
Audiometry - Had off-work exposure to loud noise (%)
Blood Pressure & Cholesterol - Has high blood pressure (%)
Blood Pressure & Cholesterol - Checking blood pressure at home (%)
Blood Pressure & Cholesterol - Frequently checking blood cholesterol (%)
Blood Pressure & Cholesterol - Has high cholesterol level (%)
Consumer Behavior - Money monthly spent on food at supermarket/grocery store
Consumer Behavior - Money monthly spent on food at other stores
Consumer Behavior - Money monthly spent on eating out
Consumer Behavior - Money monthly spent on carryout/delivered foods
Consumer Behavior - Income spent on food at supermarket/grocery store (%)
Consumer Behavior - Income spent on food at other stores (%)
Consumer Behavior - Income spent on eating out (%)
Consumer Behavior - Income spent on carryout/delivered foods (%)
Current Health Status - General health condition (%)
Current Health Status - Blood donors (%)
Current Health Status - Has blood ever tested for HIV virus (%)
Current Health Status - Left-handed people (%)
Dermatology - People using sunscreen (%)
Diabetes - Diabetics (%)
Diabetes - Had a blood test for high blood sugar (%)
Diabetes - People taking insulin (%)
Diet Behavior & Nutrition - Diet health (%)
Diet Behavior & Nutrition - Milk product consumption (# of products/month)
Diet Behavior & Nutrition - Meals not home prepared (#/week)
Diet Behavior & Nutrition - Meals from fast food or pizza place (#/week)
Diet Behavior & Nutrition - Ready-to-eat foods (#/month)
Diet Behavior & Nutrition - Frozen meals/pizza (#/month)
Drug Use - People that ever used marijuana or hashish (%)
Drug Use - Ever used hard drugs (%)
Drug Use - Ever used any form of cocaine (%)
Drug Use - Ever used heroin (%)
Drug Use - Ever used methamphetamine (%)
Health Insurance - People covered by health insurance (%)
Kidney Conditions-Urology - Avg. # of times urinating at night
Medical Conditions - People with asthma (%)
Medical Conditions - People with anemia (%)
Medical Conditions - People with psoriasis (%)
Medical Conditions - People with overweight (%)
Medical Conditions - Elderly people having difficulties in thinking or remembering (%)
Medical Conditions - People who ever received blood transfusion (%)
Medical Conditions - People having trouble seeing even with glass/contacts (%)
Medical Conditions - People with arthritis (%)
Medical Conditions - People with gout (%)
Medical Conditions - People with congestive heart failure (%)
Medical Conditions - People with coronary heart disease (%)
Medical Conditions - People with angina pectoris (%)
Medical Conditions - People who ever had heart attack (%)
Medical Conditions - People who ever had stroke (%)
Medical Conditions - People with emphysema (%)
Medical Conditions - People with thyroid problem (%)
Medical Conditions - People with chronic bronchitis (%)
Medical Conditions - People with any liver condition (%)
Medical Conditions - People who ever had cancer or malignancy (%)
Mental Health - People who have little interest in doing things (%)
Mental Health - People feeling down, depressed, or hopeless (%)
Mental Health - People who have trouble sleeping or sleeping too much (%)
Mental Health - People feeling tired or having little energy (%)
Mental Health - People with poor appetite or overeating (%)
Mental Health - People feeling bad about themself (%)
Mental Health - People who have trouble concentrating on things (%)
Mental Health - People moving or speaking slowly or too fast (%)
Mental Health - People having thoughts they would be better off dead (%)
Oral Health - Average years since last visit a dentist
Oral Health - People embarrassed because of mouth (%)
Oral Health - People with gum disease (%)
Oral Health - General health of teeth and gums (%)
Oral Health - Average days a week using dental floss/device
Oral Health - Average days a week using mouthwash for dental problem
Oral Health - Average number of teeth
Pesticide Use - Households using pesticides to control insects (%)
Pesticide Use - Households using pesticides to kill weeds (%)
Physical Activity - People doing vigorous-intensity work activities (%)
Physical Activity - People doing moderate-intensity work activities (%)
Physical Activity - People walking or bicycling (%)
Physical Activity - People doing vigorous-intensity recreational activities (%)
Physical Activity - People doing moderate-intensity recreational activities (%)
Physical Activity - Average hours a day doing sedentary activities
Physical Activity - Average hours a day watching TV or videos
Physical Activity - Average hours a day using computer
Physical Functioning - People having limitations keeping them from working (%)
Physical Functioning - People limited in amount of work they can do (%)
Physical Functioning - People that need special equipment to walk (%)
Physical Functioning - People experiencing confusion/memory problems (%)
Physical Functioning - People requiring special healthcare equipment (%)
Prescription Medications - Average number of prescription medicines taking
Preventive Aspirin Use - Adults 40+ taking low-dose aspirin (%)
Reproductive Health - Vaginal deliveries (%)
Reproductive Health - Cesarean deliveries (%)
Reproductive Health - Deliveries resulted in a live birth (%)
Reproductive Health - Pregnancies resulted in a delivery (%)
Reproductive Health - Women breastfeeding newborns (%)
Reproductive Health - Women that had a hysterectomy (%)
Reproductive Health - Women that had both ovaries removed (%)
Reproductive Health - Women that have ever taken birth control pills (%)
Reproductive Health - Women taking birth control pills (%)
Reproductive Health - Women that have ever used Depo-Provera or injectables (%)
Reproductive Health - Women that have ever used female hormones (%)
Sexual Behavior - People 18+ that ever had sex (vaginal, anal, or oral) (%)
Sexual Behavior - Males 18+ that ever had vaginal sex with a woman (%)
Sexual Behavior - Males 18+ that ever performed oral sex on a woman (%)
Sexual Behavior - Males 18+ that ever had anal sex with a woman (%)
Sexual Behavior - Males 18+ that ever had any sex with a man (%)
Sexual Behavior - Females 18+ that ever had vaginal sex with a man (%)
Sexual Behavior - Females 18+ that ever performed oral sex on a man (%)
Sexual Behavior - Females 18+ that ever had anal sex with a man (%)
Sexual Behavior - Females 18+ that ever had any kind of sex with a woman (%)
Sexual Behavior - Average age people first had sex
Sexual Behavior - Average number of female sex partners in lifetime (males 18+)
Sexual Behavior - Average number of female vaginal sex partners in lifetime (males 18+)
Sexual Behavior - Average age people first performed oral sex on a woman (18+)
Sexual Behavior - Average number of woman performed oral sex on in lifetime (18+)
Sexual Behavior - Average number of male sex partners in lifetime (males 18+)
Sexual Behavior - Average number of male anal sex partners in lifetime (males 18+)
Sexual Behavior - Average age people first performed oral sex on a man (18+)
Sexual Behavior - Average number of male oral sex partners in lifetime (18+)
Sexual Behavior - People using protection when performing oral sex (%)
Sexual Behavior - Average number of times people have vaginal or anal sex a year
Sexual Behavior - People having sex without condom (%)
Sexual Behavior - Average number of male sex partners in lifetime (females 18+)
Sexual Behavior - Average number of male vaginal sex partners in lifetime (females 18+)
Sexual Behavior - Average number of female sex partners in lifetime (females 18+)
Sexual Behavior - Circumcised males 18+ (%)
Sleep Disorders - Average hours sleeping at night
Sleep Disorders - People that has trouble sleeping (%)
Smoking-Cigarette Use - People smoking cigarettes (%)
Taste & Smell - People 40+ having problems with smell (%)
Taste & Smell - People 40+ having problems with taste (%)
Taste & Smell - People 40+ that ever had wisdom teeth removed (%)
Taste & Smell - People 40+ that ever had tonsils teeth removed (%)
Taste & Smell - People 40+ that ever had a loss of consciousness because of a head injury (%)
Taste & Smell - People 40+ that ever had a broken nose or other serious injury to face or skull (%)
Taste & Smell - People 40+ that ever had two or more sinus infections (%)
Weight - Average height (inches)
Weight - Average weight (pounds)
Weight - Average BMI
Weight - People that are obese (%)
Weight - People that ever were obese (%)
Weight - People trying to lose weight (%)
Urban population: 16,910
Rural population: 2,000
Estimated median house/condo value in 2022: $278,026
08361:
$278,026New Jersey:
$428,900
According to our research of New Jersey and other state lists, there were 10 registered sex offenders living in 08361 zip code as of April 27, 2024 . The ratio of all residents to sex offenders in zip code 08361 is 1,830 to 1.The ratio of registered sex offenders to all residents in this zip code is near the state average.
Median resident age: This zip code:
44.3 yearsNew Jersey median age:
40.4 years
Average household size: This zip code:
2.7 peopleNew Jersey:
2.6 people
Averages for the 2020 tax year for zip code 08361, filed in 2021:
Average Adjusted Gross Income (AGI) in 2020: $82,184 (Individual Income Tax Returns) Here:
$82,184State:
$95,247
Salary/wage: $59,705 (reported on 81.4% of returns )Here:
$59,705State:
$80,635
(% of AGI for various income ranges: 1239.9% for AGIs below $25k , 3620.6% for AGIs $25k-50k , 6316.1% for AGIs $50k-75k , 9773.9% for AGIs $75k-100k , 17499.5% for AGIs $100k-200k , 81858.9% for AGIs over 200k ) Taxable interest for individuals: $1,614 (reported on 31.8% of returns )This zip code:
$1,614New Jersey:
$2,414
(% of AGI for various income ranges: 22.3% for AGIs below $25k , 16.1% for AGIs $25k-50k , 58.2% for AGIs $50k-75k , 79.6% for AGIs $75k-100k , 157.0% for AGIs $100k-200k , 1676.7% for AGIs over 200k ) Ordinary dividends: $6,547 (reported on 22.2% of returns )(% of AGI for various income ranges: 42.1% for AGIs below $25k , 37.0% for AGIs $25k-50k , 116.5% for AGIs $50k-75k , 233.7% for AGIs $75k-100k , 395.9% for AGIs $100k-200k , 6275.6% for AGIs over 200k ) Net capital gain/loss in AGI: +$21,675 (reported on 19.2% of returns )Here:
+$21,675State:
+$25,022
(% of AGI for various income ranges: 9.9% for AGIs below $25k , 29.6% for AGIs $25k-50k , 86.6% for AGIs $50k-75k , 156.1% for AGIs $75k-100k , 556.8% for AGIs $100k-200k , 33955.6% for AGIs over 200k ) Profit/loss from business: +$18,424 (reported on 13.0% of returns )Here:
+$18,424State:
+$18,035
(% of AGI for various income ranges: 64.2% for AGIs below $25k , 90.9% for AGIs $25k-50k , 161.0% for AGIs $50k-75k , 317.6% for AGIs $75k-100k , 342.2% for AGIs $100k-200k , 13963.3% for AGIs over 200k ) Taxable individual retirement arrangement distribution: $15,310 (reported on 9.6% of returns )08361:
$15,310New Jersey:
$21,558
(% of AGI for various income ranges: 73.4% for AGIs below $25k , 68.1% for AGIs $25k-50k , 198.6% for AGIs $50k-75k , 304.0% for AGIs $75k-100k , 533.8% for AGIs $100k-200k , 2457.8% for AGIs over 200k ) Self-employed (Keogh) retirement plans: $29,020 (reported on 0.5% of returns )08361:
$29,020New Jersey:
$30,844
(% of AGI for various income ranges: 50.9% for AGIs $75k-100k , 1233.3% for AGIs over 200k ) Total itemized deductions: $30,764 (reported on 10.8% of returns )Here:
$30,764State:
$32,863
(% of AGI for various income ranges: 88.5% for AGIs below $25k , 162.8% for AGIs $25k-50k , 454.6% for AGIs $50k-75k , 666.0% for AGIs $75k-100k , 933.2% for AGIs $100k-200k , 9603.3% for AGIs over 200k ) Charity contributions: $9,566 (reported on 8.7% of returns )(% of AGI for various income ranges: 5.9% for AGIs below $25k , 19.3% for AGIs $25k-50k , 68.3% for AGIs $50k-75k , 94.9% for AGIs $75k-100k , 222.9% for AGIs $100k-200k , 4215.6% for AGIs over 200k ) Taxes paid: $8,309 (reported on 10.8% of returns )(% of AGI for various income ranges: 22.8% for AGIs below $25k , 46.9% for AGIs $25k-50k , 148.1% for AGIs $50k-75k , 237.2% for AGIs $75k-100k , 301.2% for AGIs $100k-200k , 1318.9% for AGIs over 200k ) Earned income credit: $2,033 (reported on 11.0% of returns )(% of AGI for various income ranges: 65.6% for AGIs below $25k , 64.8% for AGIs $25k-50k ) Percentage of individuals using paid preparers for their 2020 taxes: 93.9%(% for various income ranges: 92.9% for AGIs below $25k , 93.5% for AGIs $25k-50k , 94.3% for AGIs $50k-75k , 93.5% for AGIs $75k-100k , 95.2% for AGIs $100k-200k , 97.4% for AGIs over 200k )
Averages for the 2012 tax year for zip code 08361, filed in 2013:
Average Adjusted Gross Income (AGI) in 2012: $68,789 (Individual Income Tax Returns) Here:
$68,789State:
$79,688
Salary/wage: $53,382 (reported on 83.1% of returns )Here:
$53,382State:
$68,122
(% of AGI for various income ranges: 69.2% for AGIs below $25k , 75.9% for AGIs $25k-50k , 72.4% for AGIs $50k-75k , 72.6% for AGIs $75k-100k , 74.8% for AGIs $100k-200k , 35.4% for AGIs over 200k ) Taxable interest for individuals: $1,832 (reported on 42.7% of returns )This zip code:
$1,832New Jersey:
$2,193
(% of AGI for various income ranges: 1.6% for AGIs below $25k , 1.1% for AGIs $25k-50k , 1.0% for AGIs $50k-75k , 1.1% for AGIs $75k-100k , 0.8% for AGIs $100k-200k , 1.6% for AGIs over 200k ) Ordinary dividends: $4,759 (reported on 26.1% of returns )(% of AGI for various income ranges: 2.1% for AGIs below $25k , 1.3% for AGIs $25k-50k , 1.7% for AGIs $50k-75k , 1.4% for AGIs $75k-100k , 1.9% for AGIs $100k-200k , 2.2% for AGIs over 200k ) Net capital gain/loss in AGI: +$6,438 (reported on 18.4% of returns )Here:
+$6,438State:
+$15,358
(% of AGI for various income ranges: 0.3% for AGIs $50k-75k , 0.8% for AGIs $75k-100k , 1.0% for AGIs $100k-200k , 5.3% for AGIs over 200k ) Profit/loss from business: +$20,076 (reported on 12.2% of returns )Here:
+$20,076State:
+$19,577
(% of AGI for various income ranges: 4.8% for AGIs below $25k , 2.6% for AGIs $25k-50k , 1.8% for AGIs $50k-75k , 2.0% for AGIs $75k-100k , 2.2% for AGIs $100k-200k , 7.3% for AGIs over 200k ) Taxable individual retirement arrangement distribution: $14,391 (reported on 11.0% of returns )08361:
$14,391New Jersey:
$18,214
(% of AGI for various income ranges: 3.5% for AGIs below $25k , 2.2% for AGIs $25k-50k , 2.1% for AGIs $50k-75k , 2.5% for AGIs $75k-100k , 2.4% for AGIs $100k-200k , 1.9% for AGIs over 200k ) Self-employment retirement plans: $23,200 (reported on 0.7% of returns )08361:
$23,200New Jersey:
$24,511
Total itemized deductions: $23,048 (20% of AGI, reported on 43.5% of returns )Here:
$23,048State:
$30,827
Here:
20.0% of AGIState:
21.2% of AGI
(% of AGI for various income ranges: 12.0% for AGIs below $25k , 13.2% for AGIs $25k-50k , 16.5% for AGIs $50k-75k , 15.9% for AGIs $75k-100k , 16.7% for AGIs $100k-200k , 11.3% for AGIs over 200k ) Charity contributions: $2,959 (reported on 36.7% of returns )(% of AGI for various income ranges: 0.8% for AGIs below $25k , 1.3% for AGIs $25k-50k , 1.6% for AGIs $50k-75k , 1.7% for AGIs $75k-100k , 2.0% for AGIs $100k-200k , 1.3% for AGIs over 200k ) Taxes paid: $10,266 (reported on 43.4% of returns )08361:
$10,266State:
$15,801
(% of AGI for various income ranges: 3.7% for AGIs below $25k , 4.2% for AGIs $25k-50k , 5.8% for AGIs $50k-75k , 6.5% for AGIs $75k-100k , 7.6% for AGIs $100k-200k , 7.2% for AGIs over 200k ) Earned income credit: $2,184 (reported on 12.1% of returns )(% of AGI for various income ranges: 5.1% for AGIs below $25k , 0.8% for AGIs $25k-50k ) Percentage of individuals using paid preparers for their 2012 taxes: 65.9%(% for various income ranges: 59.5% for AGIs below $25k , 62.0% for AGIs $25k-50k , 67.9% for AGIs $50k-75k , 71.9% for AGIs $75k-100k , 74.2% for AGIs $100k-200k , 85.2% for AGIs over 200k )
Averages for the 2004 tax year for zip code 08361, filed in 2005:
Average Adjusted Gross Income (AGI) in 2004: $56,673 (Individual Income Tax Returns) Here:
$56,673State:
$64,921
Salary/wage: $47,859 (reported on 85.0% of returns )Here:
$47,859State:
$57,755
(% of AGI for various income ranges: 105.9% for AGIs below $10k , 72.2% for AGIs $10k-25k , 79.8% for AGIs $25k-50k , 80.8% for AGIs $50k-75k , 82.3% for AGIs $75k-100k , 61.2% for AGIs over 100k ) Taxable interest for individuals: $1,852 (reported on 56.9% of returns )This zip code:
$1,852New Jersey:
$2,068
(% of AGI for various income ranges: 8.6% for AGIs below $10k , 3.2% for AGIs $10k-25k , 1.8% for AGIs $25k-50k , 1.2% for AGIs $50k-75k , 0.9% for AGIs $75k-100k , 2.2% for AGIs over 100k ) Taxable dividends: $3,719 (reported on 32.2% of returns )(% of AGI for various income ranges: 7.3% for AGIs below $10k , 2.5% for AGIs $10k-25k , 1.5% for AGIs $25k-50k , 1.1% for AGIs $50k-75k , 1.4% for AGIs $75k-100k , 2.7% for AGIs over 100k ) Net capital gain/loss: +$6,497 (reported on 24.7% of returns )Here:
+$6,497State:
+$13,591
(% of AGI for various income ranges: -2.7% for AGIs below $10k , -0.1% for AGIs $10k-25k , 0.4% for AGIs $25k-50k , 0.9% for AGIs $50k-75k , 1.2% for AGIs $75k-100k , 5.4% for AGIs over 100k ) Profit/loss from business: +$16,633 (reported on 12.4% of returns )Here:
+$16,633State:
+$17,520
(% of AGI for various income ranges: 1.8% for AGIs below $10k , 4.5% for AGIs $10k-25k , 2.9% for AGIs $25k-50k , 2.9% for AGIs $50k-75k , 3.0% for AGIs $75k-100k , 4.4% for AGIs over 100k ) Profit/loss from farming: +$9,140 (reported on 0.6% of returns )
Here : State :
IRA payment deduction: $3,292 (reported on 3.2% of returns )08361:
$3,292New Jersey:
$3,270
(% of AGI for various income ranges: 0.3% for AGIs $10k-25k , 0.3% for AGIs $25k-50k , 0.3% for AGIs $50k-75k , 0.2% for AGIs $75k-100k , 0.1% for AGIs over 100k ) Self-employed pension: $13,534 (reported on 1.0% of returns )Here:
$13,534New Jersey:
$17,258
(% of AGI for various income ranges: 0.1% for AGIs $50k-75k , 0.2% for AGIs $75k-100k , 0.4% for AGIs over 100k ) Total itemized deductions: $18,351 (19% of AGI, reported on 43.4% of returns )Here:
$18,351State:
$23,924
Here:
19.3% of AGIState:
21.1% of AGI
(% of AGI for various income ranges: 18.8% for AGIs below $10k , 12.2% for AGIs $10k-25k , 14.6% for AGIs $25k-50k , 15.1% for AGIs $50k-75k , 16.0% for AGIs $75k-100k , 12.9% for AGIs over 100k ) Charity contributions deductions: $2,808 (3% of AGI, reported on 39.8% of returns )Here:
2.8% of AGIState:
2.7% of AGI
(% of AGI for various income ranges: 1.2% for AGIs below $10k , 1.2% for AGIs $10k-25k , 1.9% for AGIs $25k-50k , 1.8% for AGIs $50k-75k , 2.2% for AGIs $75k-100k , 2.1% for AGIs over 100k ) Total tax: $9,622 (reported on 78.8% of returns )08361:
$9,622State:
$12,321
(% of AGI for various income ranges: 2.8% for AGIs below $10k , 4.0% for AGIs $10k-25k , 7.3% for AGIs $25k-50k , 9.2% for AGIs $50k-75k , 10.4% for AGIs $75k-100k , 19.3% for AGIs over 100k ) Earned income credit: $1,604 (reported on 9.3% of returns )Percentage of individuals using paid preparers for their 2004 taxes: 67.9%(% for various income ranges: 58.9% for AGIs below $10k , 64.6% for AGIs $10k-25k , 66.0% for AGIs $25k-50k , 72.1% for AGIs $50k-75k , 73.6% for AGIs $75k-100k , 78.7% for AGIs over 100k )
Estimated median household income in 2022: This zip code:
$90,086New Jersey:
$96,346
Nearest zip codes: 08360 ,
08341 ,
08340 ,
08350 ,
08326 ,
08332 .
Vineland Zip Code Map
Percentage of family households: This zip code:
45.3%New Jersey:
47.0%
Percentage of households with unmarried partners: This zip code:
5.4%New Jersey:
49.9%
No gay or lesbian households reported
Household received Food Stamps/SNAP in the past 12 months: 752Household did not receive Food Stamps/SNAP in the past 12 months: 5,955
Women who had a birth in the past 12 months: 131 (96 now married , 35 unmarried) Women who did not have a birth in the past 12 months: 3,547 (1,572 now married , 1,973 unmarried)
Housing units in zip code 08361 with a mortgage: 3,290 (305
second mortgage , 14
home equity loan , 255
both second mortgage and home equity loan )
Houses without a mortgage: 190
Median monthly owner costs for units with a mortgage: $1,886
Median monthly owner costs for units without a mortgage: $879
Residents with income below the poverty level in 2022:
This zip code:
9.9%Whole state:
9.7%
Residents with income below 50% of the poverty level in 2022:
This zip code:
4.1%Whole state:
5.2%
Median number of rooms in houses and condos: Median number of rooms in apartments:
Year house built (houses)
11 2020 or later438 2010 to 20191,420 2000 to 2009702 1990 to 19991,163 1980 to 19891,050 1970 to 1979704 1960 to 1969754 1950 to 1959169 1940 to 1949600 1939 or earlier
Zip code 08361 household income distribution in 2022 513 Less than $10,000114 $10,000 to $14,999101 $15,000 to $19,999180 $20,000 to $24,999161 $25,000 to $29,999222 $30,000 to $34,999146 $35,000 to $39,999148 $40,000 to $44,999263 $45,000 to $49,999546 $50,000 to $59,999481 $60,000 to $74,999689 $75,000 to $99,999722 $100,000 to $124,999949 $125,000 to $149,999782 $150,000 to $199,999691 $200,000 or moreEstimate of home value of owner-occupied houses/condos in 2022 in zip code 08361 56 $10,000 to $14,99913 $15,000 to $19,99924 $20,000 to $24,99961 $25,000 to $29,99924 $35,000 to $39,99942 $70,000 to $79,99920 $80,000 to $89,99929 $90,000 to $99,999179 $100,000 to $124,999182 $125,000 to $149,999221 $150,000 to $174,999315 $175,000 to $199,999756 $200,000 to $249,9991,244 $250,000 to $299,9991,053 $300,000 to $399,999203 $400,000 to $499,999262 $500,000 to $749,99957 $750,000 to $999,99919 $1,000,000 to $1,499,999Rent paid by renters in 2022 in zip code 08361 7 Less than $10031 $200 to $24999 $250 to $29936 $500 to $54915 $550 to $59928 $600 to $64912 $750 to $79934 $800 to $899119 $900 to $999466 $1,000 to $1,249364 $1,250 to $1,49941 $1,500 to $1,9999 $2,000 to $2,49925 No cash rent
Median gross rent in 2022: $1,276.
Median price asked for vacant for-sale houses and condos in 2022: $462,957.
Estimated median house (or condo) value in 2022 for: White Non-Hispanic householders: $291,152Black or African American householders: $218,841Asian householders: $221,227Native Hawaiian and other Pacific Islander householders: $178,986Some other race householders: $242,228Two or more races householders: $292,345Hispanic or Latino householders: $249,865Estimated median house or condo value in 2022: $278,026
08361:
$278,026New Jersey:
$428,900
Lower value quartile - upper value quartile: $212,290 - $335,684
Mean price in 2022: Detached houses: $241,730Here:
$241,730State:
$537,591
Townhouses or other attached units: $245,844Here:
$245,844State:
$381,113
In 2-unit structures: $142,959Here:
$142,959State:
$444,476
In 3-to-4-unit structures: $175,614Here:
$175,614State:
$457,463
In 5-or-more-unit structures: $120,025Here:
$120,025State:
$368,745
Mobile homes: $42,974Here:
$42,974State:
$119,788
Housing units in structures:
One, detached: 5,263One, attached: 314Two: 763 or 4: 775 to 9: 20910 to 19: 17020 to 49: 24550 or more: 384Mobile homes: 281Unemployment : 4.4%
Means of transportation to work in zip code 08361 76.2% 5,902 Drove a car alone9.9% 766 Carpooled1.0% 79 Bus or trolley bus0.2% 15 Streetcar or trolley car0.2% 14 Railroad0.2% 13 Bicycle0.1% 8 Walked0.9% 70 Other means9.4% 725 Worked at homeTravel time to work (commute) in zip code 08361 214 Less than 5 minutes1,129 5 to 9 minutes1,397 10 to 14 minutes1,015 15 to 19 minutes710 20 to 24 minutes289 25 to 29 minutes747 30 to 34 minutes178 35 to 39 minutes147 40 to 44 minutes595 45 to 59 minutes337 60 to 89 minutes117 90 or more minutes
Percentage of zip code residents living and working in this county: 74.5%
Household type by relationship:
Households: 18,911
Male householders: 3,251 (688 living alone ), Female householders: 3,445 (849 living alone )3,626 spouses (3,616 opposite-sex spouses ), 503 unmarried partners , (490 opposite-sex unmarried partners ), 5,854 children (5,452 natural , 167 adopted , 235 stepchildren ), 462 grandchildren , 145 brothers or sisters , 185 parents , 0 foster children , 347 other relatives , 82 non-relatives In group quarters: 1,009 (-1 institutionalized population )
Size of family households: 2,048 2-persons , 1,090 3-persons , 1,178 4-persons , 366 5-persons , 28 6-persons , 135 7-or-more-persons
Size of nonfamily households: 1,538 1-person , 314 2-persons
2,956 married couples with children. single-parent households (412 men , 517 women ).
76.4% of residents of 08361 zip code speak English at home. of residents speak Spanish at home (77% very well, 11% well, 11% not well, 2% not at all ).of residents speak other Indo-European language at home (69% very well, 14% well, 17% not well ).of residents speak Asian or Pacific Island language at home (40% very well, 60% well ).of residents speak other language at home (65% very well, 16% well, 19% not well ).
Foreign born population: 1,585 (8.4%)
(70.9%
of them are naturalized citizens )
This zip code:
8.4%Whole state:
23.5%
15% Bhutan 9% Honduras 8% Romania 8% Liberia 8% Dominica 7% Serbia 6% Haiti 22% Italian 7% American 4% English 3% German 2% Polish 2% Irish 2% Ukrainian
Year of entry for the foreign-born population
573 2010 or later 424 2000 to 2009 618 1990 to 1999 1,052 Before 1990
There are
96 Medical Specialists in Zip Code 08361 .
Facilities with environmental interests located in this zip code:
CHOICE CLEANERS (1776 SOUTH LINCOLN AVE in VINELAND, NJ)
STATE MASTER (New Jersey environmental info) - NJEMS-81168100000, EPCRA, NJEMS-L7507, AIR PROGRAM (Resource Conservation and Recovery Act (tracking hazardous waste)) Business SIC classification: DRYCLEANING PLANTS, EXCEPT RUG CLEANING
EXCALIBUR CLEANERS (3656 E LANDIS AVE in VINELAND, NJ)
STATE MASTER (New Jersey environmental info) - NJEMS-L8999, AIR PROGRAM (Resource Conservation and Recovery Act (tracking hazardous waste)) Business SIC classification: DRYCLEANING PLANTS, EXCEPT RUG CLEANINGOrganizations: EXCALIBUR CLEANERS INCAlternative names: EXCALIBUER CLEANERS
GARRISON ROAD WELL CONTAMINATION (GARRISON RD & W KORPP DR in VINELAND CITY, NJ)
SUPERFUND (Superfund database) STATE MASTER (New Jersey environmental info) - NJEMS-G000008581, STATE CLEANUP SITE
HUDSON CITY SAVINGS BANK (29-31 LANDIS AVE in VINELAND, NJ)
(Resource Conservation and Recovery Act (tracking hazardous waste))
OAK VALLEY APARTMENTS (1301 SOUTH LINCOLN AVE in VINELAND, NJ)
COMPLIANCE ACTIVITY (Tracking inspections of insecticide, fungicide, and rodenticide, and toxic substances) Business SIC classification: OPERATORS OF APARTMENT BUILDINGS
Housing units lacking complete plumbing facilities: 0.3%
Housing units lacking complete kitchen facilities: 1.6%
78.7% Utility gas 10.4% Fuel oil, kerosene, etc. 8.1% Electricity 1.3% No fuel used 0.7% Other fuel
Place of birth for U.S.-born residents:
This state: 13,038Northeast: 1,935Midwest: 173South: 676West: 259
68% of the 08361 zip code residents lived in the same house 5 years ago.
Out of people who lived in different houses, 74% lived in this county.
Out of people who lived in different counties, 50% lived in New Jersey.
92% of the 08361 zip code residents lived in the same house 1 year ago.
Out of people who lived in different houses, 57% moved from this county.
Out of people who lived in different houses, 19% moved from different county within same state.
Out of people who lived in different houses, 17% moved from different state.
Out of people who lived in different houses, 5% moved from abroad.
Private vs. public school enrollment:
Students in private schools in grades 1 to 8 (elementary and middle school): 217
Here:
10.7%New Jersey:
12.3%
Students in private schools in grades 9 to 12 (high school): 105
Here:
10.2%New Jersey:
13.1%
Students in private undergraduate colleges: 202
Here:
25.7%New Jersey:
33.2%
Occupation by median earnings in the past 12 months ($)
95,313 Law enforcement workers including supervisors 90,387 Life, physical, and social science occupations 87,000 Business and financial operations occupations 84,810 Construction and extraction occupations 82,172 Architecture and engineering occupations 78,455 Health diagnosing and treating practitioners and other technical occupations
Companies with federal contracts located in this zip code:
GARDEN STATE HIGHWAY PRODUCTS, (1740 E OAK RD in VINELAND, NJ; small business) in 2 contracts from 2002 to 2005
$24,800 with Army for Miscellaneous Items. Signed on 2005-07-25. Completion date: 2005-08-12.
with Army for Signs, Advertising Displays, and Identification Plates. Signed on 2002-05-17. Completion date: 2002-06-07.
DWIGHT ENTERPRISES INC (3076 CORNUCOPIA AVE in VINELAND, NJ; small business)
$15,730 with Army for Maintenance, Repair or Alteration of Real Property -- Other Educational Buildings. Signed on 2000-09-25. Completion date: 2000-10-25.
Top industries in this zip code by the number of employees in 2005:
Health Care and Social Assistance: Residential Mental Retardation Facilities (250-499 employees: 1 establishment, 10-19 employees: 2 establishments, 5-9 employees: 4 establishments, 1-4 employees: 1 establishment)Health Care and Social Assistance: Offices of Physicians (except Mental Health Specialists) (50-99: 1, 20-49: 2, 10-19: 3, 5-9: 1, 1-4: 5)Health Care and Social Assistance: Child Day Care Services (50-99: 1, 20-49: 2)Health Care and Social Assistance: Offices of Dentists (20-49: 2, 10-19: 1, 5-9: 3, 1-4: 3)Other Services (except Public Administration): Religious Organizations (20-49: 2, 5-9: 2, 1-4: 3)Health Care and Social Assistance: Nursing Care Facilities (50-99: 1, 5-9: 1)Accommodation and Food Services: Full-Service Restaurants (20-49: 1, 5-9: 3, 1-4: 2)Construction: Electrical Contractors (20-49: 1, 1-4: 4)
People in group quarters in 2010:
253 people in workers' group living quarters and job corps centers
172 people in state prisons
141 people in nursing facilities/skilled-nursing facilities
111 people in group homes intended for adults
51 people in emergency and transitional shelters (with sleeping facilities) for people experiencing homelessness
23 people in residential treatment centers for juveniles (non-correctional)
6 people in residential treatment centers for adults
4 people in other noninstitutional facilities
People in group quarters in 2000:
999 people in homes for the mentally retarded
166 people in nursing homes
70 people in agriculture workers' dormitories on farms
62 people in other noninstitutional group quarters
15 people in other group homes
Fatal accident statistics in 2012:
Fatal accident count: 1Vehicles involved in fatal accidents: 1Fatal accidents caused by drunken drivers: 1Fatalities: 1Persons involved in fatal accidents: 1Pedestrians involved in fatal accidents: 0
Fatal accident statistics in 2011:
Fatal accident count: 3Vehicles involved in fatal accidents: 5Fatal accidents caused by drunken drivers: 1Fatalities: 3Persons involved in fatal accidents: 8Pedestrians involved in fatal accidents: 1
Home Mortgage Disclosure Act Aggregated Statistics For Year 2009(Based on 1 full and 6 partial tracts) A) FHA, FSA/RHS & VA B) Conventional C) Refinancings D) Home Improvement Loans E) Loans on Dwellings For 5+ Families F) Non-occupant Loans on G) Loans On Manufactured Number Average Value Number Average Value Number Average Value Number Average Value Number Average Value Number Average Value Number Average Value
LOANS ORIGINATED 194 $193,007 105 $163,498 547 $177,126 75 $45,814 0 $0 26 $164,055 15 $44,785 APPLICATIONS APPROVED, NOT ACCEPTED 5 $171,020 14 $160,881 40 $169,747 5 $61,566 1 $2,728,800 3 $305,833 4 $47,775 APPLICATIONS DENIED 34 $224,837 39 $112,398 254 $191,364 71 $35,746 2 $2,571,600 13 $143,977 31 $40,296 APPLICATIONS WITHDRAWN 27 $188,150 17 $178,178 163 $195,851 10 $71,712 0 $0 3 $226,617 1 $92,630 FILES CLOSED FOR INCOMPLETENESS 6 $210,410 2 $103,350 44 $183,012 2 $16,790 0 $0 2 $88,290 3 $146,680
Aggregated Statistics For Year 2008(Based on 1 full and 6 partial tracts) A) FHA, FSA/RHS & VA B) Conventional C) Refinancings D) Home Improvement Loans E) Loans on Dwellings For 5+ Families F) Non-occupant Loans on G) Loans On Manufactured Number Average Value Number Average Value Number Average Value Number Average Value Number Average Value Number Average Value Number Average Value
LOANS ORIGINATED 95 $216,519 192 $194,009 411 $168,337 140 $61,352 2 $325,735 26 $116,378 9 $46,474 APPLICATIONS APPROVED, NOT ACCEPTED 2 $232,050 31 $164,609 58 $176,037 31 $41,414 0 $0 1 $107,250 5 $96,914 APPLICATIONS DENIED 20 $242,639 51 $142,059 274 $200,052 140 $39,879 2 $3,000,200 18 $105,774 32 $52,809 APPLICATIONS WITHDRAWN 24 $251,142 30 $196,139 101 $190,315 23 $84,652 0 $0 8 $126,964 3 $26,650 FILES CLOSED FOR INCOMPLETENESS 1 $127,340 8 $192,576 32 $216,392 4 $152,332 0 $0 1 $85,650 0 $0
Aggregated Statistics For Year 2007(Based on 1 full and 6 partial tracts) A) FHA, FSA/RHS & VA B) Conventional C) Refinancings D) Home Improvement Loans E) Loans on Dwellings For 5+ Families F) Non-occupant Loans on G) Loans On Manufactured Number Average Value Number Average Value Number Average Value Number Average Value Number Average Value Number Average Value Number Average Value
LOANS ORIGINATED 55 $200,279 352 $186,745 601 $167,409 226 $59,207 1 $699,630 48 $148,047 25 $60,723 APPLICATIONS APPROVED, NOT ACCEPTED 0 $0 50 $162,050 141 $160,799 35 $48,768 2 $2,571,600 9 $139,986 11 $82,990 APPLICATIONS DENIED 10 $196,132 119 $180,647 368 $168,853 180 $53,232 0 $0 28 $102,276 29 $76,815 APPLICATIONS WITHDRAWN 11 $194,787 106 $191,714 250 $165,846 21 $73,890 0 $0 13 $149,814 2 $94,575 FILES CLOSED FOR INCOMPLETENESS 2 $126,865 21 $193,515 81 $193,013 3 $34,287 0 $0 2 $154,295 0 $0
Aggregated Statistics For Year 2006(Based on 1 full and 6 partial tracts) A) FHA, FSA/RHS & VA B) Conventional C) Refinancings D) Home Improvement Loans E) Loans on Dwellings For 5+ Families F) Non-occupant Loans on G) Loans On Manufactured Number Average Value Number Average Value Number Average Value Number Average Value Number Average Value Number Average Value Number Average Value
LOANS ORIGINATED 32 $207,577 486 $172,933 824 $151,833 241 $52,122 1 $964,930 76 $141,669 20 $59,281 APPLICATIONS APPROVED, NOT ACCEPTED 2 $183,440 64 $118,495 161 $154,729 38 $47,560 0 $0 10 $146,152 11 $59,571 APPLICATIONS DENIED 8 $255,550 133 $139,581 398 $162,320 191 $53,592 0 $0 29 $109,386 41 $47,744 APPLICATIONS WITHDRAWN 7 $190,386 89 $170,605 303 $160,013 25 $84,760 0 $0 13 $141,866 1 $4,880 FILES CLOSED FOR INCOMPLETENESS 3 $222,873 22 $170,085 63 $178,277 3 $88,087 0 $0 2 $55,720 1 $22,430
Aggregated Statistics For Year 2005(Based on 1 full and 6 partial tracts) A) FHA, FSA/RHS & VA B) Conventional C) Refinancings D) Home Improvement Loans E) Loans on Dwellings For 5+ Families F) Non-occupant Loans on G) Loans On Manufactured Number Average Value Number Average Value Number Average Value Number Average Value Number Average Value Number Average Value Number Average Value
LOANS ORIGINATED 30 $144,244 522 $166,756 759 $144,128 219 $52,044 2 $3,059,850 62 $148,434 40 $68,594 APPLICATIONS APPROVED, NOT ACCEPTED 0 $0 49 $144,778 144 $141,536 22 $55,867 0 $0 3 $147,230 9 $45,711 APPLICATIONS DENIED 1 $229,000 146 $119,075 362 $127,335 144 $44,898 0 $0 19 $92,776 54 $61,513 APPLICATIONS WITHDRAWN 13 $154,733 111 $152,532 405 $141,962 55 $121,914 0 $0 28 $164,471 10 $65,885 FILES CLOSED FOR INCOMPLETENESS 0 $0 32 $134,308 57 $149,942 10 $64,278 0 $0 0 $0 4 $56,792
Aggregated Statistics For Year 2004(Based on 1 full and 6 partial tracts) A) FHA, FSA/RHS & VA B) Conventional C) Refinancings D) Home Improvement Loans E) Loans on Dwellings For 5+ Families F) Non-occupant Loans on G) Loans On Manufactured Number Average Value Number Average Value Number Average Value Number Average Value Number Average Value Number Average Value Number Average Value
LOANS ORIGINATED 31 $151,659 507 $139,302 614 $117,120 145 $44,164 2 $1,042,760 80 $103,098 25 $49,664 APPLICATIONS APPROVED, NOT ACCEPTED 5 $48,004 45 $126,568 95 $103,803 30 $46,343 0 $0 11 $108,727 5 $81,078 APPLICATIONS DENIED 7 $133,527 112 $105,406 338 $110,340 141 $36,733 1 $1,000,560 40 $79,207 50 $57,114 APPLICATIONS WITHDRAWN 6 $126,117 77 $141,110 261 $125,208 25 $57,000 1 $179,000 14 $87,614 7 $45,573 FILES CLOSED FOR INCOMPLETENESS 0 $0 24 $128,123 39 $142,841 8 $51,378 0 $0 3 $141,377 2 $60,450
Aggregated Statistics For Year 2003(Based on 1 full and 6 partial tracts) A) FHA, FSA/RHS & VA B) Conventional C) Refinancings D) Home Improvement Loans E) Loans on Dwellings For 5+ Families F) Non-occupant Loans on Number Average Value Number Average Value Number Average Value Number Average Value Number Average Value Number Average Value
LOANS ORIGINATED 89 $120,065 329 $121,882 1,102 $107,880 132 $31,068 0 $0 59 $90,332 APPLICATIONS APPROVED, NOT ACCEPTED 3 $176,150 42 $140,110 167 $93,753 23 $21,868 0 $0 6 $56,633 APPLICATIONS DENIED 6 $116,868 64 $88,178 337 $98,407 86 $28,400 0 $0 14 $59,418 APPLICATIONS WITHDRAWN 8 $126,212 32 $118,584 356 $111,026 23 $32,053 1 $1,857,100 9 $82,532 FILES CLOSED FOR INCOMPLETENESS 2 $103,300 11 $109,206 43 $120,025 11 $32,143 0 $0 1 $11,370
Aggregated Statistics For Year 2002(Based on 6 partial tracts) A) FHA, FSA/RHS & VA B) Conventional C) Refinancings D) Home Improvement Loans E) Loans on Dwellings For 5+ Families F) Non-occupant Loans on Number Average Value Number Average Value Number Average Value Number Average Value Number Average Value Number Average Value
LOANS ORIGINATED 72 $1,042,194 234 $196,797 470 $92,873 83 $26,510 4 $1,868,260 29 $77,806 APPLICATIONS APPROVED, NOT ACCEPTED 2 $153,155 27 $85,666 93 $80,777 26 $24,173 0 $0 2 $51,430 APPLICATIONS DENIED 3 $80,413 73 $56,859 249 $82,270 65 $17,437 0 $0 22 $68,992 APPLICATIONS WITHDRAWN 14 $95,871 31 $1,140,873 149 $97,329 20 $49,376 2 $1,189,795 4 $123,122 FILES CLOSED FOR INCOMPLETENESS 4 $98,148 2 $109,690 33 $105,918 2 $61,200 0 $0 0 $0
Aggregated Statistics For Year 2001(Based on 6 partial tracts) A) FHA, FSA/RHS & VA B) Conventional C) Refinancings D) Home Improvement Loans E) Loans on Dwellings For 5+ Families F) Non-occupant Loans on Number Average Value Number Average Value Number Average Value Number Average Value Number Average Value Number Average Value
LOANS ORIGINATED 84 $93,836 162 $95,813 348 $84,665 97 $28,606 2 $1,175,345 33 $64,478 APPLICATIONS APPROVED, NOT ACCEPTED 2 $108,005 22 $93,020 77 $79,622 16 $33,128 0 $0 7 $60,944 APPLICATIONS DENIED 6 $99,832 78 $55,541 199 $77,584 58 $21,557 1 $549,550 5 $76,148 APPLICATIONS WITHDRAWN 9 $108,692 30 $70,134 166 $84,208 21 $29,393 0 $0 8 $63,754 FILES CLOSED FOR INCOMPLETENESS 0 $0 9 $99,334 29 $96,873 0 $0 0 $0 1 $38,020
Aggregated Statistics For Year 2000(Based on 6 partial tracts) A) FHA, FSA/RHS & VA B) Conventional C) Refinancings D) Home Improvement Loans E) Loans on Dwellings For 5+ Families F) Non-occupant Loans on Number Average Value Number Average Value Number Average Value Number Average Value Number Average Value Number Average Value
LOANS ORIGINATED 74 $87,799 193 $91,146 143 $68,945 75 $27,638 1 $711,000 8 $62,745 APPLICATIONS APPROVED, NOT ACCEPTED 3 $141,153 29 $71,024 63 $73,514 46 $21,792 0 $0 2 $16,150 APPLICATIONS DENIED 10 $84,926 95 $54,414 175 $62,859 105 $25,119 0 $0 3 $25,027 APPLICATIONS WITHDRAWN 7 $90,710 31 $125,233 103 $70,147 14 $27,756 0 $0 3 $87,863 FILES CLOSED FOR INCOMPLETENESS 3 $96,420 5 $85,944 23 $95,883 2 $34,290 0 $0 0 $0
Aggregated Statistics For Year 1999(Based on 1 full and 3 partial tracts) A) FHA, FSA/RHS & VA B) Conventional C) Refinancings D) Home Improvement Loans F) Non-occupant Loans on Number Average Value Number Average Value Number Average Value Number Average Value Number Average Value
LOANS ORIGINATED 44 $90,070 140 $105,157 187 $78,413 58 $27,856 11 $52,802 APPLICATIONS APPROVED, NOT ACCEPTED 1 $79,880 10 $86,933 52 $66,061 23 $26,397 2 $19,460 APPLICATIONS DENIED 4 $88,592 20 $71,356 117 $74,752 38 $23,487 6 $63,725 APPLICATIONS WITHDRAWN 8 $93,460 13 $100,684 92 $80,703 8 $19,139 2 $52,060 FILES CLOSED FOR INCOMPLETENESS 1 $159,010 3 $122,910 16 $76,032 0 $0 1 $79,070
Detailed HMDA statistics for the following Tracts:
0406.00
,
0407.00 ,
0408.00 ,
0410.00
Private Mortgage Insurance Companies Aggregated Statistics For Year 2009(Based on 1 full and 6 partial tracts) A) Conventional B) Refinancings Number Average Value Number Average Value
LOANS ORIGINATED 12 $193,697 8 $207,205 APPLICATIONS APPROVED, NOT ACCEPTED 12 $280,888 6 $338,740 APPLICATIONS DENIED 2 $206,215 5 $266,760 APPLICATIONS WITHDRAWN 1 $252,000 0 $0 FILES CLOSED FOR INCOMPLETENESS 4 $282,670 0 $0
Aggregated Statistics For Year 2008(Based on 1 full and 6 partial tracts) A) Conventional B) Refinancings C) Non-occupant Loans on Number Average Value Number Average Value Number Average Value
LOANS ORIGINATED 86 $237,649 28 $226,778 2 $202,500 APPLICATIONS APPROVED, NOT ACCEPTED 32 $232,723 16 $214,742 1 $164,780 APPLICATIONS DENIED 13 $352,225 8 $296,522 7 $370,200 APPLICATIONS WITHDRAWN 5 $260,550 4 $231,290 0 $0 FILES CLOSED FOR INCOMPLETENESS 4 $250,330 0 $0 1 $200,850
Aggregated Statistics For Year 2007(Based on 1 full and 6 partial tracts) A) Conventional B) Refinancings C) Non-occupant Loans on Number Average Value Number Average Value Number Average Value
LOANS ORIGINATED 130 $206,908 47 $219,927 4 $216,905 APPLICATIONS APPROVED, NOT ACCEPTED 34 $209,169 12 $233,342 7 $180,310 APPLICATIONS DENIED 4 $189,400 0 $0 1 $175,000 APPLICATIONS WITHDRAWN 12 $235,978 3 $210,140 1 $225,000 FILES CLOSED FOR INCOMPLETENESS 2 $192,015 0 $0 2 $192,015
Aggregated Statistics For Year 2006(Based on 1 full and 6 partial tracts) A) Conventional B) Refinancings C) Non-occupant Loans on Number Average Value Number Average Value Number Average Value
LOANS ORIGINATED 106 $190,721 25 $230,112 8 $149,369 APPLICATIONS APPROVED, NOT ACCEPTED 12 $199,724 19 $190,876 1 $68,980 APPLICATIONS DENIED 2 $120,145 1 $434,000 3 $224,763 APPLICATIONS WITHDRAWN 7 $166,583 4 $267,122 0 $0 FILES CLOSED FOR INCOMPLETENESS 0 $0 0 $0 0 $0
Aggregated Statistics For Year 2005(Based on 1 full and 6 partial tracts) A) Conventional B) Refinancings C) Non-occupant Loans on Number Average Value Number Average Value Number Average Value
LOANS ORIGINATED 128 $193,138 50 $184,319 8 $172,548 APPLICATIONS APPROVED, NOT ACCEPTED 30 $172,178 17 $161,796 2 $136,000 APPLICATIONS DENIED 2 $118,295 2 $115,975 0 $0 APPLICATIONS WITHDRAWN 4 $249,730 4 $209,440 0 $0 FILES CLOSED FOR INCOMPLETENESS 0 $0 0 $0 0 $0
Aggregated Statistics For Year 2004(Based on 1 full and 6 partial tracts) A) Conventional B) Refinancings C) Non-occupant Loans on Number Average Value Number Average Value Number Average Value
LOANS ORIGINATED 149 $150,999 39 $146,029 10 $95,299 APPLICATIONS APPROVED, NOT ACCEPTED 12 $163,671 15 $134,326 1 $148,000 APPLICATIONS DENIED 1 $126,000 2 $91,650 1 $126,000 APPLICATIONS WITHDRAWN 8 $194,409 5 $121,428 0 $0 FILES CLOSED FOR INCOMPLETENESS 0 $0 2 $117,435 0 $0
Aggregated Statistics For Year 2003(Based on 1 full and 6 partial tracts) A) Conventional B) Refinancings C) Non-occupant Loans on Number Average Value Number Average Value Number Average Value
LOANS ORIGINATED 125 $132,431 75 $135,069 12 $103,272 APPLICATIONS APPROVED, NOT ACCEPTED 21 $126,798 24 $130,567 4 $83,990 APPLICATIONS DENIED 6 $109,873 1 $192,000 2 $96,995 APPLICATIONS WITHDRAWN 5 $145,676 2 $175,585 0 $0 FILES CLOSED FOR INCOMPLETENESS 0 $0 0 $0 0 $0
Aggregated Statistics For Year 2002(Based on 6 partial tracts) A) Conventional B) Refinancings C) Non-occupant Loans on Number Average Value Number Average Value Number Average Value
LOANS ORIGINATED 101 $109,618 52 $117,641 12 $87,752 APPLICATIONS APPROVED, NOT ACCEPTED 9 $119,797 21 $110,991 1 $102,380 APPLICATIONS DENIED 2 $181,215 3 $222,460 0 $0 APPLICATIONS WITHDRAWN 1 $46,240 2 $121,720 1 $46,240 FILES CLOSED FOR INCOMPLETENESS 1 $100,430 0 $0 0 $0
Aggregated Statistics For Year 2001(Based on 6 partial tracts) A) Conventional B) Refinancings C) Non-occupant Loans on Number Average Value Number Average Value Number Average Value
LOANS ORIGINATED 71 $101,041 34 $113,381 5 $90,174 APPLICATIONS APPROVED, NOT ACCEPTED 5 $119,810 9 $96,770 1 $76,560 APPLICATIONS DENIED 2 $89,355 0 $0 0 $0 APPLICATIONS WITHDRAWN 2 $62,915 2 $77,150 0 $0 FILES CLOSED FOR INCOMPLETENESS 0 $0 0 $0 0 $0
Aggregated Statistics For Year 2000(Based on 6 partial tracts) A) Conventional B) Refinancings C) Non-occupant Loans on Number Average Value Number Average Value Number Average Value
LOANS ORIGINATED 70 $98,497 18 $108,044 2 $110,285 APPLICATIONS APPROVED, NOT ACCEPTED 13 $112,009 4 $77,255 2 $61,400 APPLICATIONS DENIED 3 $61,820 6 $130,693 2 $73,720 APPLICATIONS WITHDRAWN 1 $114,080 0 $0 0 $0 FILES CLOSED FOR INCOMPLETENESS 0 $0 0 $0 0 $0
Aggregated Statistics For Year 1999(Based on 1 full and 3 partial tracts) A) Conventional B) Refinancings C) Non-occupant Loans on Number Average Value Number Average Value Number Average Value
LOANS ORIGINATED 46 $126,436 14 $153,147 2 $71,285 APPLICATIONS APPROVED, NOT ACCEPTED 3 $95,463 2 $145,285 0 $0 APPLICATIONS DENIED 5 $105,252 0 $0 0 $0 APPLICATIONS WITHDRAWN 2 $97,500 0 $0 0 $0 FILES CLOSED FOR INCOMPLETENESS 0 $0 0 $0 0 $0
Detailed PMIC statistics for the following Tracts:
0406.00
,
0407.00 ,
0408.00 ,
0410.00
2003 - 2018 National Fire Incident Reporting System (NFIRS) incidents See full 2006 National Fire Incident Reporting System statistics for zip code 08361, New Jersey
Most common first names in zip code 08361 among deceased individuals Name Count Lived (average)
Mary 54 82.8 years John 44 79.1 years William 36 78.4 years Joseph 27 79.4 years Frank 25 79.2 years Helen 24 85.2 years Dorothy 22 82.7 years Anna 22 84.0 years James 21 74.9 years Margaret 18 77.0 years
Most common last names in zip code 08361 among deceased individuals Last name Count Lived (average)
Smith 10 82.4 years Brown 8 69.1 years Johnson 8 78.0 years Bergamo 7 76.0 years Martino 5 84.2 years Castellini 5 81.8 years Miller 5 72.8 years Rossi 5 87.0 years Reed 4 79.5 years Darpino 4 70.2 years
Businesses in zip code 08361
Name Count Name Count
Ace Hardware 1 Rite Aid 1 CVS 1 U-Haul 1 FedEx 2 UPS 2
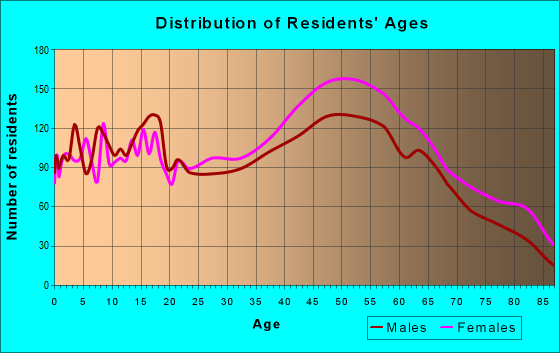


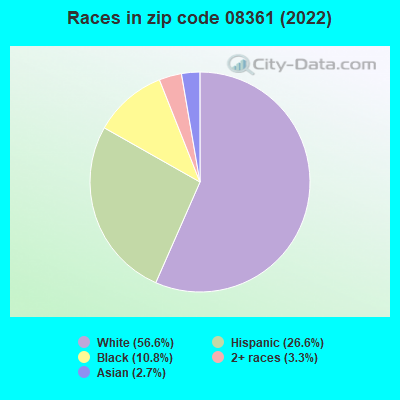


+$9,140
-$3,183
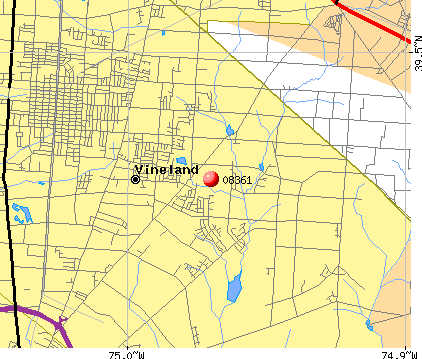 Nearest zip codes: 08360, 08341, 08340, 08350, 08326, 08332.
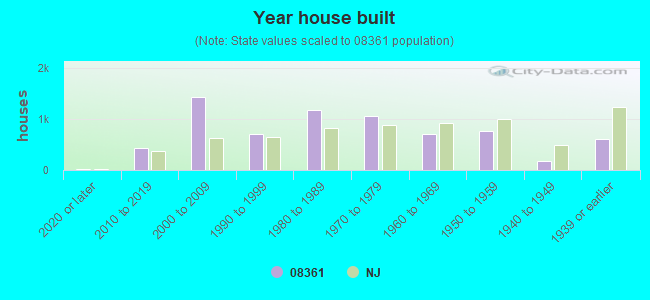

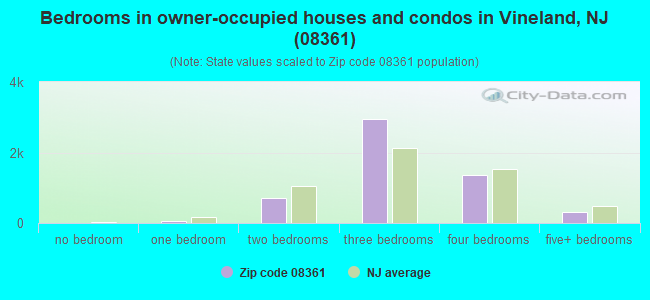
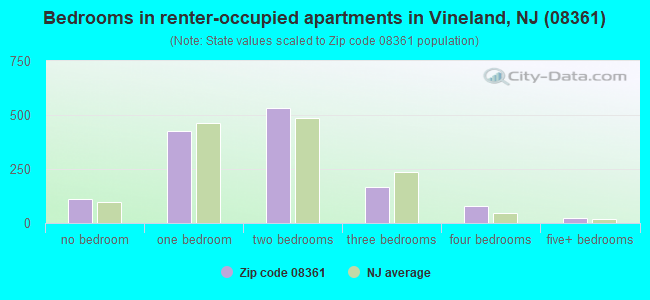
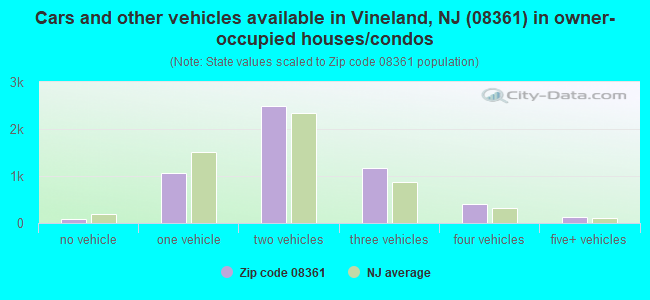
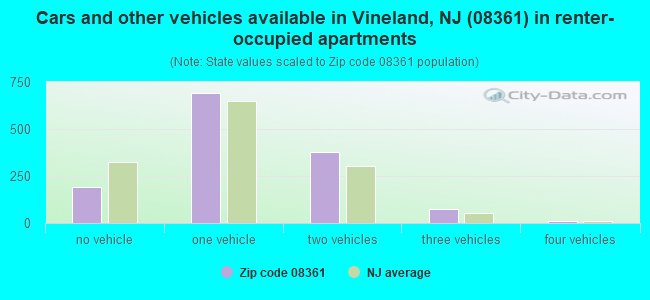


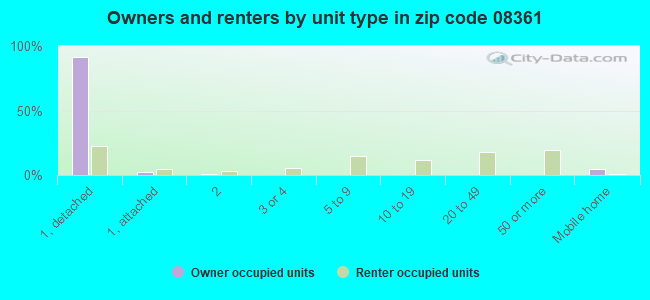
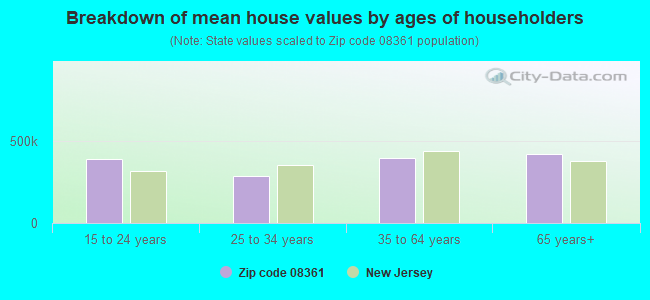


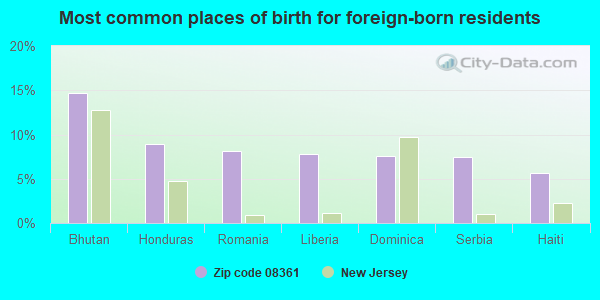
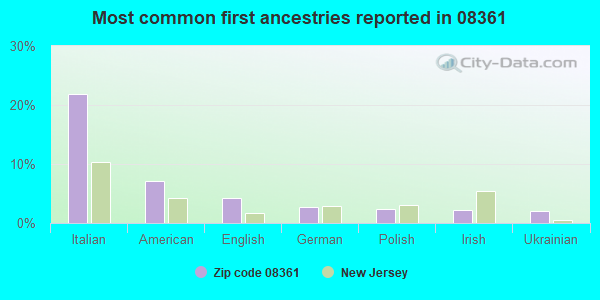
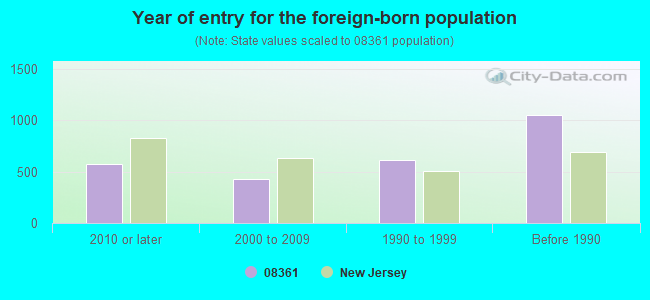
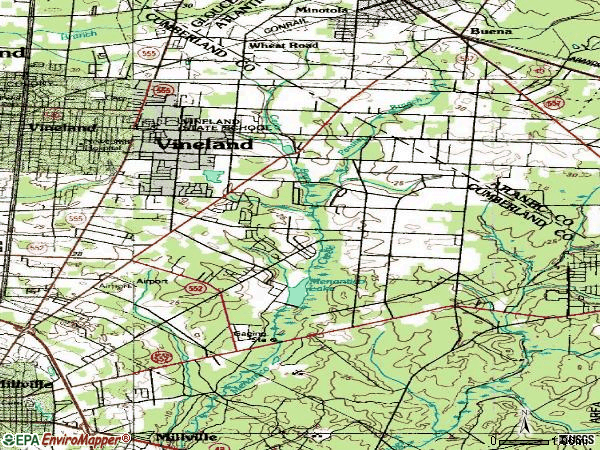

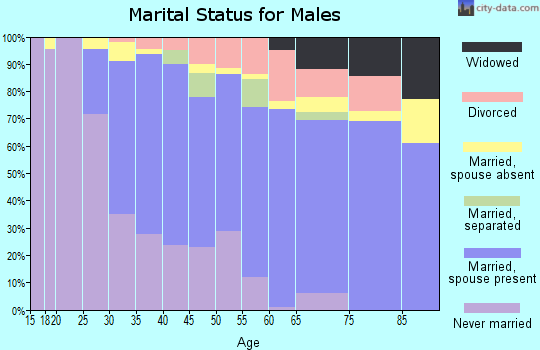
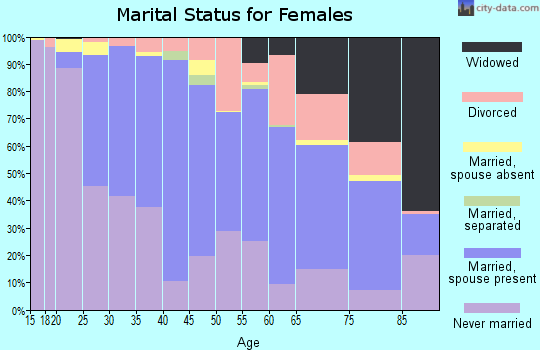
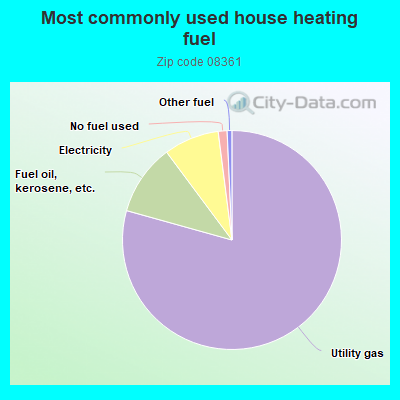
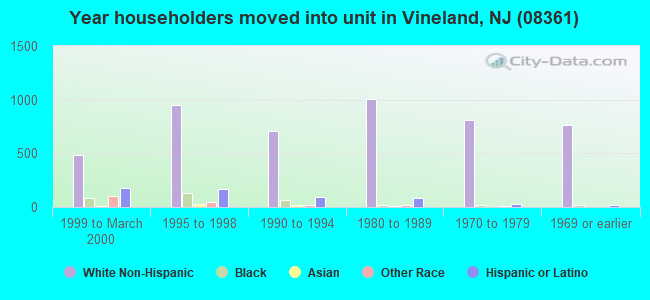
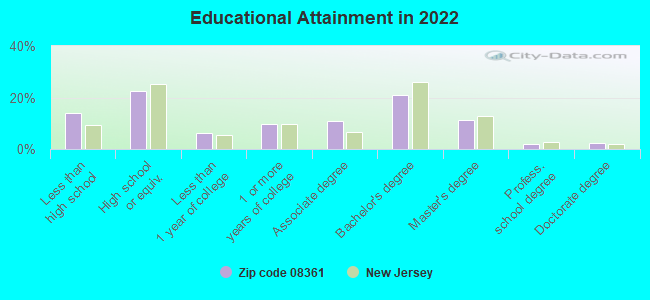
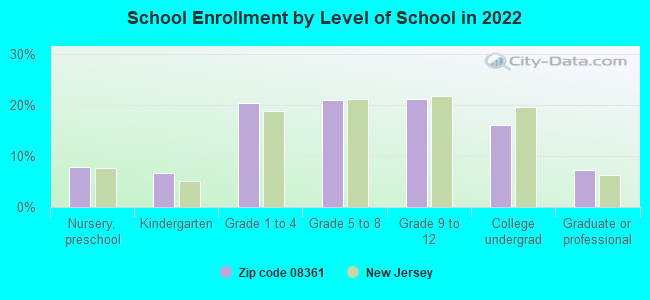
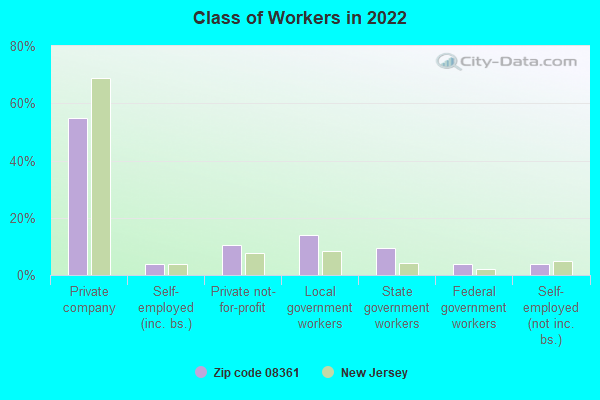
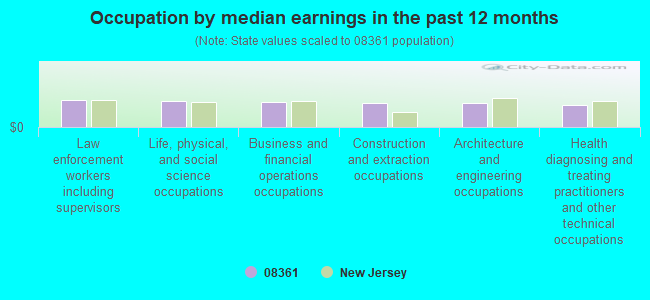
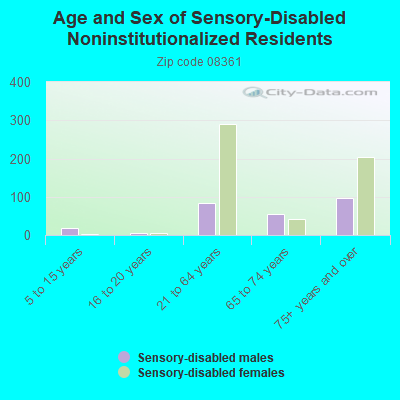
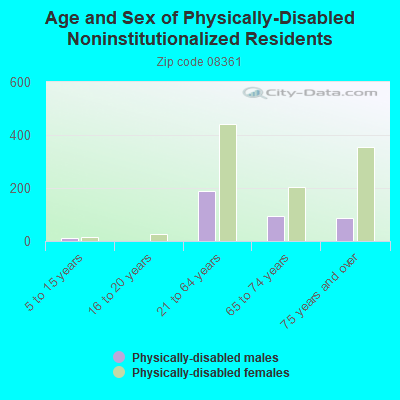
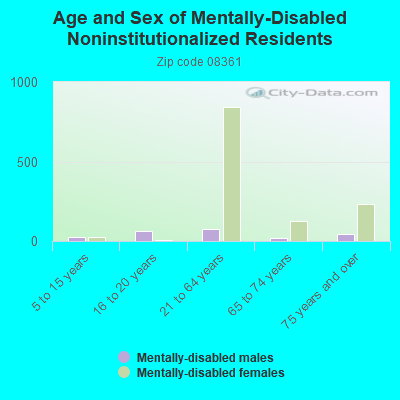
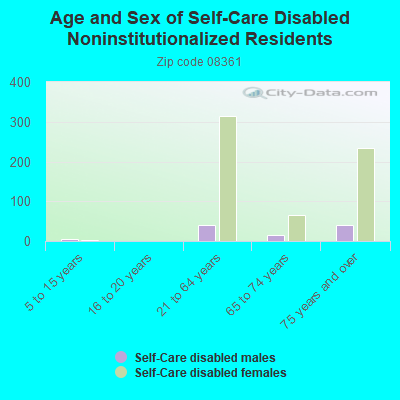
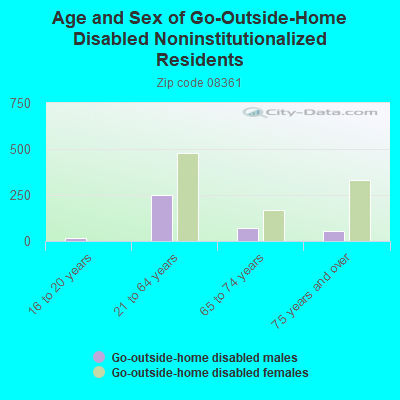
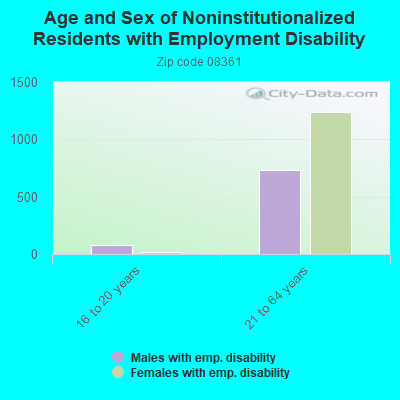
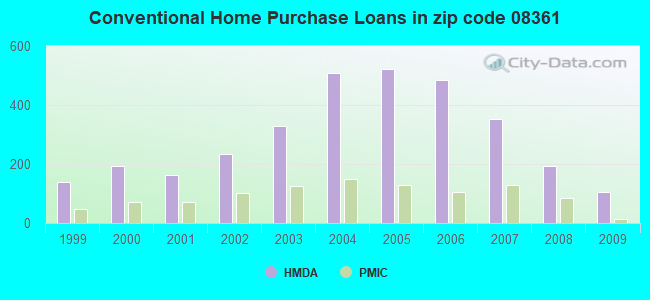
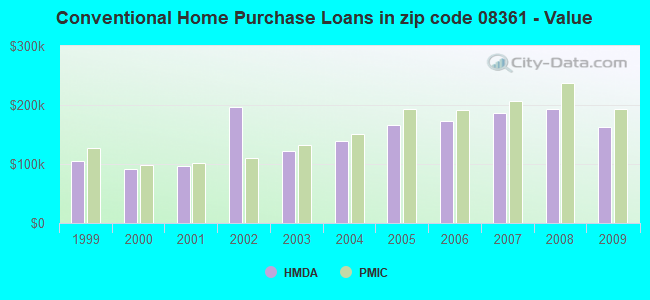
 According to the data from the years 2003 - 2018 the average number of fires per year is 38. The highest number of reported fire incidents - 69 took place in 2007, and the least - 16 in 2003. The data has an increasing trend.
 When looking into fire subcategories, the most incidents belonged to: Structure Fires (47.2%), and Outside Fires (39.3%).