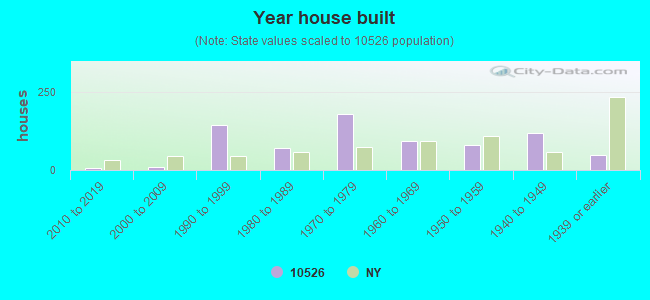
Estimated zip code population in 2022: 1,908 Zip code population in 2010: 1,809 Zip code population in 2000: 1,652
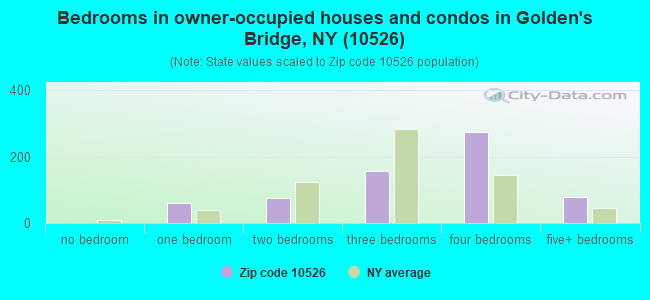
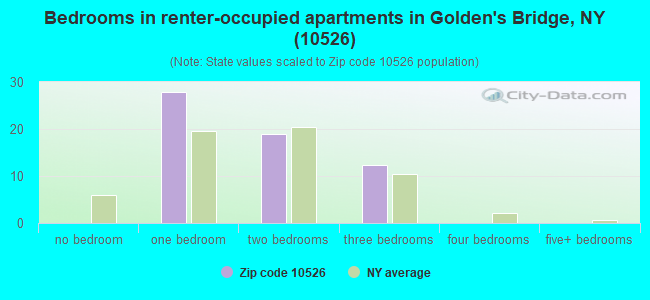
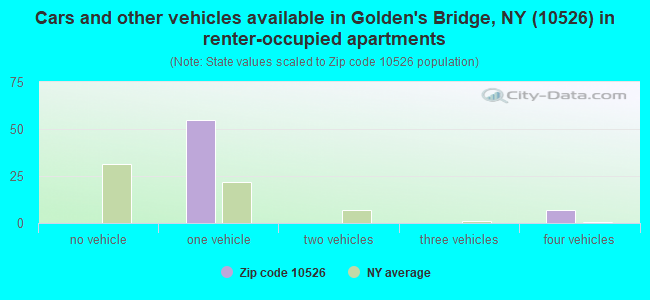
Houses and condos: 766 Renter-occupied apartments: 59
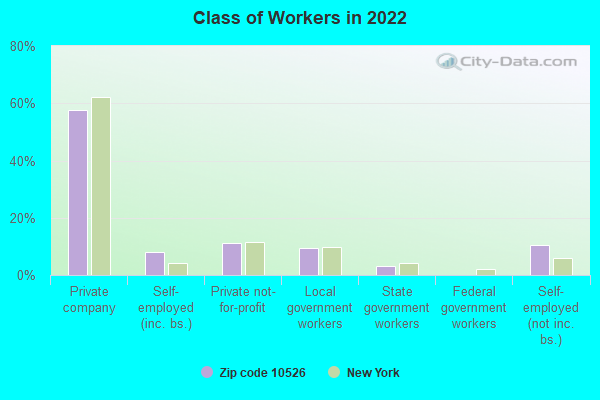
% of renters here:
8%
State:
46%
March 2022 cost of living index in zip code 10526: 147.0 (very high, U.S. average is 100)
Land area: 3.3 sq. mi. Water area: 0.5 sq. mi.
Population density: 579 people per square mile
(low).
OSM Map
General Map
Google Map
MSN Map
OSM Map
General Map
Google Map
MSN Map
OSM Map
General Map
Google Map
MSN Map
OSM Map
General Map
Google Map
MSN Map
Please wait while loading the map...
Real estate property taxes paid for housing units in 2022:
This zip code:
1.4% ($9,805)
New York:
1.5% ($6,180)
Median real estate property taxes paid for housing units with mortgages in 2022: $9,858 (1.4%) Median real estate property taxes paid for housing units with no mortgage in 2022: $9,755 (1.3%)
Business Search- 14 Million verified businesses
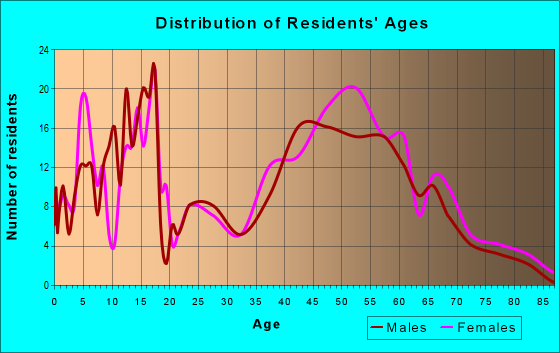
Males: 827
(43.4%)
Females: 1,080
(56.6%)
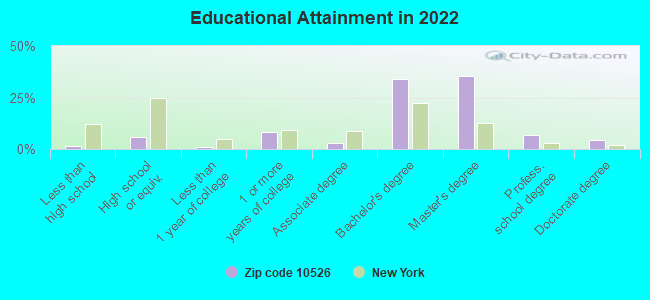
For population 25 years and over in 10526:
High school or higher: 100.0%
Bachelor's degree or higher: 81.1%
Graduate or professional degree: 47.0%
Unemployed: 0.9%
Mean travel time to work (commute): 40.2 minutes
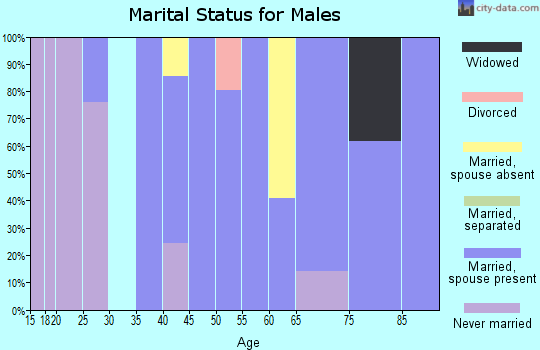
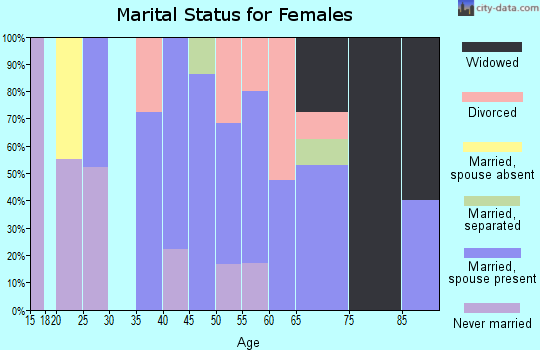
For population 15 years and over in 10526:
Never married: 26.5%
Now married: 64.2%
Separated: 1.2%
Widowed: 4.0%
Divorced: 4.1%
Zip code 10526 compared to state average:
Median household income significantly above state average.
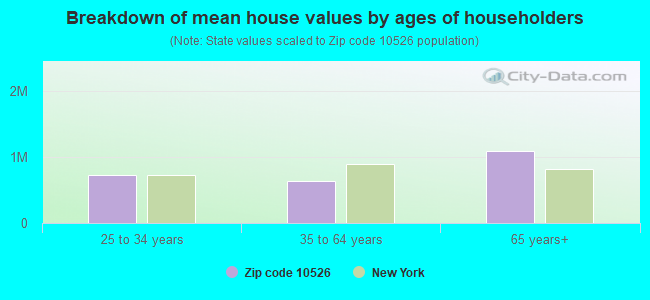
Median house value above state average.
Unemployed percentage significantly below state average.
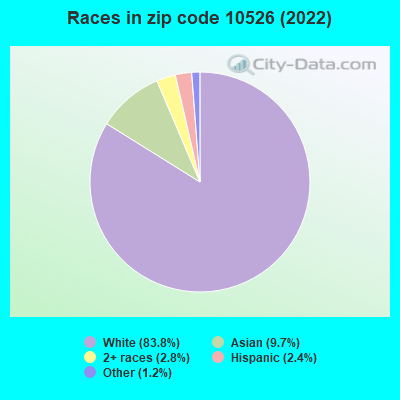
Black race population percentage significantly below state average.
Hispanic race population percentage significantly below state average.
Foreign-born population percentage below state average.
Renting percentage significantly below state average.
Number of rooms per house above state average.
Number of college students below state average.
Percentage of population with a bachelor's degree or higher above state average.
Averages for the 2020 tax year for zip code 10526, filed in 2021:
Average Adjusted Gross Income (AGI) in 2020: $178,501 (Individual Income Tax Returns)
Here:
$178,501
State:
$90,930
Salary/wage: $132,050 (reported on 76.3% of returns)
Here:
$132,050
State:
$72,104
(% of AGI for various income ranges: 1204.0% for AGIs below $25k, 4094.3% for AGIs $25k-50k, 6597.5% for AGIs $50k-75k, 10028.0% for AGIs $75k-100k, 18824.0% for AGIs $100k-200k, 107551.7% for AGIs over 200k)
Taxable interest for individuals: $3,394 (reported on 50.5% of returns)
This zip code:
$3,394
New York:
$3,075
(% of AGI for various income ranges: 35.0% for AGIs below $25k, 50.0% for AGIs $25k-50k, 47.5% for AGIs $50k-75k, 146.0% for AGIs $75k-100k, 384.0% for AGIs $100k-200k, 1830.0% for AGIs over 200k)
Ordinary dividends: $9,914 (reported on 45.4% of returns)
Here:
$9,914
State:
$11,095
(% of AGI for various income ranges: 160.0% for AGIs below $25k, 225.7% for AGIs $25k-50k, 190.0% for AGIs $50k-75k, 274.0% for AGIs $75k-100k, 767.0% for AGIs $100k-200k, 4980.0% for AGIs over 200k)
Net capital gain/loss in AGI: +$57,195 (reported on 43.3% of returns)
Here:
+$57,195
State:
+$44,925
(% of AGI for various income ranges: 112.0% for AGIs below $25k, 37.1% for AGIs $25k-50k, 142.5% for AGIs $50k-75k, 128.0% for AGIs $75k-100k, 821.0% for AGIs $100k-200k, 38141.7% for AGIs over 200k)
Profit/loss from business: +$34,545 (reported on 22.7% of returns)
Here:
+$34,545
State:
+$14,940
(% of AGI for various income ranges: 357.0% for AGIs below $25k, 1082.9% for AGIs $25k-50k, 396.2% for AGIs $50k-75k, 1330.0% for AGIs $100k-200k, 8063.3% for AGIs over 200k)
Taxable individual retirement arrangement distribution: $30,058 (reported on 12.4% of returns)
10526:
$30,058
New York:
$19,609
(% of AGI for various income ranges: 885.0% for AGIs $50k-75k, 954.0% for AGIs $100k-200k, 3241.7% for AGIs over 200k)
Self-employed (Keogh) retirement plans: $42,500 (reported on 3.1% of returns)
10526:
$42,500
New York:
$32,497
(% of AGI for various income ranges: 2125.0% for AGIs over 200k)
Total itemized deductions: $35,954 (reported on 24.7% of returns)
Here:
$35,954
State:
$39,326
(% of AGI for various income ranges: 1417.5% for AGIs $50k-75k, 2073.0% for AGIs $100k-200k, 9036.7% for AGIs over 200k)
Charity contributions: $9,790 (reported on 20.6% of returns)
Here:
$9,790
State:
$15,420
(% of AGI for various income ranges: 91.2% for AGIs $50k-75k, 297.0% for AGIs $100k-200k, 2646.7% for AGIs over 200k)
Taxes paid: $9,092 (reported on 24.7% of returns)
10526:
$9,092
State:
$9,183
(% of AGI for various income ranges: 482.5% for AGIs $50k-75k, 619.0% for AGIs $100k-200k, 1961.7% for AGIs over 200k)
Earned income credit: $1,440 (reported on 5.2% of returns)
Here:
$1,440
State:
$2,138
(% of AGI for various income ranges: 72.0% for AGIs below $25k)
Percentage of individuals using paid preparers for their 2020 taxes: 96.9%
Here:
97%
State:
95%
(% for various income ranges: 95.2% for AGIs below $25k, 92.3% for AGIs $25k-50k, 100.0% for AGIs $50k-75k, 100.0% for AGIs $75k-100k, 95.2% for AGIs $100k-200k, 100.0% for AGIs over 200k)
Averages for the 2012 tax year for zip code 10526, filed in 2013:
Average Adjusted Gross Income (AGI) in 2012: $169,568 (Individual Income Tax Returns)
Here:
$169,568
State:
$77,088
Salary/wage: $125,168 (reported on 78.8% of returns)
Here:
$125,168
State:
$60,593
(% of AGI for various income ranges: 69.0% for AGIs below $25k, 69.6% for AGIs $25k-50k, 71.4% for AGIs $50k-75k, 61.9% for AGIs $75k-100k, 72.2% for AGIs $100k-200k, 53.7% for AGIs over 200k)
Taxable interest for individuals: $3,046 (reported on 56.7% of returns)
This zip code:
$3,046
New York:
$3,125
(% of AGI for various income ranges: 2.2% for AGIs below $25k, 1.3% for AGIs $25k-50k, 0.6% for AGIs $50k-75k, 1.5% for AGIs $75k-100k, 1.2% for AGIs $100k-200k, 0.9% for AGIs over 200k)
Ordinary dividends: $8,585 (reported on 44.2% of returns)
Here:
$8,585
State:
$10,299
(% of AGI for various income ranges: 4.0% for AGIs below $25k, 2.8% for AGIs $25k-50k, 1.2% for AGIs $50k-75k, 2.5% for AGIs $75k-100k, 2.9% for AGIs $100k-200k, 2.1% for AGIs over 200k)
Net capital gain/loss in AGI: +$15,113 (reported on 37.5% of returns)
Here:
+$15,113
State:
+$42,474
(% of AGI for various income ranges: 0.9% for AGIs $100k-200k, 4.5% for AGIs over 200k)
Profit/loss from business: +$39,126 (reported on 22.1% of returns)
Here:
+$39,126
State:
+$16,168
(% of AGI for various income ranges: 12.6% for AGIs below $25k, 4.6% for AGIs $25k-50k, 6.6% for AGIs $50k-75k, 6.3% for AGIs $75k-100k, 4.2% for AGIs $100k-200k, 5.0% for AGIs over 200k)
Taxable individual retirement arrangement distribution: $23,294 (reported on 15.4% of returns)
10526:
$23,294
New York:
$17,621
(% of AGI for various income ranges: 4.7% for AGIs below $25k, 6.2% for AGIs $25k-50k, 5.7% for AGIs $75k-100k, 4.3% for AGIs $100k-200k, 1.3% for AGIs over 200k)
Self-employment retirement plans: $43,600 (reported on 3.8% of returns)
10526:
$43,600
New York:
$27,330
Total itemized deductions: $50,703 (18% of AGI, reported on 55.8% of returns)
Here:
$50,703
State:
$34,985
Here:
18.0% of AGI
State:
21.3% of AGI
(% of AGI for various income ranges: 21.1% for AGIs below $25k, 22.4% for AGIs $25k-50k, 17.6% for AGIs $50k-75k, 23.0% for AGIs $75k-100k, 20.7% for AGIs $100k-200k, 15.0% for AGIs over 200k)
Charity contributions: $4,193 (reported on 51.9% of returns)
Here:
$4,193
State:
$5,572
(% of AGI for various income ranges: 1.2% for AGIs below $25k, 1.2% for AGIs $25k-50k, 1.3% for AGIs $50k-75k, 1.8% for AGIs $75k-100k, 1.6% for AGIs $100k-200k, 1.2% for AGIs over 200k)
Taxes paid: $31,850 (reported on 55.8% of returns)
10526:
$31,850
State:
$18,656
(% of AGI for various income ranges: 9.2% for AGIs below $25k, 5.8% for AGIs $25k-50k, 9.0% for AGIs $50k-75k, 10.5% for AGIs $75k-100k, 11.5% for AGIs $100k-200k, 10.6% for AGIs over 200k)
Earned income credit: $2,029 (reported on 6.7% of returns)
Here:
$2,029
State:
$2,230
(% of AGI for various income ranges: 4.7% for AGIs below $25k)
Percentage of individuals using paid preparers for their 2012 taxes: 69.2%
Here:
69%
State:
66%
(% for various income ranges: 58.1% for AGIs below $25k, 70.6% for AGIs $25k-50k, 66.7% for AGIs $50k-75k, 77.8% for AGIs $75k-100k, 73.7% for AGIs $100k-200k, 78.9% for AGIs over 200k)
Averages for the 2004 tax year for zip code 10526, filed in 2005:
Average Adjusted Gross Income (AGI) in 2004: $134,300 (Individual Income Tax Returns)
Here:
$134,300
State:
$59,519
Salary/wage: $108,840 (reported on 78.5% of returns)
Here:
$108,840
State:
$50,673
(% of AGI for various income ranges: 86.8% for AGIs below $10k, 65.4% for AGIs $10k-25k, 73.7% for AGIs $25k-50k, 69.8% for AGIs $50k-75k, 74.0% for AGIs $75k-100k, 61.9% for AGIs over 100k)
Taxable interest for individuals: $3,278 (reported on 73.3% of returns)
This zip code:
$3,278
New York:
$2,377
(% of AGI for various income ranges: 18.0% for AGIs below $10k, 5.0% for AGIs $10k-25k, 3.3% for AGIs $25k-50k, 2.4% for AGIs $50k-75k, 1.7% for AGIs $75k-100k, 1.5% for AGIs over 100k)
Taxable dividends: $6,401 (reported on 50.8% of returns)
Here:
$6,401
State:
$5,394
(% of AGI for various income ranges: 21.1% for AGIs below $10k, 2.9% for AGIs $10k-25k, 2.1% for AGIs $25k-50k, 1.3% for AGIs $50k-75k, 1.4% for AGIs $75k-100k, 2.5% for AGIs over 100k)
Net capital gain/loss: +$11,154 (reported on 45.7% of returns)
Here:
+$11,154
State:
+$23,581
(% of AGI for various income ranges: -15.2% for AGIs below $10k, -1.1% for AGIs $10k-25k, -0.0% for AGIs $25k-50k, -0.3% for AGIs $50k-75k, -0.4% for AGIs $75k-100k, 4.7% for AGIs over 100k)
Profit/loss from business: +$26,523 (reported on 22.4% of returns)
Here:
+$26,523
State:
+$13,809
(% of AGI for various income ranges: 8.5% for AGIs below $10k, 5.6% for AGIs $10k-25k, 9.5% for AGIs $25k-50k, 5.7% for AGIs $50k-75k, 5.7% for AGIs $75k-100k, 3.9% for AGIs over 100k)
IRA payment deduction: $3,568 (reported on 4.5% of returns)
10526:
$3,568
New York:
$3,115
Self-employed pension: $19,636 (reported on 4.5% of returns)
Here:
$19,636
New York:
$19,016
Total itemized deductions: $38,715 (19% of AGI, reported on 61.1% of returns)
Here:
$38,715
State:
$25,864
Here:
18.7% of AGI
State:
21.9% of AGI
(% of AGI for various income ranges: 19.7% for AGIs $10k-25k, 22.8% for AGIs $25k-50k, 26.7% for AGIs $50k-75k, 28.0% for AGIs $75k-100k, 16.1% for AGIs over 100k)
Charity contributions deductions: $5,124 (2% of AGI, reported on 58.4% of returns)
Here:
$5,124
State:
$4,439
Here:
2.4% of AGI
State:
3.6% of AGI
(% of AGI for various income ranges: 1.4% for AGIs $10k-25k, 2.1% for AGIs $25k-50k, 2.4% for AGIs $50k-75k, 2.4% for AGIs $75k-100k, 2.2% for AGIs over 100k)
Total tax: $31,493 (reported on 84.3% of returns)
10526:
$31,493
State:
$11,730
(% of AGI for various income ranges: 4.3% for AGIs below $10k, 4.9% for AGIs $10k-25k, 8.8% for AGIs $25k-50k, 10.0% for AGIs $50k-75k, 10.9% for AGIs $75k-100k, 21.9% for AGIs over 100k)
Earned income credit: $1,217 (reported on 2.3% of returns)
Here:
$1,217
State:
$1,757
Percentage of individuals using paid preparers for their 2004 taxes: 67.8%
Here:
68%
State:
67%
(% for various income ranges: 61.4% for AGIs below $10k, 55.5% for AGIs $10k-25k, 65.0% for AGIs $25k-50k, 77.4% for AGIs $50k-75k, 74.7% for AGIs $75k-100k, 71.9% for AGIs over 100k)
In group quarters: 27 (-1 institutionalized population)
Size of family households: 167 2-persons, 186 3-persons, 193 4-persons
Size of nonfamily households: 139 1-person, 13 2-persons
385 married couples with children.
48 single-parent households (48 women).
84.7% of residents of 10526 zip code speak English at home.
1.8% of residents speak Spanish at home (58% very well, 42% well).
4.3% of residents speak other Indo-European language at home (85% very well, 15% well).
8.5% of residents speak Asian or Pacific Island language at home (92% very well, 8% well).
0.7% of residents speak other language at home (100% very well).
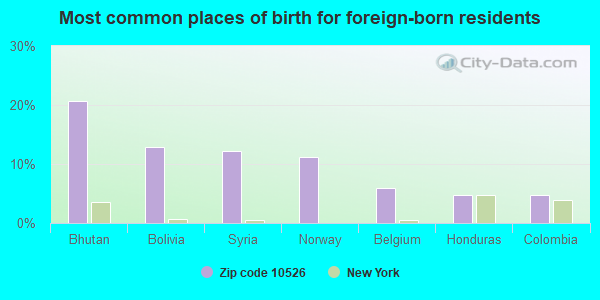
Foreign born population: 273 (14.3%) (86.3% of them are naturalized citizens)
This zip code:
14.3%
Whole state:
22.7%
21%Bhutan
13%Bolivia
12%Syria
11%Norway
6%Belgium
5%Honduras
5%Colombia
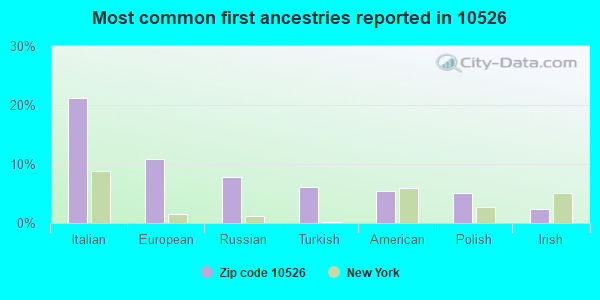
21%Italian
11%European
8%Russian
6%Turkish
5%American
5%Polish
2%Irish
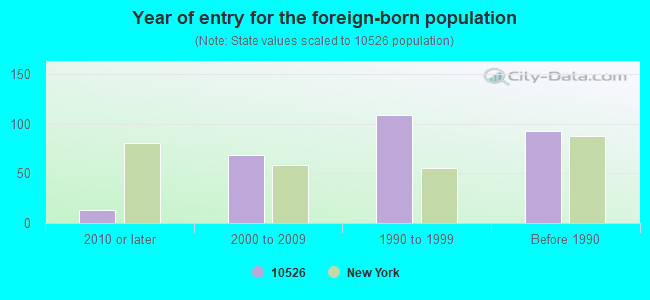
Year of entry for the foreign-born population
132010 or later
692000 to 2009
1091990 to 1999
93Before 1990
Facilities with environmental interests located in this zip code:
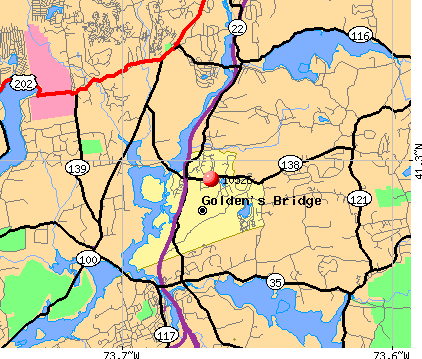
INCREASE MILLER ES ( in GOLDENS BRIDGE, NY)
(National Center for Education Statistics) - STATE ID-660101030001 Organizations: KATONAH-LEWISBORO UFSD (SCHOOL DISTRICT)
Housing units lacking complete kitchen facilities: 1.5%
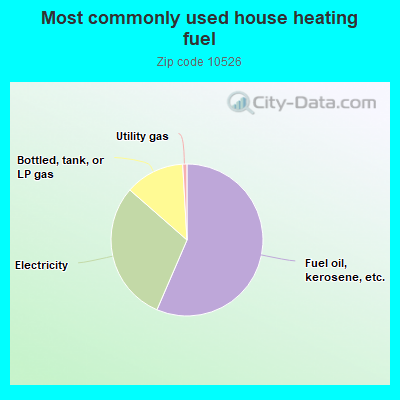
56.7%Fuel oil, kerosene, etc.
30.1%Electricity
12.7%Bottled, tank, or LP gas
0.9%Utility gas
Place of birth for U.S.-born residents:
This state: 1,209
Northeast: 305
Midwest: 66
West: 28
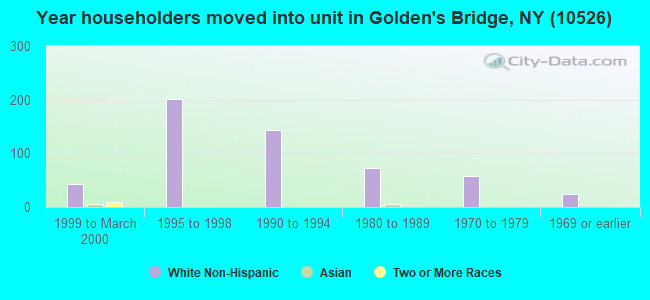
59% of the 10526 zip code residents lived in the same house 5 years ago. Out of people who lived in different houses, 73% lived in this county. Out of people who lived in different counties, 50% lived in New York.
93% of the 10526 zip code residents lived in the same house 1 year ago. Out of people who lived in different houses, 31% moved from this county. Out of people who lived in different houses, 28% moved from different county within same state. Out of people who lived in different houses, 42% moved from different state.
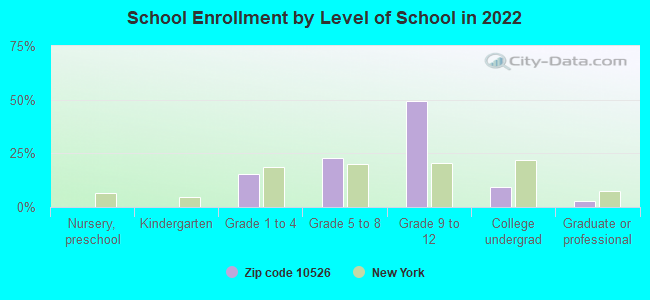
Private vs. public school enrollment:
Students in private schools in grades 1 to 8 (elementary and middle school):
Here:
0.0%
New York:
15.6%
Students in private schools in grades 9 to 12 (high school): 123
Here:
47.5%
New York:
15.0%
Students in private undergraduate colleges: 8
Here:
17.9%
New York:
39.2%
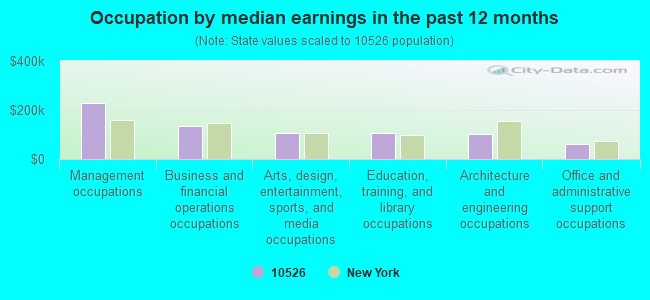
Occupation by median earnings in the past 12 months ($)
228,013Management occupations
136,365Business and financial operations occupations
106,467Arts, design, entertainment, sports, and media occupations
105,037Education, training, and library occupations
100,297Architecture and engineering occupations
59,632Office and administrative support occupations
Top industries in this zip code by the number of employees in 2005:
Construction: Commercial and Institutional Building Construction (100-249 employees: 1 establishment)
Wholesale Trade: Construction and Mining (except Oil Well) Machinery and Equipment Merchant Wholesalers (20-49: 1)
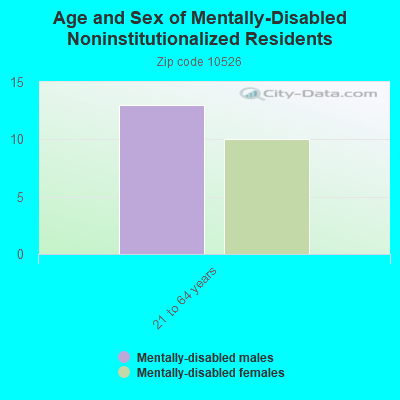
Health Care and Social Assistance: Residential Mental Retardation Facilities (20-49: 1)
Professional, Scientific, and Technical Services: Veterinary Services (10-19: 1)
Accommodation and Food Services: Limited-Service Restaurants (10-19: 1)
People in group quarters in 2010:
19 people in group homes intended for adults
People in group quarters in 2000:
22 people in homes for the mentally retarded
Home Mortgage Disclosure Act Aggregated Statistics For Year 2009 (Based on 4 partial tracts)
A) FHA, FSA/RHS & VA Home Purchase Loans
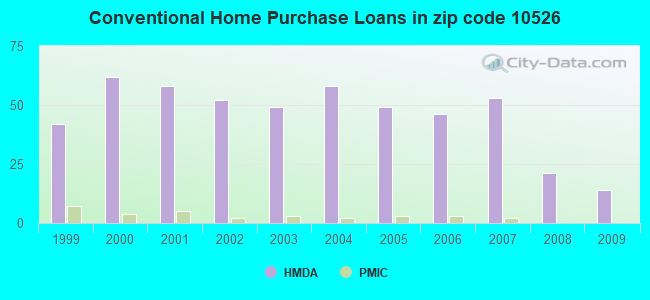
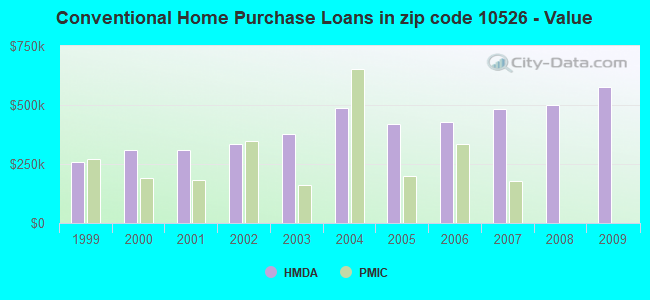
B) Conventional Home Purchase Loans
C) Refinancings
D) Home Improvement Loans
E) Loans on Dwellings For 5+ Families
F) Non-occupant Loans on < 5 Family Dwellings (A B C & D)
Number
Average Value
Number
Average Value
Number
Average Value
Number
Average Value
Number
Average Value
Number
Average Value
LOANS ORIGINATED
4
$470,632
14
$576,154
45
$400,639
2
$587,290
0
$0
1
$1,233,310
APPLICATIONS APPROVED, NOT ACCEPTED
0
$0
2
$495,460
6
$462,892
1
$320,340
2
$1,374,795
1
$445,270
APPLICATIONS DENIED
0
$0
3
$1,120,477
34
$440,405
0
$0
0
$0
3
$656,340
APPLICATIONS WITHDRAWN
0
$0
3
$749,240
16
$349,638
0
$0
0
$0
0
$0
FILES CLOSED FOR INCOMPLETENESS
0
$0
0
$0
9
$339,679
1
$53,390
0
$0
0
$0
Aggregated Statistics For Year 2008 (Based on 4 partial tracts)
A) FHA, FSA/RHS & VA Home Purchase Loans
B) Conventional Home Purchase Loans
C) Refinancings
D) Home Improvement Loans
Number
Average Value
Number
Average Value
Number
Average Value
Number
Average Value
LOANS ORIGINATED
1
$594,760
21
$500,340
25
$401,493
5
$49,118
APPLICATIONS APPROVED, NOT ACCEPTED
0
$0
7
$485,086
2
$544,580
2
$85,960
APPLICATIONS DENIED
0
$0
3
$468,053
13
$452,501
2
$21,355
APPLICATIONS WITHDRAWN
0
$0
4
$501,600
5
$433,740
0
$0
FILES CLOSED FOR INCOMPLETENESS
0
$0
0
$0
4
$464,492
3
$60,510
Aggregated Statistics For Year 2007 (Based on 4 partial tracts)
B) Conventional Home Purchase Loans
C) Refinancings
D) Home Improvement Loans
F) Non-occupant Loans on < 5 Family Dwellings (A B C & D)
Number
Average Value
Number
Average Value
Number
Average Value
Number
Average Value
LOANS ORIGINATED
53
$484,741
40
$355,791
2
$283,500
3
$344,543
APPLICATIONS APPROVED, NOT ACCEPTED
10
$505,817
19
$323,824
1
$36,310
1
$272,290
APPLICATIONS DENIED
11
$439,351
21
$311,289
3
$51,610
4
$238,920
APPLICATIONS WITHDRAWN
5
$667,162
10
$314,574
0
$0
1
$130,270
FILES CLOSED FOR INCOMPLETENESS
0
$0
4
$340,095
0
$0
0
$0
Aggregated Statistics For Year 2006 (Based on 4 partial tracts)
B) Conventional Home Purchase Loans
C) Refinancings
D) Home Improvement Loans
F) Non-occupant Loans on < 5 Family Dwellings (A B C & D)
Number
Average Value
Number
Average Value
Number
Average Value
Number
Average Value
LOANS ORIGINATED
46
$426,934
41
$421,677
7
$328,730
2
$296,850
APPLICATIONS APPROVED, NOT ACCEPTED
12
$586,222
7
$267,256
1
$698,340
0
$0
APPLICATIONS DENIED
3
$867,767
13
$384,490
1
$117,460
0
$0
APPLICATIONS WITHDRAWN
6
$369,993
20
$424,344
1
$560,600
2
$637,475
FILES CLOSED FOR INCOMPLETENESS
1
$295,780
3
$549,560
0
$0
0
$0
Aggregated Statistics For Year 2005 (Based on 4 partial tracts)
B) Conventional Home Purchase Loans
C) Refinancings
D) Home Improvement Loans
F) Non-occupant Loans on < 5 Family Dwellings (A B C & D)
Number
Average Value
Number
Average Value
Number
Average Value
Number
Average Value
LOANS ORIGINATED
49
$420,103
37
$366,659
7
$138,509
4
$300,052
APPLICATIONS APPROVED, NOT ACCEPTED
6
$630,892
9
$298,509
1
$255,200
0
$0
APPLICATIONS DENIED
7
$464,799
27
$351,306
7
$236,594
3
$552,763
APPLICATIONS WITHDRAWN
12
$520,374
29
$362,573
2
$636,410
2
$396,690
FILES CLOSED FOR INCOMPLETENESS
2
$262,680
1
$331,020
0
$0
0
$0
Aggregated Statistics For Year 2004 (Based on 4 partial tracts)
B) Conventional Home Purchase Loans
C) Refinancings
D) Home Improvement Loans
E) Loans on Dwellings For 5+ Families
F) Non-occupant Loans on < 5 Family Dwellings (A B C & D)
Number
Average Value
Number
Average Value
Number
Average Value
Number
Average Value
Number
Average Value
LOANS ORIGINATED
58
$485,683
59
$313,137
12
$112,119
1
$1,174,580
5
$315,002
APPLICATIONS APPROVED, NOT ACCEPTED
11
$466,920
15
$306,031
3
$122,797
0
$0
0
$0
APPLICATIONS DENIED
6
$393,662
26
$521,620
3
$112,120
0
$0
0
$0
APPLICATIONS WITHDRAWN
7
$340,933
22
$238,653
4
$177,788
0
$0
0
$0
FILES CLOSED FOR INCOMPLETENESS
1
$311,800
4
$445,005
1
$53,390
0
$0
0
$0
Aggregated Statistics For Year 2003 (Based on 4 partial tracts)
A) FHA, FSA/RHS & VA Home Purchase Loans
B) Conventional Home Purchase Loans
C) Refinancings
D) Home Improvement Loans
E) Loans on Dwellings For 5+ Families
F) Non-occupant Loans on < 5 Family Dwellings (A B C & D)
Number
Average Value
Number
Average Value
Number
Average Value
Number
Average Value
Number
Average Value
Number
Average Value
LOANS ORIGINATED
1
$800,850
49
$379,004
201
$301,359
6
$63,000
1
$640,680
2
$186,865
APPLICATIONS APPROVED, NOT ACCEPTED
0
$0
4
$395,888
37
$312,952
3
$58,730
0
$0
1
$182,590
APPLICATIONS DENIED
0
$0
2
$439,400
31
$264,229
1
$23,490
0
$0
3
$145,220
APPLICATIONS WITHDRAWN
0
$0
7
$551,594
31
$359,297
2
$116,925
0
$0
0
$0
FILES CLOSED FOR INCOMPLETENESS
0
$0
2
$387,075
11
$288,306
0
$0
0
$0
0
$0
Aggregated Statistics For Year 2002 (Based on 4 partial tracts)
B) Conventional Home Purchase Loans
C) Refinancings
D) Home Improvement Loans
F) Non-occupant Loans on < 5 Family Dwellings (A B C & D)
Number
Average Value
Number
Average Value
Number
Average Value
Number
Average Value
LOANS ORIGINATED
52
$333,646
145
$456,091
14
$104,416
6
$348,815
APPLICATIONS APPROVED, NOT ACCEPTED
7
$313,933
31
$238,016
3
$71,187
2
$277,630
APPLICATIONS DENIED
1
$321,410
30
$329,808
2
$13,350
0
$0
APPLICATIONS WITHDRAWN
5
$248,370
33
$306,653
4
$63,800
1
$69,410
FILES CLOSED FOR INCOMPLETENESS
1
$640,680
11
$300,246
0
$0
0
$0
Aggregated Statistics For Year 2001 (Based on 4 partial tracts)
B) Conventional Home Purchase Loans
C) Refinancings
D) Home Improvement Loans
E) Loans on Dwellings For 5+ Families
F) Non-occupant Loans on < 5 Family Dwellings (A B C & D)
Number
Average Value
Number
Average Value
Number
Average Value
Number
Average Value
Number
Average Value
LOANS ORIGINATED
58
$311,006
94
$250,933
12
$76,170
0
$0
4
$261,878
APPLICATIONS APPROVED, NOT ACCEPTED
7
$326,441
17
$221,474
5
$76,240
0
$0
0
$0
APPLICATIONS DENIED
4
$222,370
18
$230,763
4
$60,065
1
$512,540
1
$289,370
APPLICATIONS WITHDRAWN
2
$264,280
15
$239,472
6
$50,898
0
$0
1
$51,250
FILES CLOSED FOR INCOMPLETENESS
0
$0
2
$117,990
0
$0
0
$0
0
$0
Aggregated Statistics For Year 2000 (Based on 4 partial tracts)
B) Conventional Home Purchase Loans
C) Refinancings
D) Home Improvement Loans
E) Loans on Dwellings For 5+ Families
F) Non-occupant Loans on < 5 Family Dwellings (A B C & D)
Number
Average Value
Number
Average Value
Number
Average Value
Number
Average Value
Number
Average Value
LOANS ORIGINATED
62
$310,110
21
$302,238
18
$71,602
1
$533,900
2
$189,535
APPLICATIONS APPROVED, NOT ACCEPTED
6
$230,467
7
$185,034
5
$36,946
0
$0
0
$0
APPLICATIONS DENIED
12
$270,242
20
$238,974
2
$34,705
1
$160,170
0
$0
APPLICATIONS WITHDRAWN
2
$935,925
10
$255,952
1
$74,750
0
$0
1
$10,680
FILES CLOSED FOR INCOMPLETENESS
2
$192,205
3
$44,847
1
$42,710
0
$0
0
$0
Aggregated Statistics For Year 1999 (Based on 2 partial tracts)
B) Conventional Home Purchase Loans
C) Refinancings
D) Home Improvement Loans
F) Non-occupant Loans on < 5 Family Dwellings (A B C & D)


 Nearest zip codes: 10536, 10578, 10589, 10519, 10507, 10597.