Estimated zip code population in 2022: 1,500 Zip code population in 2010: 1,472 Zip code population in 2000: 1,282
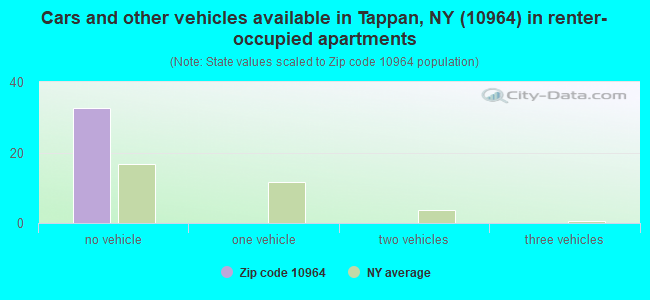
Houses and condos: 614 Renter-occupied apartments: 32
% of renters here:
6%
State:
46%
March 2022 cost of living index in zip code 10964: 121.2 (high, U.S. average is 100)
Land area: 2.5 sq. mi. Water area: 0.0 sq. mi.
Population density: 608 people per square mile
(low).
OSM Map
General Map
Google Map
MSN Map
OSM Map
General Map
Google Map
MSN Map
OSM Map
General Map
Google Map
MSN Map
OSM Map
General Map
Google Map
MSN Map
Please wait while loading the map...
Real estate property taxes paid for housing units in 2022:
This zip code:
1.3% ($9,805)
New York:
1.5% ($6,180)
Median real estate property taxes paid for housing units with mortgages in 2022: $9,858 (1.3%) Median real estate property taxes paid for housing units with no mortgage in 2022: $9,755 (1.3%)
Business Search- 14 Million verified businesses
Males: 648
(43.2%)
Females: 852
(56.8%)
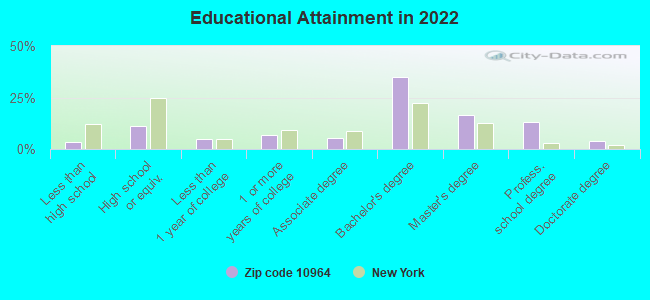
For population 25 years and over in 10964:
High school or higher: 98.0%
Bachelor's degree or higher: 69.8%
Graduate or professional degree: 34.5%
Unemployed: 7.3%
Mean travel time to work (commute): 25.6 minutes
For population 15 years and over in 10964:
Never married: 33.0%
Now married: 48.5%
Separated: 2.2%
Widowed: 12.4%
Divorced: 3.9%
Zip code 10964 compared to state average:
Median household income above state average.
Median house value above state average.
Black race population percentage significantly below state average.
Hispanic race population percentage below state average.
Median age significantly above state average.
Foreign-born population percentage below state average.
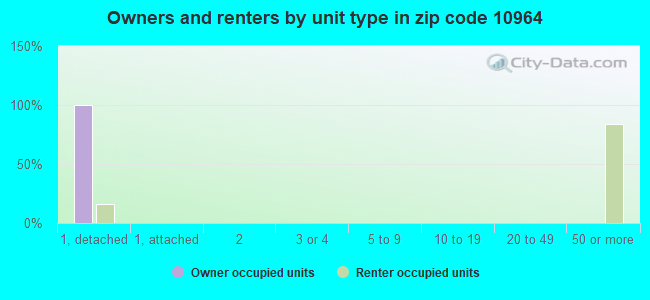
Renting percentage significantly below state average.
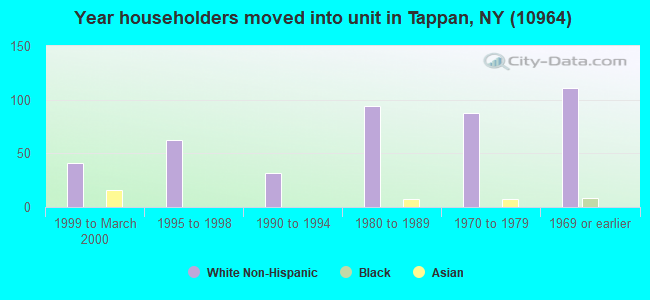
Length of stay since moving in significantly above state average.
Number of rooms per house significantly above state average.
Percentage of population with a bachelor's degree or higher above state average.
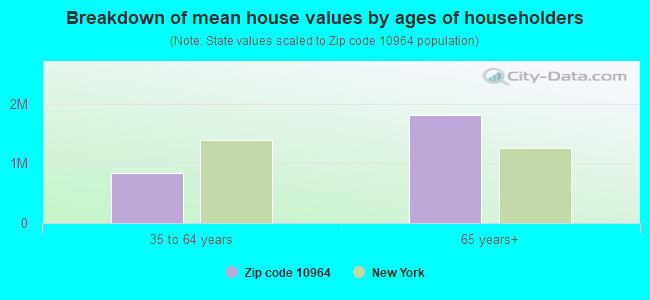
Estimated median house/condo value in 2022: $744,196
10964:
$744,196
New York:
$400,400
Median resident age:
This zip code:
50.5 years
New York median age:
40.0 years
Average household size:
This zip code:
2.5 people
New York:
2.5 people
Averages for the 2020 tax year for zip code 10964, filed in 2021:
Average Adjusted Gross Income (AGI) in 2020: $366,149 (Individual Income Tax Returns)
Here:
$366,149
State:
$90,930
Salary/wage: $176,216 (reported on 74.3% of returns)
Here:
$176,216
State:
$72,104
(% of AGI for various income ranges: 1204.3% for AGIs below $25k, 4015.0% for AGIs $25k-50k, 6382.5% for AGIs $50k-75k, 9665.0% for AGIs $75k-100k, 16526.7% for AGIs $100k-200k, 144748.0% for AGIs over 200k)
Taxable interest for individuals: $7,200 (reported on 59.5% of returns)
This zip code:
$7,200
New York:
$3,075
(% of AGI for various income ranges: 48.6% for AGIs below $25k, 200.0% for AGIs $25k-50k, 42.5% for AGIs $50k-75k, 97.5% for AGIs $75k-100k, 187.8% for AGIs $100k-200k, 5578.0% for AGIs over 200k)
Ordinary dividends: $14,965 (reported on 45.9% of returns)
Here:
$14,965
State:
$11,095
(% of AGI for various income ranges: 130.0% for AGIs below $25k, 393.3% for AGIs $25k-50k, 162.5% for AGIs $50k-75k, 422.5% for AGIs $75k-100k, 746.7% for AGIs $100k-200k, 7710.0% for AGIs over 200k)
Net capital gain/loss in AGI: +$20,053 (reported on 45.9% of returns)
Here:
+$20,053
State:
+$44,925
(% of AGI for various income ranges: 81.4% for AGIs below $25k, 211.7% for AGIs $25k-50k, 172.5% for AGIs $50k-75k, 172.5% for AGIs $75k-100k, 797.8% for AGIs $100k-200k, 11556.0% for AGIs over 200k)
Profit/loss from business: +$43,607 (reported on 20.3% of returns)
Here:
+$43,607
State:
+$14,940
(% of AGI for various income ranges: 377.1% for AGIs below $25k, 572.5% for AGIs $50k-75k, 950.0% for AGIs $100k-200k, 10386.0% for AGIs over 200k)
Taxable individual retirement arrangement distribution: $42,644 (reported on 12.2% of returns)
10964:
$42,644
New York:
$19,609
(% of AGI for various income ranges: 238.6% for AGIs below $25k, 687.5% for AGIs $50k-75k, 875.6% for AGIs $100k-200k, 5216.0% for AGIs over 200k)
Self-employed (Keogh) retirement plans: $27,933 (reported on 4.1% of returns)
10964:
$27,933
New York:
$32,497
(% of AGI for various income ranges: 931.1% for AGIs $100k-200k)
Total itemized deductions: $47,839 (reported on 31.1% of returns)
Here:
$47,839
State:
$39,326
(% of AGI for various income ranges: 1726.7% for AGIs $25k-50k, 1347.5% for AGIs $75k-100k, 2523.3% for AGIs $100k-200k, 14314.0% for AGIs over 200k)
Charity contributions: $23,255 (reported on 27.0% of returns)
Here:
$23,255
State:
$15,420
(% of AGI for various income ranges: 70.0% for AGIs $25k-50k, 190.0% for AGIs $75k-100k, 388.9% for AGIs $100k-200k, 8366.0% for AGIs over 200k)
Taxes paid: $9,000 (reported on 31.1% of returns)
10964:
$9,000
State:
$9,183
(% of AGI for various income ranges: 441.7% for AGIs $25k-50k, 482.5% for AGIs $75k-100k, 685.6% for AGIs $100k-200k, 1990.0% for AGIs over 200k)
Percentage of individuals using paid preparers for their 2020 taxes: 95.9%
Here:
96%
State:
95%
(% for various income ranges: 92.9% for AGIs below $25k, 100.0% for AGIs $25k-50k, 100.0% for AGIs $50k-75k, 85.7% for AGIs $75k-100k, 100.0% for AGIs $100k-200k, 94.7% for AGIs over 200k)
Averages for the 2012 tax year for zip code 10964, filed in 2013:
Average Adjusted Gross Income (AGI) in 2012: $190,221 (Individual Income Tax Returns)
Here:
$190,221
State:
$77,088
Salary/wage: $119,596 (reported on 71.1% of returns)
Here:
$119,596
State:
$60,593
(% of AGI for various income ranges: 63.0% for AGIs below $25k, 46.2% for AGIs $25k-50k, 51.2% for AGIs $50k-75k, 61.0% for AGIs $75k-100k, 64.7% for AGIs $100k-200k, 39.0% for AGIs over 200k)
Taxable interest for individuals: $4,140 (reported on 63.2% of returns)
This zip code:
$4,140
New York:
$3,125
(% of AGI for various income ranges: 2.2% for AGIs below $25k, 1.6% for AGIs $25k-50k, 2.0% for AGIs $50k-75k, 1.7% for AGIs $75k-100k, 0.8% for AGIs $100k-200k, 1.4% for AGIs over 200k)
Ordinary dividends: $15,103 (reported on 48.7% of returns)
Here:
$15,103
State:
$10,299
(% of AGI for various income ranges: 9.9% for AGIs below $25k, 4.0% for AGIs $25k-50k, 5.3% for AGIs $50k-75k, 3.0% for AGIs $75k-100k, 2.7% for AGIs $100k-200k, 4.0% for AGIs over 200k)
Net capital gain/loss in AGI: +$30,981 (reported on 40.8% of returns)
Here:
+$30,981
State:
+$42,474
(% of AGI for various income ranges: 2.4% for AGIs below $25k, 1.5% for AGIs $25k-50k, 4.3% for AGIs $50k-75k, 2.7% for AGIs $100k-200k, 8.2% for AGIs over 200k)
Profit/loss from business: +$41,776 (reported on 22.4% of returns)
Here:
+$41,776
State:
+$16,168
(% of AGI for various income ranges: 5.1% for AGIs below $25k, 6.7% for AGIs $25k-50k, 19.1% for AGIs $50k-75k, 4.7% for AGIs $100k-200k, 4.4% for AGIs over 200k)
Taxable individual retirement arrangement distribution: $17,208 (reported on 17.1% of returns)
10964:
$17,208
New York:
$17,621
(% of AGI for various income ranges: 7.2% for AGIs $25k-50k, 10.1% for AGIs $50k-75k, 2.2% for AGIs $100k-200k, 0.9% for AGIs over 200k)
Self-employment retirement plans: $26,867 (reported on 3.9% of returns)
10964:
$26,867
New York:
$27,330
Total itemized deductions: $62,077 (22% of AGI, reported on 61.8% of returns)
Here:
$62,077
State:
$34,985
Here:
21.6% of AGI
State:
21.3% of AGI
(% of AGI for various income ranges: 31.5% for AGIs below $25k, 32.6% for AGIs $25k-50k, 28.3% for AGIs $50k-75k, 21.7% for AGIs $75k-100k, 23.7% for AGIs $100k-200k, 18.3% for AGIs over 200k)
Charity contributions: $7,812 (reported on 53.9% of returns)
Here:
$7,812
State:
$5,572
(% of AGI for various income ranges: 1.7% for AGIs $25k-50k, 2.1% for AGIs $50k-75k, 1.9% for AGIs $75k-100k, 1.5% for AGIs $100k-200k, 2.4% for AGIs over 200k)
Taxes paid: $38,279 (reported on 61.8% of returns)
10964:
$38,279
State:
$18,656
(% of AGI for various income ranges: 20.7% for AGIs $25k-50k, 14.1% for AGIs $50k-75k, 11.4% for AGIs $75k-100k, 12.9% for AGIs $100k-200k, 12.2% for AGIs over 200k)
Earned income credit: $867 (reported on 3.9% of returns)
Here:
$867
State:
$2,230
(% of AGI for various income ranges: 1.3% for AGIs below $25k)
Percentage of individuals using paid preparers for their 2012 taxes: 78.9%
Here:
79%
State:
66%
(% for various income ranges: 73.7% for AGIs below $25k, 63.6% for AGIs $25k-50k, 77.8% for AGIs $50k-75k, 100.0% for AGIs $75k-100k, 81.2% for AGIs $100k-200k, 86.7% for AGIs over 200k)
Averages for the 2004 tax year for zip code 10964, filed in 2005:
Average Adjusted Gross Income (AGI) in 2004: $177,229 (Individual Income Tax Returns)
Here:
$177,229
State:
$59,519
Salary/wage: $96,558 (reported on 74.6% of returns)
Here:
$96,558
State:
$50,673
(% of AGI for various income ranges: 88.3% for AGIs below $10k, 58.1% for AGIs $10k-25k, 59.8% for AGIs $25k-50k, 68.1% for AGIs $50k-75k, 76.7% for AGIs $75k-100k, 36.6% for AGIs over 100k)
Taxable interest for individuals: $3,317 (reported on 76.4% of returns)
This zip code:
$3,317
New York:
$2,377
(% of AGI for various income ranges: 14.0% for AGIs below $10k, 11.6% for AGIs $10k-25k, 2.9% for AGIs $25k-50k, 2.5% for AGIs $50k-75k, 1.7% for AGIs $75k-100k, 1.1% for AGIs over 100k)
Taxable dividends: $8,449 (reported on 56.2% of returns)
Here:
$8,449
State:
$5,394
(% of AGI for various income ranges: 30.4% for AGIs below $10k, 8.0% for AGIs $10k-25k, 4.9% for AGIs $25k-50k, 3.6% for AGIs $50k-75k, 0.9% for AGIs $75k-100k, 2.5% for AGIs over 100k)
Net capital gain/loss: +$58,047 (reported on 46.5% of returns)
Here:
+$58,047
State:
+$23,581
(% of AGI for various income ranges: -38.3% for AGIs below $10k, -0.8% for AGIs $10k-25k, 0.6% for AGIs $25k-50k, -0.7% for AGIs $50k-75k, -0.7% for AGIs $75k-100k, 17.6% for AGIs over 100k)
Profit/loss from business: +$38,360 (reported on 19.9% of returns)
Here:
+$38,360
State:
+$13,809
(% of AGI for various income ranges: 7.9% for AGIs $10k-25k, 5.1% for AGIs $25k-50k, 1.9% for AGIs $50k-75k, 1.2% for AGIs $75k-100k, 4.5% for AGIs over 100k)
IRA payment deduction: $3,593 (reported on 4.0% of returns)
10964:
$3,593
New York:
$3,115
Self-employed pension: $27,045 (reported on 3.2% of returns)
Here:
$27,045
New York:
$19,016
Total itemized deductions: $43,469 (16% of AGI, reported on 62.5% of returns)
Here:
$43,469
State:
$25,864
Here:
16.1% of AGI
State:
21.9% of AGI
(% of AGI for various income ranges: 44.9% for AGIs $10k-25k, 18.5% for AGIs $25k-50k, 27.1% for AGIs $50k-75k, 28.0% for AGIs $75k-100k, 13.7% for AGIs over 100k)
Charity contributions deductions: $6,890 (3% of AGI, reported on 58.7% of returns)
Here:
$6,890
State:
$4,439
Here:
2.5% of AGI
State:
3.6% of AGI
(% of AGI for various income ranges: 2.8% for AGIs $10k-25k, 1.9% for AGIs $25k-50k, 2.6% for AGIs $50k-75k, 2.8% for AGIs $75k-100k, 2.3% for AGIs over 100k)
Total tax: $47,025 (reported on 80.9% of returns)
10964:
$47,025
State:
$11,730
(% of AGI for various income ranges: 3.3% for AGIs below $10k, 4.2% for AGIs $10k-25k, 8.3% for AGIs $25k-50k, 9.7% for AGIs $50k-75k, 9.7% for AGIs $75k-100k, 23.4% for AGIs over 100k)
Earned income credit: $1,632 (reported on 2.8% of returns)
Here:
$1,632
State:
$1,757
Percentage of individuals using paid preparers for their 2004 taxes: 75.7%
Here:
76%
State:
67%
(% for various income ranges: 72.4% for AGIs below $10k, 77.3% for AGIs $10k-25k, 63.0% for AGIs $25k-50k, 76.3% for AGIs $50k-75k, 74.6% for AGIs $75k-100k, 82.6% for AGIs over 100k)
Household received Food Stamps/SNAP in the past 12 months: 34 Household did not receive Food Stamps/SNAP in the past 12 months: 538
Women who did not have a birth in the past 12 months: 268 (81 now married, 187 unmarried)
Housing units in zip code 10964 with a mortgage: 313 (29 second mortgage, 29 both second mortgage and home equity loan) Median monthly owner costs for units with a mortgage: $3,667 Median monthly owner costs for units without a mortgage: $1,487
Residents with income below the poverty level in 2022:
This zip code:
4.0%
Whole state:
14.3%
Residents with income below 50% of the poverty level in 2022:
This zip code:
1.6%
Whole state:
6.8%
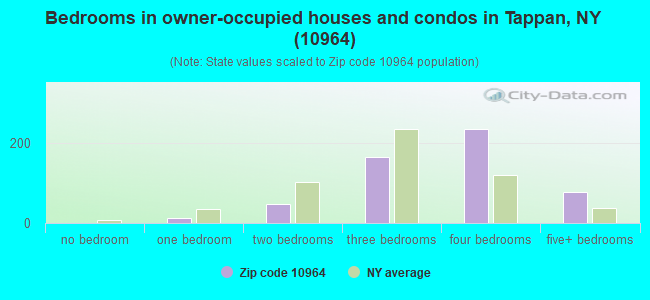
Median number of rooms in houses and condos:
Here:
8.0
State:
6.3
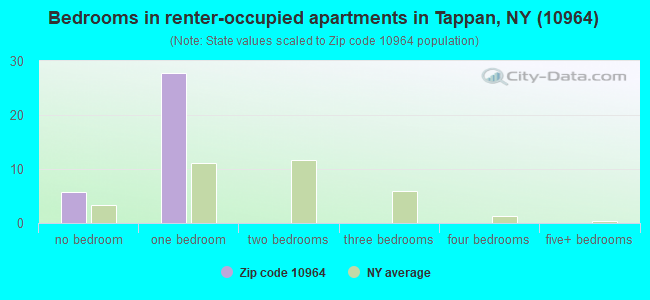
Median number of rooms in apartments:
Here:
1.9
State:
3.8
Notable locations in this zip code not listed on our city pages
Notable locations in zip code 10964: Sneden Landing (A), Lamont Observatory (B), Palisades Free Library (C), The Esplanade at Palisades (D). Display/hide their locations on the map
Parks in zip code 10964 include: Tallman Mountain State Park (1), Palisades State Park (2), Piermont Marsh Component Hudson River National Estuarine Research Reserve (3). Display/hide their locations on the map
In group quarters: 51 (-1 institutionalized population)
Size of family households: 104 2-persons, 112 3-persons, 91 4-persons, 35 5-persons, 16 7-or-more-persons
Size of nonfamily households: 213 1-person, 2 2-persons
210 married couples with children.
0 single-parent households ().
72.9% of residents of 10964 zip code speak English at home.
4.9% of residents speak Spanish at home (41% very well, 32% well, 27% not at all).
13.4% of residents speak other Indo-European language at home (83% very well, 6% well, 5% not well, 7% not at all).
9.2% of residents speak Asian or Pacific Island language at home (64% very well, 36% not well).
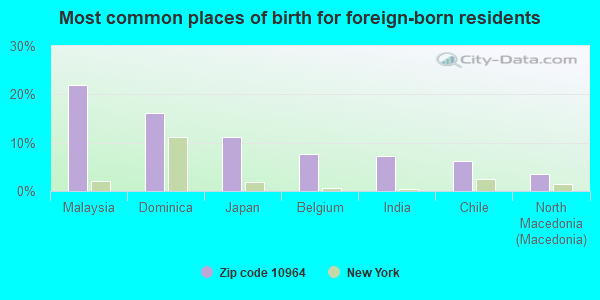
Foreign born population: 227 (15.1%) (84.4% of them are naturalized citizens)
This zip code:
15.1%
Whole state:
22.7%
22%Malaysia
16%Dominica
11%Japan
8%Belgium
7%India
6%Chile
4%North Macedonia (Macedonia)
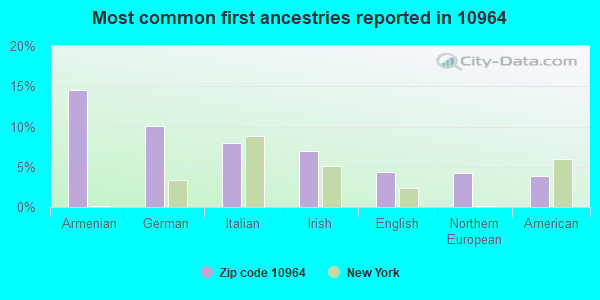
15%Armenian
10%German
8%Italian
7%Irish
4%English
4%Northern European
4%American
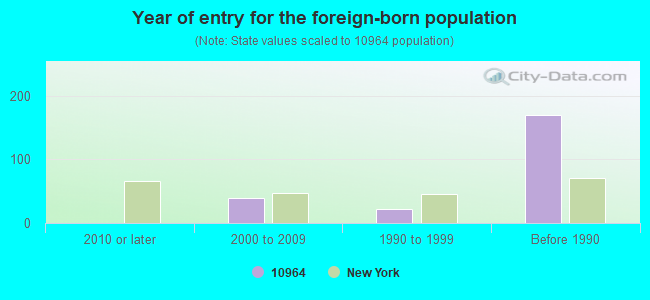
Year of entry for the foreign-born population
02010 or later
392000 to 2009
221990 to 1999
170Before 1990
Facilities with environmental interests located in this zip code:
IBM CONFERENCE CENTER (RTE 9W in PALISADES, NY)
STATE MASTER (New York facility tracking) - AIR PROGRAM, SECTION 404 PERMITTING Small Quantity Generators, between 100 kg and 1000 kg of hazardous waste/month (Resource Conservation and Recovery Act (tracking hazardous waste)) - notification Business SIC classification: SCHOOLS AND EDUCATIONAL SERVICES Organizations: I B M CORP (CONTACT/OWNER)
, IBM CORP (LEGALLY RESPONSIBLE PARTY)
Alternative names: I B M CORP
ADIPAR LTD (275 OAK TREE RD - SOUTH BLDG in PALISADES, NY)
HAZARDOUS WASTE BIENNIAL REPORTER (Resource Conservation and Recovery Act (tracking hazardous waste)) Large Quantity Generators, more that 1000 kg of hazardous waste/month (Resource Conservation and Recovery Act (tracking hazardous waste)) Business NAICS classification: ALL OTHER BASIC ORGANIC CHEMICAL MANUFACTURING.
COLOR ME BEAUTIFUL (275 OAK TREE RD in PALISADES, NY)
Large Quantity Generators, more that 1000 kg of hazardous waste/month (Resource Conservation and Recovery Act (tracking hazardous waste)) - notification
Housing units lacking complete kitchen facilities: 7.9%
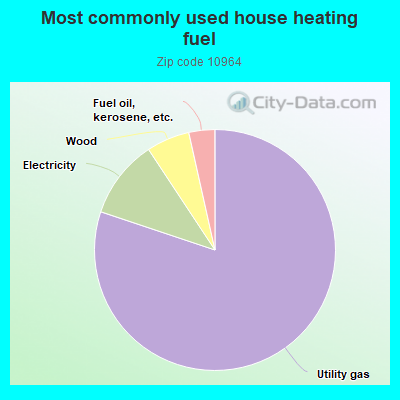
80.3%Utility gas
10.6%Electricity
5.8%Wood
3.5%Fuel oil, kerosene, etc.
Population in 1990: 996. Population change in the 1990s: +286 (+28.7%).
Place of birth for U.S.-born residents:
This state: 842
Northeast: 367
Midwest: 33
South: 11
80% of the 10964 zip code residents lived in the same house 5 years ago. Out of people who lived in different houses, 44% lived in this county. Out of people who lived in different counties, 50% lived in New York.
95% of the 10964 zip code residents lived in the same house 1 year ago. Out of people who lived in different houses, 19% moved from this county. Out of people who lived in different houses, 53% moved from different county within same state. Out of people who lived in different houses, 26% moved from different state.
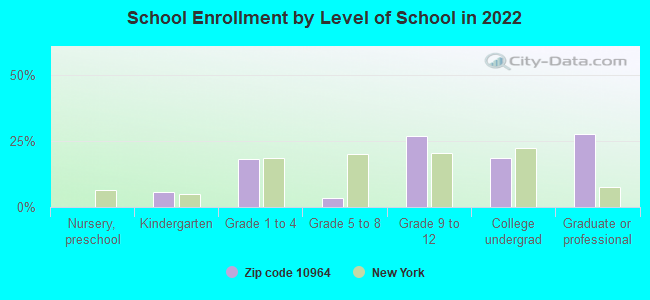
Private vs. public school enrollment:
Students in private schools in grades 1 to 8 (elementary and middle school):
Here:
0.0%
New York:
15.6%
Students in private schools in grades 9 to 12 (high school): 6
Here:
6.9%
New York:
15.0%
Students in private undergraduate colleges: 27
Here:
42.1%
New York:
39.2%
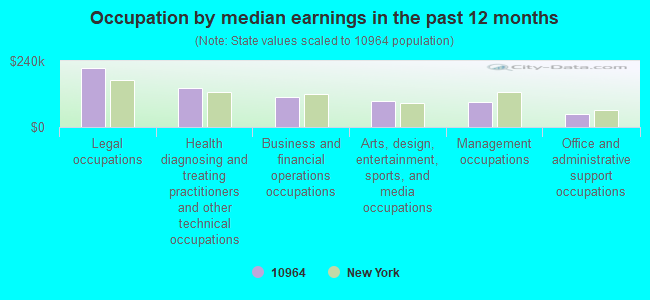
Occupation by median earnings in the past 12 months ($)
214,278Legal occupations
140,562Health diagnosing and treating practitioners and other technical occupations
108,733Business and financial operations occupations
93,465Arts, design, entertainment, sports, and media occupations
90,069Management occupations
45,606Office and administrative support occupations
Companies with federal contracts located in this zip code:
THE TRUSTEES OF COLUMBIA UNIVE (RR 9 BOX W in PALISADES, NY) : $104,682 in 2 contractsin 2004
$58,013 with Air Force for Tuition, Registration, and Membership Fees. Signed on 2004-08-23. Completion date: 2004-09-30.
$46,669, same as above.Signed on 2004-09-24. Completion date: 2003-12-08.
Top industries in this zip code by the number of employees in 2005:
Wholesale Trade: Computer and Computer Peripheral Equipment and Software Merchant Wholesalers (250-499 employees: 1 establishment)
Accommodation and Food Services: Hotels (except Casino Hotels) and Motels (100-249: 1)
Health Care and Social Assistance: Home Health Care Services (50-99: 1, 20-49: 1)
Other Services (except Public Administration): Environment, Conservation and Wildlife Organizations (20-49: 1)
Wholesale Trade: Drugs and Druggists' Sundries Merchant Wholesalers (20-49: 1)
Construction: Structural Steel and Precast Concrete Contractors (10-19: 1)
Wholesale Trade: Home Furnishing Merchant Wholesalers (10-19: 1)
Arts, Entertainment, and Recreation: Independent Artists, Writers, and Performers (1-4: 4)
Information: Libraries and Archives (5-9: 1)
People in group quarters in 2010:
17 people in residential treatment centers for adults
17 people in workers' group living quarters and job corps centers
8 people in group homes intended for adults
People in group quarters in 2000:
8 people in homes for the mentally retarded
Fatal accident statistics in 2010:
Fatal accident count: 1
Vehicles involved in fatal accidents: 1
Fatal accidents caused by drunken drivers: 0
Fatalities: 1
Persons involved in fatal accidents: 1
Pedestrians involved in fatal accidents: 1
Home Mortgage Disclosure Act Aggregated Statistics For Year 2009 (Based on 2 partial tracts)
A) FHA, FSA/RHS & VA Home Purchase Loans
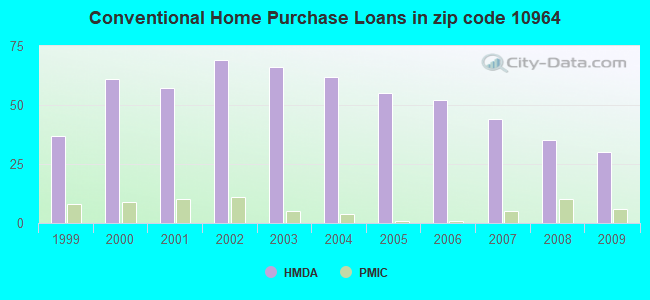
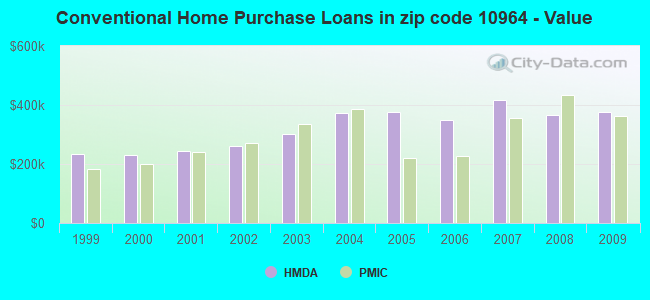
B) Conventional Home Purchase Loans
C) Refinancings
D) Home Improvement Loans
F) Non-occupant Loans on < 5 Family Dwellings (A B C & D)
Number
Average Value
Number
Average Value
Number
Average Value
Number
Average Value
Number
Average Value
LOANS ORIGINATED
5
$412,574
30
$377,727
61
$318,497
3
$211,313
1
$132,500
APPLICATIONS APPROVED, NOT ACCEPTED
1
$241,900
2
$347,660
13
$308,388
1
$5,470
0
$0
APPLICATIONS DENIED
1
$467,400
7
$433,709
43
$380,158
2
$41,025
2
$424,850
APPLICATIONS WITHDRAWN
2
$537,905
6
$451,292
26
$364,306
0
$0
1
$194,500
FILES CLOSED FOR INCOMPLETENESS
0
$0
2
$990,715
9
$395,746
0
$0
0
$0
Aggregated Statistics For Year 2008 (Based on 2 partial tracts)
A) FHA, FSA/RHS & VA Home Purchase Loans
B) Conventional Home Purchase Loans
C) Refinancings
D) Home Improvement Loans
F) Non-occupant Loans on < 5 Family Dwellings (A B C & D)
Number
Average Value
Number
Average Value
Number
Average Value
Number
Average Value
Number
Average Value
LOANS ORIGINATED
1
$457,070
35
$365,027
25
$296,850
10
$125,693
1
$326,390
APPLICATIONS APPROVED, NOT ACCEPTED
1
$216,980
8
$388,916
9
$270,741
1
$197,540
0
$0
APPLICATIONS DENIED
1
$261,350
10
$509,640
18
$348,573
6
$130,170
4
$236,890
APPLICATIONS WITHDRAWN
0
$0
3
$365,490
7
$322,481
2
$185,380
0
$0
FILES CLOSED FOR INCOMPLETENESS
0
$0
3
$616,713
7
$207,520
0
$0
0
$0
Aggregated Statistics For Year 2007 (Based on 2 partial tracts)
A) FHA, FSA/RHS & VA Home Purchase Loans
B) Conventional Home Purchase Loans
C) Refinancings
D) Home Improvement Loans
E) Loans on Dwellings For 5+ Families
F) Non-occupant Loans on < 5 Family Dwellings (A B C & D)
Number
Average Value
Number
Average Value
Number
Average Value
Number
Average Value
Number
Average Value
Number
Average Value
LOANS ORIGINATED
0
$0
44
$416,440
52
$320,965
7
$205,870
1
$8,510
4
$814,148
APPLICATIONS APPROVED, NOT ACCEPTED
1
$172,010
8
$257,479
15
$388,506
4
$183,252
0
$0
1
$245,550
APPLICATIONS DENIED
0
$0
8
$402,971
25
$339,639
3
$67,870
0
$0
4
$385,800
APPLICATIONS WITHDRAWN
0
$0
4
$325,172
10
$360,425
1
$228,530
0
$0
3
$318,283
FILES CLOSED FOR INCOMPLETENESS
0
$0
4
$319,400
4
$452,660
2
$56,220
0
$0
0
$0
Aggregated Statistics For Year 2006 (Based on 2 partial tracts)
A) FHA, FSA/RHS & VA Home Purchase Loans
B) Conventional Home Purchase Loans
C) Refinancings
D) Home Improvement Loans
E) Loans on Dwellings For 5+ Families
F) Non-occupant Loans on < 5 Family Dwellings (A B C & D)
G) Loans On Manufactured Home Dwelling (A B C & D)
Number
Average Value
Number
Average Value
Number
Average Value
Number
Average Value
Number
Average Value
Number
Average Value
Number
Average Value
LOANS ORIGINATED
0
$0
52
$349,006
72
$314,638
19
$227,637
0
$0
2
$245,245
0
$0
APPLICATIONS APPROVED, NOT ACCEPTED
0
$0
7
$318,227
19
$368,391
5
$160,824
0
$0
1
$340,370
0
$0
APPLICATIONS DENIED
1
$223,060
10
$417,012
38
$356,859
10
$145,021
0
$0
2
$206,650
0
$0
APPLICATIONS WITHDRAWN
0
$0
6
$273,207
36
$350,414
2
$173,225
1
$401,150
1
$421,810
1
$182,340
FILES CLOSED FOR INCOMPLETENESS
0
$0
4
$324,412
12
$348,725
0
$0
0
$0
0
$0
0
$0
Aggregated Statistics For Year 2005 (Based on 2 partial tracts)
A) FHA, FSA/RHS & VA Home Purchase Loans
B) Conventional Home Purchase Loans
C) Refinancings
D) Home Improvement Loans
E) Loans on Dwellings For 5+ Families
F) Non-occupant Loans on < 5 Family Dwellings (A B C & D)
Number
Average Value
Number
Average Value
Number
Average Value
Number
Average Value
Number
Average Value
Number
Average Value
LOANS ORIGINATED
0
$0
55
$376,096
80
$320,630
14
$171,530
1
$5,044,740
5
$682,316
APPLICATIONS APPROVED, NOT ACCEPTED
0
$0
10
$370,697
19
$274,949
1
$237,040
0
$0
0
$0
APPLICATIONS DENIED
1
$184,770
7
$437,529
30
$339,335
11
$303,900
0
$0
1
$176,260
APPLICATIONS WITHDRAWN
0
$0
8
$288,932
41
$323,513
4
$109,708
0
$0
0
$0
FILES CLOSED FOR INCOMPLETENESS
0
$0
2
$598,685
13
$322,742
1
$167,150
0
$0
1
$106,360
Aggregated Statistics For Year 2004 (Based on 2 partial tracts)
B) Conventional Home Purchase Loans
C) Refinancings
D) Home Improvement Loans
F) Non-occupant Loans on < 5 Family Dwellings (A B C & D)
Number
Average Value
Number
Average Value
Number
Average Value
Number
Average Value
LOANS ORIGINATED
62
$374,444
87
$271,344
19
$177,509
7
$277,330
APPLICATIONS APPROVED, NOT ACCEPTED
7
$401,061
19
$276,709
4
$106,212
2
$343,405
APPLICATIONS DENIED
5
$382,306
39
$351,994
9
$85,227
1
$401,150
APPLICATIONS WITHDRAWN
9
$356,643
36
$267,415
2
$146,175
0
$0
FILES CLOSED FOR INCOMPLETENESS
4
$285,058
8
$337,558
2
$24,920
1
$182,340
Aggregated Statistics For Year 2003 (Based on 2 partial tracts)
B) Conventional Home Purchase Loans
C) Refinancings
D) Home Improvement Loans
F) Non-occupant Loans on < 5 Family Dwellings (A B C & D)
Number
Average Value
Number
Average Value
Number
Average Value
Number
Average Value
LOANS ORIGINATED
66
$301,579
287
$225,845
13
$88,225
7
$236,956
APPLICATIONS APPROVED, NOT ACCEPTED
5
$419,626
41
$191,887
2
$39,505
0
$0
APPLICATIONS DENIED
5
$340,612
51
$269,768
5
$106,366
1
$36,470
APPLICATIONS WITHDRAWN
3
$263,787
44
$238,575
1
$79,010
1
$97,250
FILES CLOSED FOR INCOMPLETENESS
2
$402,670
13
$248,918
1
$85,090
0
$0
Aggregated Statistics For Year 2002 (Based on 2 partial tracts)
B) Conventional Home Purchase Loans
C) Refinancings
D) Home Improvement Loans
F) Non-occupant Loans on < 5 Family Dwellings (A B C & D)
Number
Average Value
Number
Average Value
Number
Average Value
Number
Average Value
LOANS ORIGINATED
69
$261,398
169
$221,459
15
$65,643
4
$227,470
APPLICATIONS APPROVED, NOT ACCEPTED
7
$274,291
32
$231,287
4
$89,650
1
$121,560
APPLICATIONS DENIED
4
$225,190
30
$282,911
6
$60,072
0
$0
APPLICATIONS WITHDRAWN
9
$305,386
44
$235,550
3
$52,677
1
$1,214,380
FILES CLOSED FOR INCOMPLETENESS
2
$421,815
12
$209,893
0
$0
0
$0
Aggregated Statistics For Year 2001 (Based on 2 partial tracts)
A) FHA, FSA/RHS & VA Home Purchase Loans
B) Conventional Home Purchase Loans
C) Refinancings
D) Home Improvement Loans
F) Non-occupant Loans on < 5 Family Dwellings (A B C & D)
Number
Average Value
Number
Average Value
Number
Average Value
Number
Average Value
Number
Average Value
LOANS ORIGINATED
1
$131,280
57
$243,621
99
$212,257
18
$73,206
1
$372,580
APPLICATIONS APPROVED, NOT ACCEPTED
0
$0
8
$266,520
12
$136,197
4
$48,320
0
$0
APPLICATIONS DENIED
1
$150,730
7
$235,826
24
$186,164
9
$83,877
0
$0
APPLICATIONS WITHDRAWN
0
$0
6
$176,870
35
$147,470
5
$20,058
1
$6,080
FILES CLOSED FOR INCOMPLETENESS
0
$0
1
$178,090
8
$135,540
2
$65,340
0
$0
Aggregated Statistics For Year 2000 (Based on 2 partial tracts)
A) FHA, FSA/RHS & VA Home Purchase Loans
B) Conventional Home Purchase Loans
C) Refinancings
D) Home Improvement Loans
F) Non-occupant Loans on < 5 Family Dwellings (A B C & D)
Number
Average Value
Number
Average Value
Number
Average Value
Number
Average Value
Number
Average Value
LOANS ORIGINATED
1
$137,970
61
$230,267
27
$169,779
18
$46,125
2
$178,085
APPLICATIONS APPROVED, NOT ACCEPTED
0
$0
5
$283,234
7
$114,874
6
$35,860
1
$7,290
APPLICATIONS DENIED
0
$0
8
$245,475
23
$162,785
13
$48,718
0
$0
APPLICATIONS WITHDRAWN
0
$0
3
$155,190
24
$108,442
2
$194,190
0
$0
FILES CLOSED FOR INCOMPLETENESS
0
$0
0
$0
12
$179,808
0
$0
0
$0
Aggregated Statistics For Year 1999 (Based on 1 partial tract)
A) FHA, FSA/RHS & VA Home Purchase Loans
B) Conventional Home Purchase Loans
C) Refinancings
D) Home Improvement Loans
F) Non-occupant Loans on < 5 Family Dwellings (A B C & D)
Detailed PMIC statistics for the following Tracts:0134.00
2002 - 2018 National Fire Incident Reporting System (NFIRS) incidents
Based on the data from the years 2002 - 2018 the average number of fires per year is 11. The highest number of fire incidents - 18 took place in 2005, and the least - 3 in 2003. The data has a constant trend.
When looking into fire subcategories, the most incidents belonged to: Structure Fires (78.5%), and Outside Fires (11.0%).
Fire incident types reported to NFIRS in Zip Code 10964

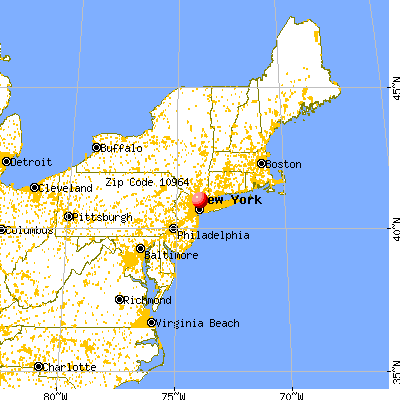


 Nearest zip codes: 10976, 10968, 07647, 10983, 10503, 07648.


 Based on the data from the years 2002 - 2018 the average number of fires per year is 11. The highest number of fire incidents - 18 took place in 2005, and the least - 3 in 2003. The data has a constant trend.
 When looking into fire subcategories, the most incidents belonged to: Structure Fires (78.5%), and Outside Fires (11.0%).