Rockland County, New York (NY)
County owner-occupied free and clear houses and condos in 2010: 18,698
County owner-occupied houses and condos in 2000: 66,461
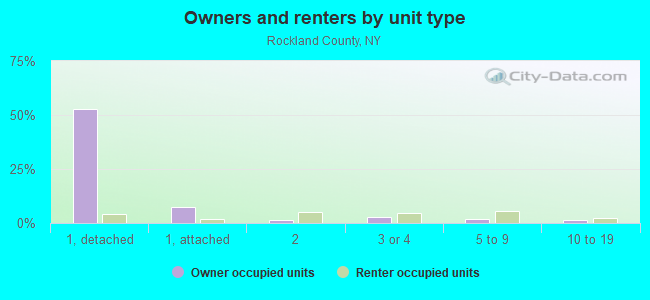
Renter-occupied apartments: 30,436 (it was 26,214 in 2000)
| % of renters here: | 28% |
| State: | 47% |
Land area: 174 sq. mi.
Water area: 25.1 sq. mi.
Population density: 1946 people per square mile (very high).
Industries providing employment: Educational, health and social services (33.4%), Professional, scientific, management, administrative, and waste management services (11.3%), Retail trade (10.8%).
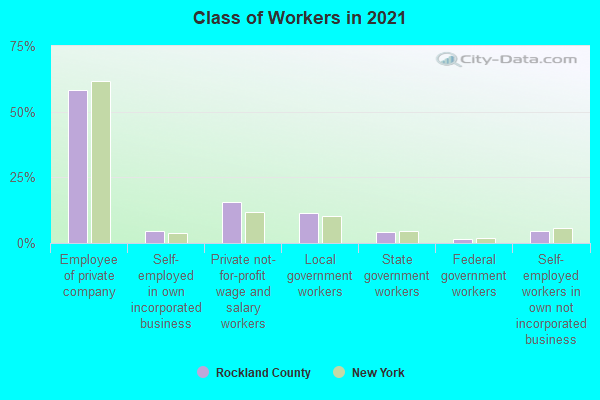
Type of workers:
- Private wage or salary: 78%
- Government: 16%
- Self-employed, not incorporated: 6%
- Unpaid family work: 0%
- OSM Map
- General Map
- Google Map
- MSN Map

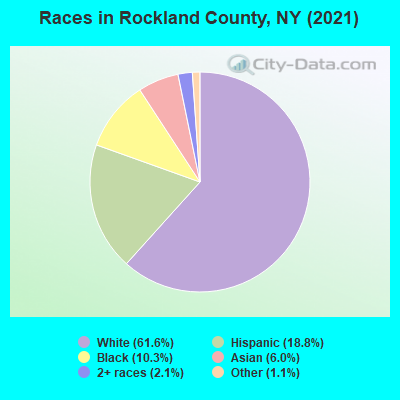
- 205,93060.7%White Non-Hispanic Alone
- 65,91419.4%Hispanic or Latino
- 35,64310.5%Black Non-Hispanic Alone
- 21,2006.3%Asian alone
- 7,8742.3%Two or more races
- 1,8610.5%Some other race alone
- 3840.1%American Indian and Alaska Native alone
- 2160.06%Native Hawaiian and Other
Pacific Islander alone
| Median resident age: | 34.9 years |
| New York median age: | 40.0 years |
| Males: 169,864 | |
| Females: 169,158 |

 | Moving from Brooklyn. Jewish communities upstate? (332 replies) |
| Return of buses to Rockland County? (3 replies) |
| Amazon Punked For $19M By Four Brothers From Rockland County (0 replies) |
| Graduation videos… (38 replies) |
| Rockland County Property Taxes on Closing (4 replies) |
| Regeneron Expansion... (12 replies) |
| Rockland County: | 3.0 people |
| New York: | 3 people |
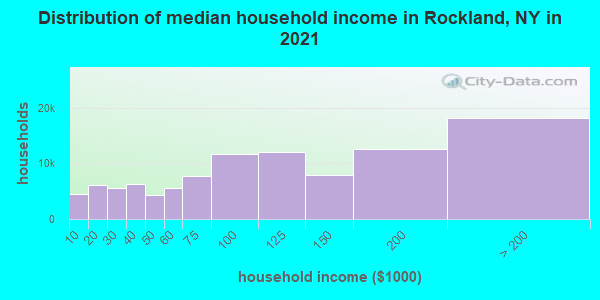
Estimated median household income in 2022: $100,397 ($67,971 in 1999)
| This county: | $100,397 |
| New York: | $79,557 |
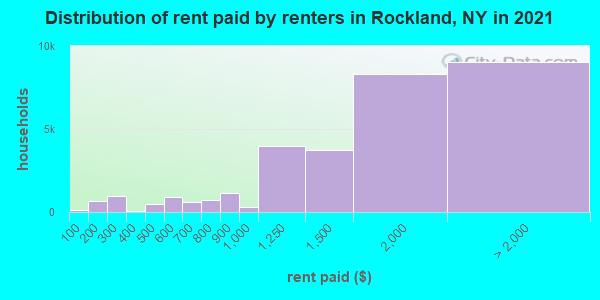
Median contract rent in 2022 for apartments: $1,550 (lower quartile is $997, upper quartile is $1,957)
| This county: | $1550 |
| State: | $1354 |
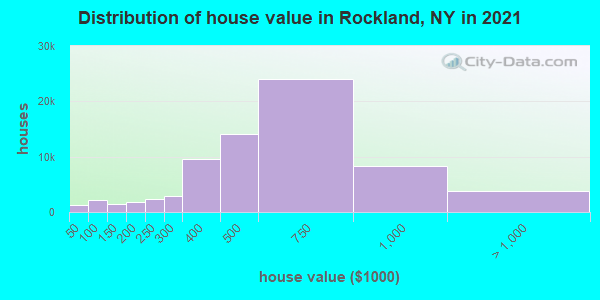
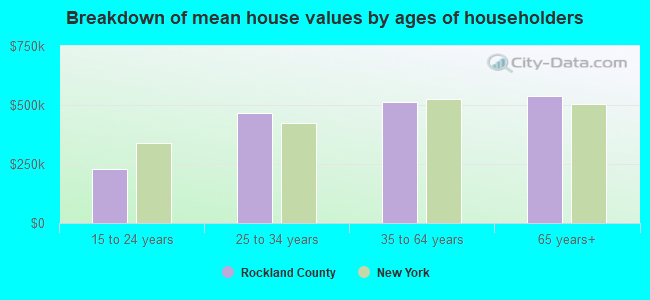
Estimated median house or condo value in 2022: $552,500 (it was $234,300 in 2000)
| Rockland: | $552,500 |
| New York: | $400,400 |
Mean price in 2022:
Median monthly housing costs for homes and condos with a mortgage: $3,235Detached houses: $694,132
Here: $694,132 State: $476,719 Townhouses or other attached units: $449,914
Here: $449,914 State: $699,270 In 2-unit structures: $608,490
Here: $608,490 State: $713,077 In 3-to-4-unit structures: $239,911
Here: $239,911 State: $764,568 In 5-or-more-unit structures: $366,943
Here: $366,943 State: $912,009 Mobile homes: $68,506
Here: $68,506 State: $88,925
Median monthly housing costs for units without a mortgage: $1,501
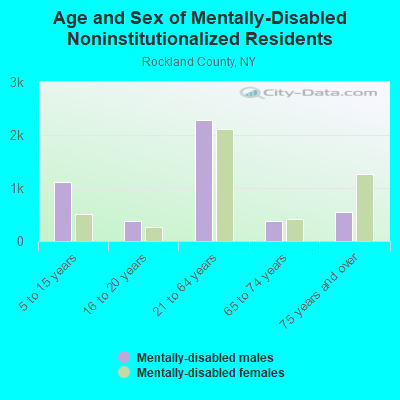
Institutionalized population: 2,368
Crime in 2021 (reported by the sheriff's office or county police, not the county total):
- Murders: 0
- Rapes: 0
- Robberies: 0
- Assaults: 2
- Burglaries: 1
- Thefts: 5
- Auto thefts: 0
Crime in 2019 (reported by the sheriff's office or county police, not the county total):
- Murders: 0
- Rapes: 0
- Robberies: 0
- Assaults: 6
- Burglaries: 0
- Thefts: 10
- Auto thefts: 1
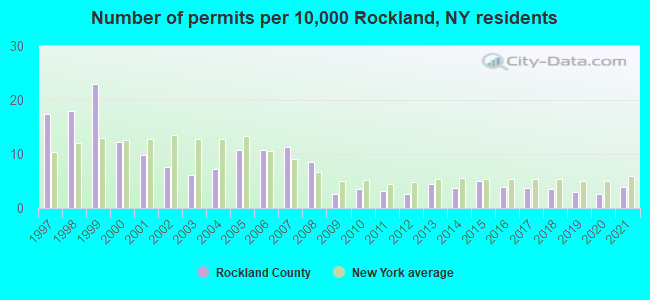
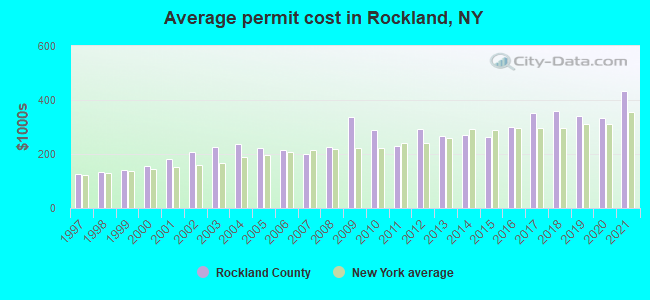
Single-family new house construction building permits:
- 2022: 111 buildings, average cost: $436,900
- 2021: 113 buildings, average cost: $432,500
- 2020: 73 buildings, average cost: $335,400
- 2019: 87 buildings, average cost: $340,700
- 2018: 102 buildings, average cost: $359,200
- 2017: 107 buildings, average cost: $350,900
- 2016: 111 buildings, average cost: $299,100
- 2015: 144 buildings, average cost: $262,000
- 2014: 105 buildings, average cost: $269,600
- 2013: 130 buildings, average cost: $265,000
- 2012: 76 buildings, average cost: $291,500
- 2011: 92 buildings, average cost: $230,300
- 2010: 99 buildings, average cost: $289,200
- 2009: 76 buildings, average cost: $336,100
- 2008: 246 buildings, average cost: $224,500
- 2007: 324 buildings, average cost: $201,000
- 2006: 307 buildings, average cost: $214,000
- 2005: 308 buildings, average cost: $222,200
- 2004: 206 buildings, average cost: $235,700
- 2003: 177 buildings, average cost: $225,100
- 2002: 220 buildings, average cost: $208,400
- 2001: 282 buildings, average cost: $179,800
- 2000: 351 buildings, average cost: $157,000
- 1999: 659 buildings, average cost: $140,300
- 1998: 516 buildings, average cost: $132,500
- 1997: 501 buildings, average cost: $124,700
Median real estate property taxes paid for housing units with mortgages in 2022: $10,001 (1.7%)
Median real estate property taxes paid for housing units with no mortgage in 2022: $10,001 (2.0%)
| Rockland County: | 15.1% |
| New York: | 14.3% |
Median age of residents in 2022: 34.9 years old
(Males: 32.9 years old, Females: 37.2 years old)
(Median age for: White residents: 34.7 years old, Black residents: 36.8 years old, American Indian residents: 37.5 years old, Asian residents: 43.0 years old, Hispanic or Latino residents: 31.5 years old, Other race residents: 30.7 years old)
Area name: New York-Monmouth-Ocean, NY-NJ HUD Metro FMR Area
Fair market rent in 2006 for a 1-bedroom apartment in Rockland County is $1003 a month.
Fair market rent for a 2-bedroom apartment is $1133 a month.
Fair market rent for a 3-bedroom apartment is $1406 a month.
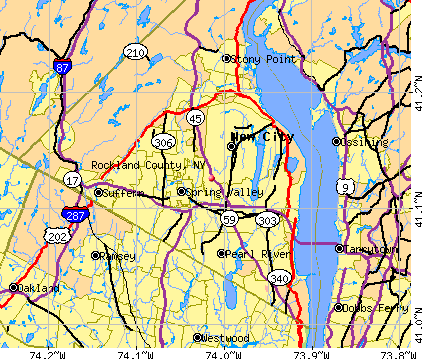
Cities in this county include: Ramapo, Clarkstown, Orangetown, New City, Spring Valley, Nanuet, Pearl River, Monsey, Stony Point, Suffern.
| City or Town | Homes measured | Living Area | Basement | ||
|---|---|---|---|---|---|
| Homes Above 4 pCi/L Best Estimate (%) | Homes Above 4 pCi/L Range (%) | Homes Above 4 pCi/L Best Estimate (%) | Homes Above 4 pCi/L Range (%) | ||
| Clarkstown town | 848 | 1.1 | 0.9 - 1.3 | 10 | 10 - 11 |
| Haverstraw town | 114 | 2 | 1 - 3 | 17 | 15 - 20 |
| Orangetown town | 327 | 1.0 | 0.7 - 1.3 | 11 | 10 - 12 |
| Ramapo town | 685 | 1.4 | 1.1 - 1.7 | 14 | 13 - 15 |
| Stony Point town | 144 | 10 | 8 - 13 | 36 | 33 - 39 |
| Rockland county | 2118 | 1.8 | 15 | ||
2023 air pollution in Rockland County:
Ozone (1-hour): 0.031 ppm (standard limit: 0.12 ppm). Near U.S. average.
Particulate Matter (PM2.5) Annual: 7.1 µg/m3(standard limit: 15.0 µg/m3). Near U.S. average.
Neighboring counties: Orange County  , Sullivan County, Pennsylvania
  , Union County, Pennsylvania .
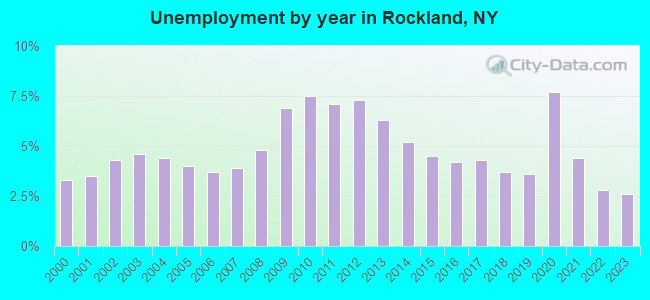
| Here: | 3.5% |
| New York: | 4.4% |
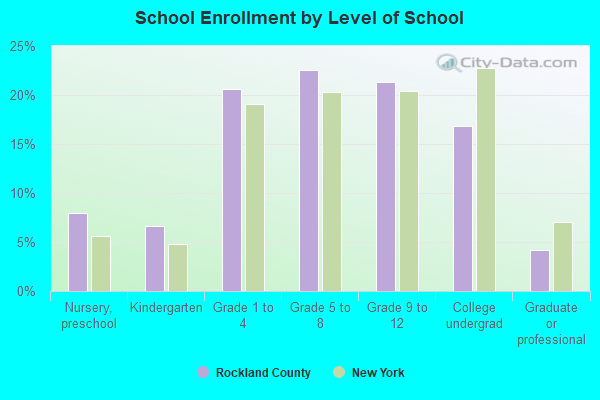
Current college students: 17,843
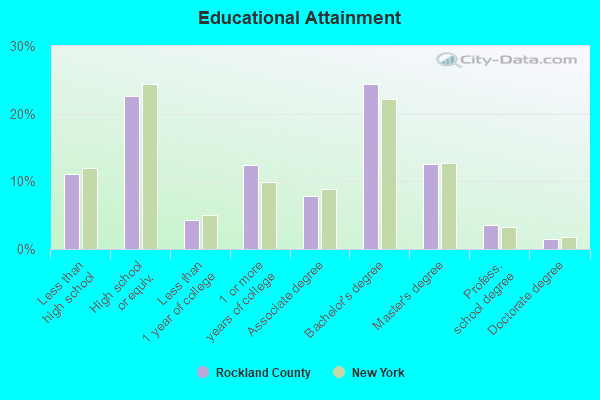
People 25 years of age or older with a high school degree or higher: 87.7%
People 25 years of age or older with a bachelor's degree or higher: 45.3%
Number of foreign born residents: 67,960 (67.9% naturalized citizens)
| Rockland County: | 20.0% |
| Whole state: | 22.7% |
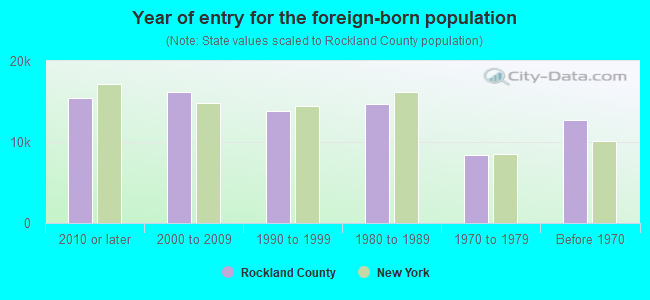
- Year of entry for the foreign-born population
- 19,2522010 or later
- 13,9892000 to 2009
- 10,8451990 to 1999
- 14,6781980 to 1989
- 8,3721970 to 1979
- 12,692Before 1970
Mean travel time to work (commute): minutes
Percentage of county residents living and working in this county: 88.5%
Housing units in structures:
- One, detached: 61,192
- One, attached: 9,155
- Two: 8,118
- 3 or 4: 10,021
- 5 to 9: 6,798
- 10 to 19: 4,700
- 20 to 49: 3,118
- 50 or more: 4,970
- Mobile homes: 862
Housing units in Rockland County with a mortgage: 44,480 (5,198 second mortgage, 0 home equity loan, 4,622 both second mortgage and home equity loan)
Houses without a mortgage: 1,915
| Here: | 97.8% with mortgage |
| State: | 95.5% with mortgage |
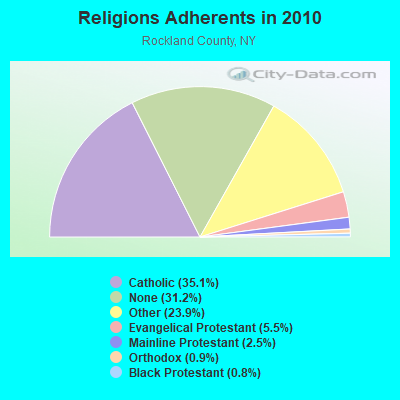
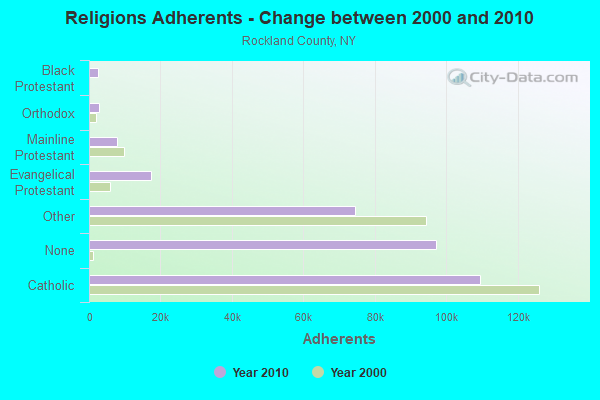
Religion statistics for Rockland County
| Religion | Adherents | Congregations |
|---|---|---|
| Catholic | 109,386 | 21 |
| Other | 74,477 | 136 |
| Evangelical Protestant | 17,221 | 84 |
| Mainline Protestant | 7,852 | 48 |
| Orthodox | 2,909 | 14 |
| Black Protestant | 2,640 | 8 |
| None | 97,202 | - |
Source: Clifford Grammich, Kirk Hadaway, Richard Houseal, Dale E.Jones, Alexei Krindatch, Richie Stanley and Richard H.Taylor. 2012. 2010 U.S.Religion Census: Religious Congregations & Membership Study. Association of Statisticians of American Religious Bodies. Jones, Dale E., et al. 2002. Congregations and Membership in the United States 2000. Nashville, TN: Glenmary Research Center.
Food Environment Statistics:
| Rockland County: | 3.20 / 10,000 pop. |
| State: | 4.13 / 10,000 pop. |
| Here: | 0.07 / 10,000 pop. |
| New York: | 0.06 / 10,000 pop. |
| This county: | 1.21 / 10,000 pop. |
| New York: | 0.92 / 10,000 pop. |
| Rockland County: | 0.98 / 10,000 pop. |
| New York: | 1.68 / 10,000 pop. |
| This county: | 9.70 / 10,000 pop. |
| State: | 8.82 / 10,000 pop. |
| Rockland County: | 8.7% |
| New York: | 8.2% |
| Rockland County: | 24.1% |
| State: | 23.8% |
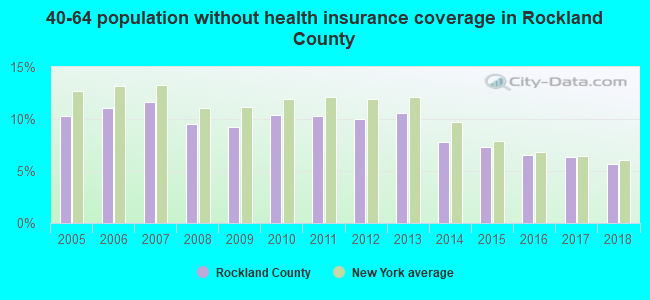
| Here: | 11.0% |
| State: | 15.6% |
Agriculture in Rockland County:
Average value of agricultural products sold per farm: $108,939Average value of crops sold per acre for harvested cropland: $8977.56
The value of nursery, greenhouse, floriculture, and sod as a percentage of the total market value of agricultural products sold: 77.74%
The value of livestock, poultry, and their products as a percentage of the total market value of agricultural products sold: 4.80%
Average total farm production expenses per farm: $111,798
Irrigated harvested cropland as a percentage of land in farms: 18.81%
Average market value of all machinery and equipment per farm: $68,688
The percentage of farms operated by a family or individual: 55.17%
Average age of principal farm operators: 56 years
Milk cows as a percentage of all cattle and calves: 22.22%
Vegetables: 76 harvested acres
Land in orchards: 154 acres
Earthquake activity:
Rockland County-area historical earthquake activity is significantly above New York state average. It is 68% smaller than the overall U.S. average.On 10/7/1983 at 10:18:46, a magnitude 5.3 (5.1 MB, 5.3 LG, 5.1 ML, Class: Moderate, Intensity: VI - VII) earthquake occurred 196.3 miles away from Rockland County center
On 8/23/2011 at 17:51:04, a magnitude 5.8 (5.8 MW, Depth: 3.7 mi) earthquake occurred 305.3 miles away from the county center
On 4/20/2002 at 10:50:47, a magnitude 5.3 (5.3 ML, Depth: 3.0 mi) earthquake occurred 234.8 miles away from the county center
On 4/20/2002 at 10:50:47, a magnitude 5.2 (5.2 MB, 4.2 MS, 5.2 MW, 5.0 MW) earthquake occurred 233.0 miles away from the county center
On 1/16/1994 at 01:49:16, a magnitude 4.6 (4.6 MB, 4.6 LG, Depth: 3.1 mi, Class: Light, Intensity: IV - V) earthquake occurred 119.4 miles away from Rockland County center
On 1/19/1982 at 00:14:42, a magnitude 4.7 (4.5 MB, 4.7 MD, 4.5 LG) earthquake occurred 205.5 miles away from the county center
Magnitude types: regional Lg-wave magnitude (LG), body-wave magnitude (MB), duration magnitude (MD), local magnitude (ML), surface-wave magnitude (MS), moment magnitude (MW)
Most recent natural disasters:
- New York Tropical Storm Isaias, Incident Period: August 4, 2020, FEMA Id: 4567, Natural disaster type: Tropical Storm
- New York Covid-19 Pandemic, Incident Period: January 20, 2020, Major Disaster (Presidential) Declared DR-4480-NY: March 20, 2020, FEMA Id: 4480, Natural disaster type: Other
- New York Hurricane Sandy, Incident Period: October 27, 2012 to November 09, 2012, Emergency Declared EM-3351: October 28, 2012, FEMA Id: 3351, Natural disaster type: Hurricane
- New York Hurricane Sandy, Incident Period: October 27, 2012 to November 09, 2012, Major Disaster (Presidential) Declared DR-4085: October 30, 2012, FEMA Id: 4085, Natural disaster type: Hurricane
- New York Hurricane Irene, Incident Period: August 26, 2011 to September 05, 2011, Major Disaster (Presidential) Declared DR-4020: August 31, 2011, FEMA Id: 4020, Natural disaster type: Hurricane
- New York Hurricane Irene, Incident Period: August 25, 2011 to September 05, 2011, Emergency Declared EM-3328: August 26, 2011, FEMA Id: 3328, Natural disaster type: Hurricane
- New York Severe Storms and Flooding, Incident Period: March 13, 2010 to March 31, 2010, Major Disaster (Presidential) Declared DR-1899: April 16, 2010, FEMA Id: 1899, Natural disaster type: Storm, Flood
- New York Severe Storms and Inland and Coastal Flooding, Incident Period: April 14, 2007 to April 18, 2007, Major Disaster (Presidential) Declared DR-1692: April 24, 2007, FEMA Id: 1692, Natural disaster type: Storm, Flood
- New York Hurricane Katrina Evacuation, Incident Period: August 29, 2005 to October 01, 2005, Emergency Declared EM-3262: September 30, 2005, FEMA Id: 3262, Natural disaster type: Hurricane
- New York Power Outage, Incident Period: August 14, 2003 to August 16, 2003, Emergency Declared EM-3186: August 23, 2003, FEMA Id: 3186, Natural disaster type: Power Outage
- 13 other natural disasters have been reported since 1953.
The number of natural disasters in Rockland County (23) is greater than the US average (15).
Major Disasters (Presidential) Declared: 14
Emergencies Declared: 8
Causes of natural disasters: Hurricanes: 7, Floods: 6, Storms: 6, Blizzards: 2, Heavy Rains: 2, Tropical Storms: 2, Landslide: 1, Power Outage: 1, Snowstorm: 1, Water Shortage: 1, Other: 3 (Note: some incidents may be assigned to more than one category).
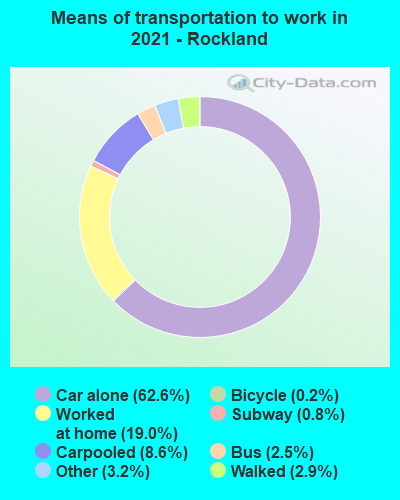
Means of transportation to work:
- Drove a car alone: 75,496 (60.6%)
- Carpooled: 12,408 (10.0%)
- Bus: 2,956 (2.4%)
- Subway or elevated rail: 364 (0.3%)
- Long-distance train or commuter rail: 343 (0.3%)
- Taxicab, motorcycle, or other means: 4,224 (3.4%)
- Bicycle: 188 (0.2%)
- Walked: 6,002 (4.8%)
- Worked at home: 22,597 (18.1%)
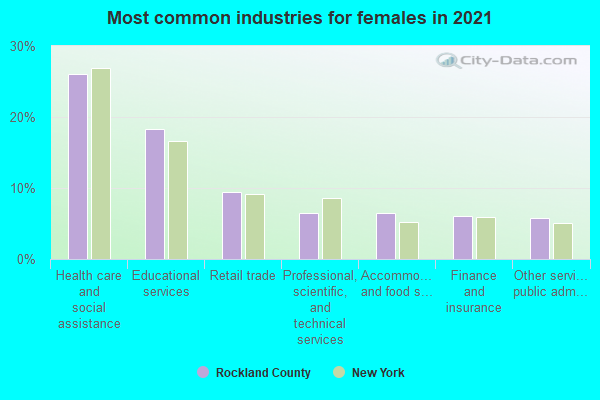
- Health care and social assistance (28%)
- Educational services (19%)
- Retail trade (9%)
- Other services, except public administration (6%)
- Professional, scientific, and technical services (6%)
- Finance and insurance (4%)
- Manufacturing (4%)
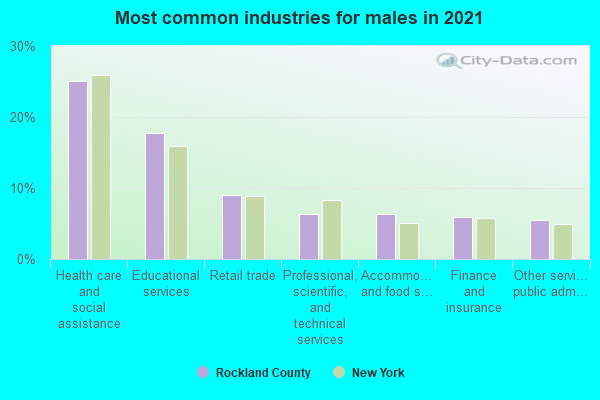
- Health care and social assistance (29%)
- Educational services (20%)
- Retail trade (9%)
- Other services, except public administration (7%)
- Professional, scientific, and technical services (7%)
- Finance and insurance (4%)
- Manufacturing (4%)
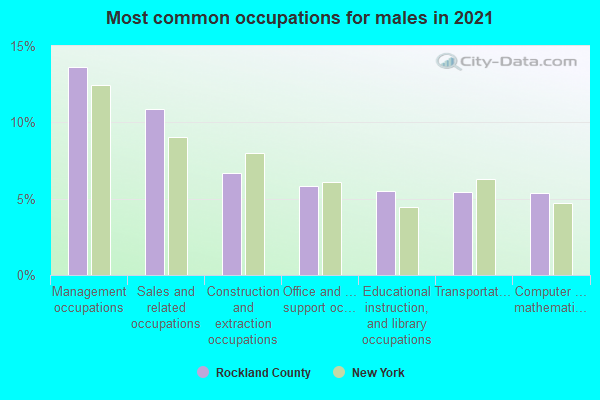
- Management occupations (14%)
- Sales and related occupations (11%)
- Educational instruction, and library occupations (8%)
- Office and administrative support occupations (7%)
- Business and financial operations occupations (7%)
- Construction and extraction occupations (5%)
- Installation, maintenance, and repair occupations (4%)
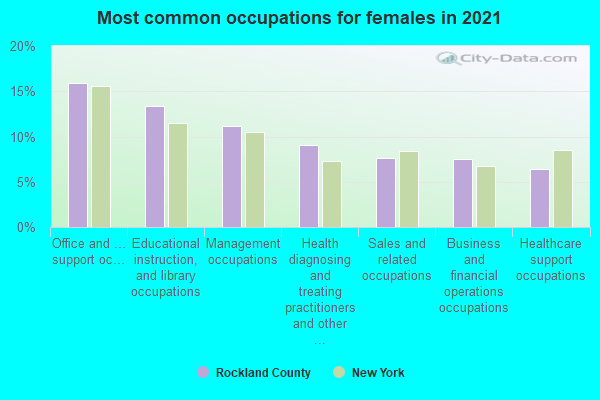
- Educational instruction, and library occupations (14%)
- Office and administrative support occupations (14%)
- Health diagnosing and treating practitioners and other technical occupations (12%)
- Management occupations (10%)
- Sales and related occupations (10%)
- Business and financial operations occupations (6%)
- Healthcare support occupations (6%)
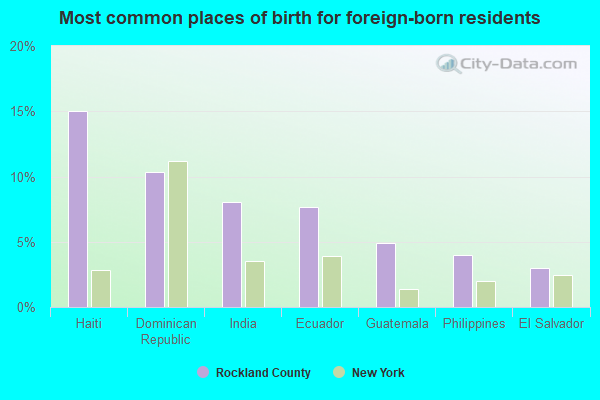
- Haiti (14%)
- Ecuador (10%)
- Dominican Republic (9%)
- India (7%)
- Guatemala (6%)
- Philippines (5%)
- Jamaica (3%)
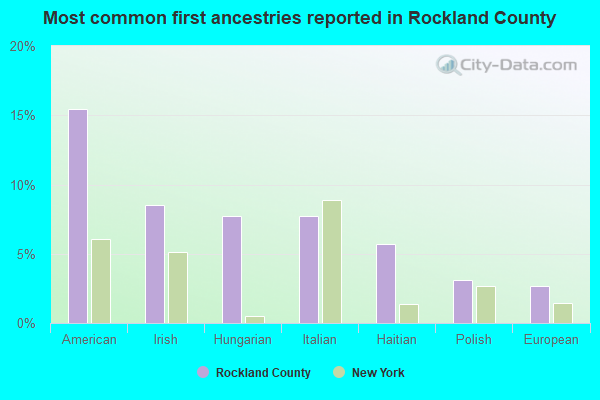
- American (15%)
- Irish (8%)
- Hungarian (8%)
- Italian (7%)
- Haitian (5%)
- Polish (3%)
- European (3%)
People in group quarters in Rockland County, New York in 2010:
- 1,821 people in college/university student housing
- 1,589 people in nursing facilities/skilled-nursing facilities
- 1,488 people in group homes intended for adults
- 740 people in other noninstitutional facilities
- 432 people in mental (psychiatric) hospitals and psychiatric units in other hospitals
- 427 people in workers' group living quarters and job corps centers
- 296 people in residential treatment centers for adults
- 192 people in local jails and other municipal confinement facilities
- 111 people in residential schools for people with disabilities
- 43 people in emergency and transitional shelters (with sleeping facilities) for people experiencing homelessness
- 27 people in group homes for juveniles (non-correctional)
- 17 people in residential treatment centers for juveniles (non-correctional)
People in group quarters in Rockland County, New York in 2000:
- 2,099 people in nursing homes
- 1,380 people in college dormitories (includes college quarters off campus)
- 788 people in homes for the mentally retarded
- 611 people in other noninstitutional group quarters
- 586 people in mental (psychiatric) hospitals or wards
- 478 people in religious group quarters
- 471 people in homes for the mentally ill
- 246 people in other group homes
- 224 people in residential treatment centers for emotionally disturbed children
- 193 people in local jails and other confinement facilities (including police lockups)
- 142 people in homes for abused, dependent, and neglected children
- 136 people in other nonhousehold living situations
- 87 people in homes or halfway houses for drug/alcohol abuse
- 46 people in training schools for juvenile delinquents
- 42 people in hospitals or wards for drug/alcohol abuse
- 36 people in homes for the physically handicapped
- 34 people in other workers' dormitories
- 19 people in orthopedic wards and institutions for the physically handicapped
- 18 people in schools, hospitals, or wards for the intellectually disabled
- 13 people in unknown juvenile institutions
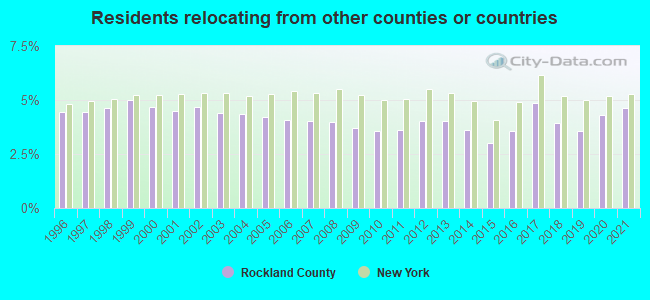
4.61% of this county's 2021 resident taxpayers lived in other counties in 2020 ($91,477 average adjusted gross income)
| Here: | 4.61% |
| New York average: | 5.29% |
10 or fewer of this county's residents moved from foreign countries.
3.10% relocated from other counties in New York ($64,257 average AGI)
1.50% relocated from other states ($27,220 average AGI)
Rockland County: 1.50% New York average: 1.86%
Top counties from which taxpayers relocated into this county between 2020 and 2021:
| from Bronx County, NY | |
| from Kings County, NY | |
| from Westchester County, NY | |
| from New York County, NY | |
| from Orange County, NY | |
| from Bergen County, NJ | |
| from Queens County, NY |
5.89% of this county's 2020 resident taxpayers moved to other counties in 2021 ($101,456 average adjusted gross income)
| Here: | 5.89% |
| New York average: | 6.93% |
0.02% of residents moved to foreign countries ($114 average AGI)
Rockland County: 0.02% New York average: 0.02%
2.15% relocated to other counties in New York ($30,047 average AGI)
3.72% relocated to other states ($71,294 average AGI)
Rockland County: 3.72% New York average: 3.55%

Top counties to which taxpayers relocated from this county between 2020 and 2021:
| to Bergen County, NJ | |
| to Orange County, NY | |
| to Westchester County, NY | |
| to New York County, NY | |
| to Palm Beach County, FL | |
| to Kings County, NY | |
| to Bronx County, NY |
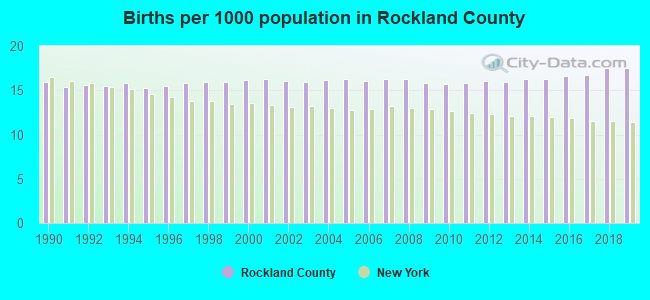
Births per 1000 population from 1990 to 1999: 15.7
Births per 1000 population from 2000 to 2009: 16.1
Births per 1000 population from 2010 to 2022: 14.0
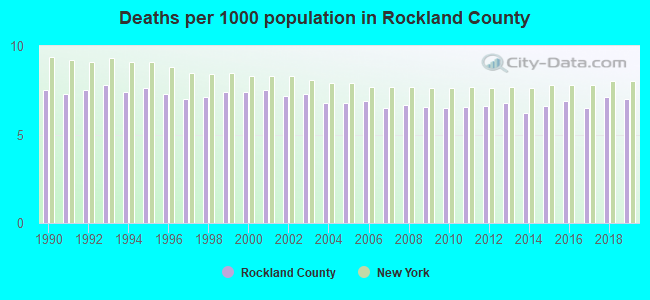
Deaths per 1000 population from 1990 to 1999: 7.4
Deaths per 1000 population from 2000 to 2009: 7.0
Deaths per 1000 population from 2010 to 2020: 7.0
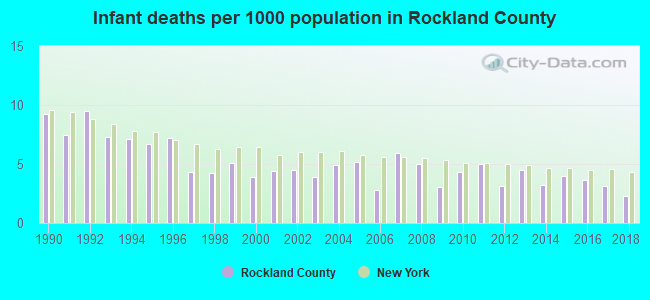
Infant deaths per 1000 live births from 1990 to 1999: 6.8
Infant deaths per 1000 live births from 2000 to 2009: 4.4
Infant deaths per 1000 live births from 2010 to 2021: 3.5
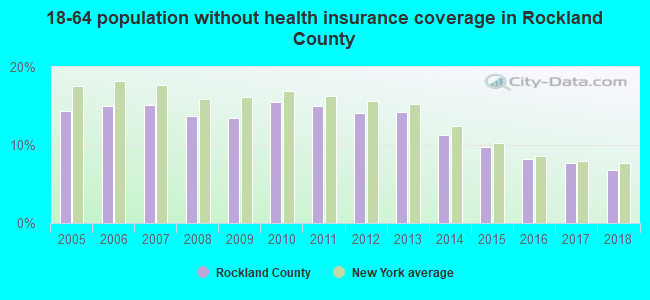
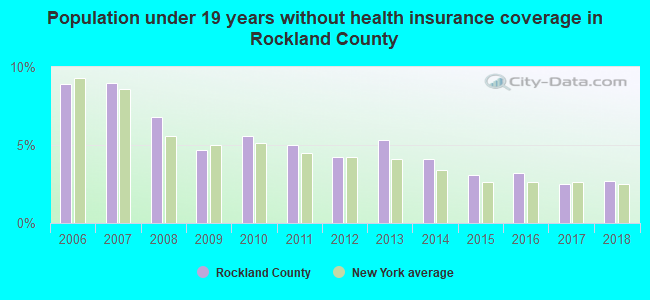
Persons under 19 years old without health insurance coverage in 2018: 2.7%
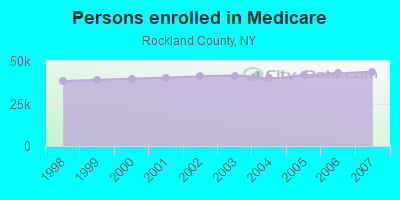
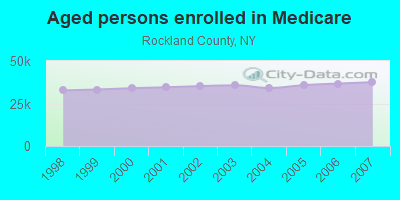
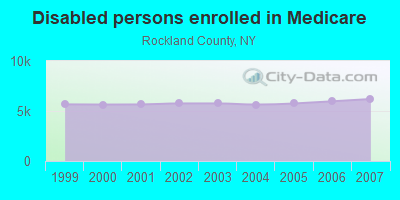
Persons enrolled in hospital insurance and/or supplemental medical insurance (Medicare) in July 1, 2007: 43,775 (37,576 aged, 6,199 disabled)
Children under 18 without health insurance coverage in 2007: 6,508 (8%)
Most common underlying causes of death in Rockland County, New York in 1999 - 2019:
- Atherosclerotic heart disease (5,515)
- Acute myocardial infarction, unspecified (3,952)
- Bronchus or lung, unspecified - Malignant neoplasms (2,351)
- Pneumonia, unspecified (1,579)
- Chronic obstructive pulmonary disease, unspecified (1,426)
- Septicaemia, unspecified (1,227)
- Stroke, not specified as haemorrhage or infarction (1,038)
- Breast, unspecified - Malignant neoplasms (832)
- Colon, unspecified - Malignant neoplasms (807)
- Pancreas, unspecified - Malignant neoplasms (805)
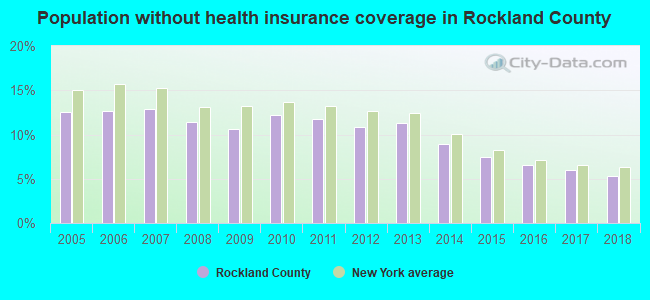
Population without health insurance coverage in 2000: 13%
Children under 18 without health insurance coverage in 2000: 10%
Short term general hospital admissions per 100,000 population in 2004: 8,700
Short term general hospital beds per 100,000 population in 2004: 204
Emergency room visits per 100,000 population in 2004: 16,144
General practice office based MDs per 100,000 population in 2005: 1,631
Medical specialist MDs per 100,000 population in 2005: 679
Dentists per 100,000 population in 1998: 12
Total births per 100,000 population, July 2005 - July 2006 : 94
Total deaths per 100,000 population, July 2005 - July 2006: 90
Limited-service eating places per 100,000 population in 2005 : 15
Beer, wine & liquor stores per 100,000 population in 2005: 1
EPA green book nonattainment status in 2004-2006: 1
Suicides per 1,000,000 population from 2000 to 2006: 37.8. This is less than state average.
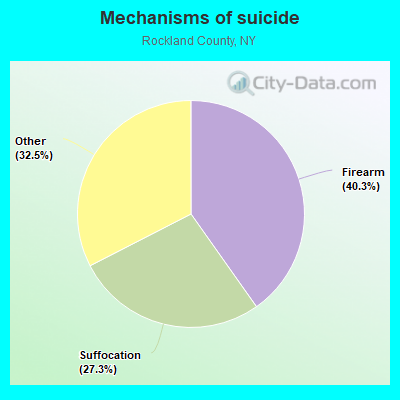
- Firearm - 15.2
- Suffocation - 10.3
- Other - 12.3
Household type by relationship:
Households: 339,022- Male householders: 56,751 (10,727 living alone), Female householders: 47,252 (14,280 living alone)
61,480 spouses (60,892 opposite-sex spouses), 4,390 unmarried partners, (4,260 opposite-sex unmarried partners), 133,214 children (130,175 natural, 1,722 adopted, 1,317 stepchildren), 5,834 grandchildren, 3,223 brothers or sisters, 5,093 parents, 316 foster children, 7,791 other relatives, 6,636 non-relatives
- In group quarters: 7,042
Size of family households: 25,981 2-persons, 15,618 3-persons, 13,660 4-persons, 8,464 5-persons, 5,203 6-persons, 6,535 7-or-more-persons.
Size of nonfamily households: 25,007 1-person, 2,995 2-persons, 387 3-persons, 69 4-persons, 84 6-persons.
82,946 married couples with children.
9,422 single-parent households (1,607 men, 7,815 women).
58.6% of residents of Rockland speak English at home.
12.9% of residents speak Spanish at home (53% speak English very well, 19% speak English well, 24% speak English not well, 4% don't speak English at all).
22.4% of residents speak other Indo-European language at home (44% speak English very well, 32% speak English well, 18% speak English not well, 6% don't speak English at all).
4.3% of residents speak Asian or Pacific Island language at home (69% speak English very well, 22% speak English well, 9% speak English not well).
1.8% of residents speak other language at home (79% speak English very well, 14% speak English well, 6% speak English not well, 1% don't speak English at all).
In fiscal year 2004:
Federal Government expenditure: $1,525,709,000 ($5,196 per capita)
Department of Defense expenditure: $109,343,000
Federal direct payments to individuals for retirement and disability: $620,094,000
Federal other direct payments to individuals: $354,703,000
Federal direct payments not to individuals: $2,583,000
Federal grants: $376,408,000
Federal procurement contracts: $110,596,000 ($86,889,000 Department of Defense)
Federal salaries and wages: $61,325,000 ($16,669,000 Department of Defense)
Federal Government direct loans: $0,000
Federal guaranteed/insured loans: $35,884,000
Federal Government insurance: $225,054,000
Population change from April 1, 2000 to July 1, 2005:
Births: 23,643| Here: | 81 per 1000 residents |
| State: | 70 per 1000 residents |
Deaths: 10,987
| Here: | 38 per 1000 residents |
| State: | 42 per 1000 residents |
Net international migration: +8,273
| Here: | +28 per 1000 residents |
| State: | +35 per 1000 residents |
Net internal migration: -14,320
| Here: | |
| State: |
Total withdrawal of fresh water for public supply: 25.25 millions of gallons per day (86% from ground, 14% from surface)
| Here: | 7.3 |
| State: | 6.3 |
| Here: | 4.1 |
| State: | 3.8 |
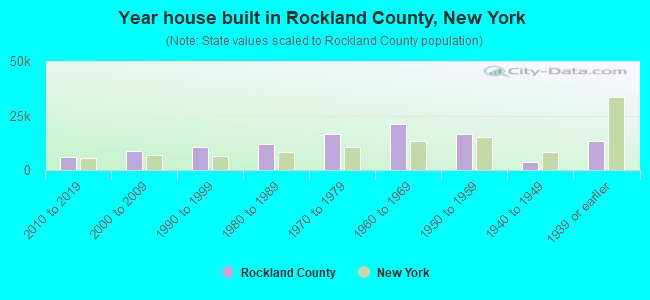
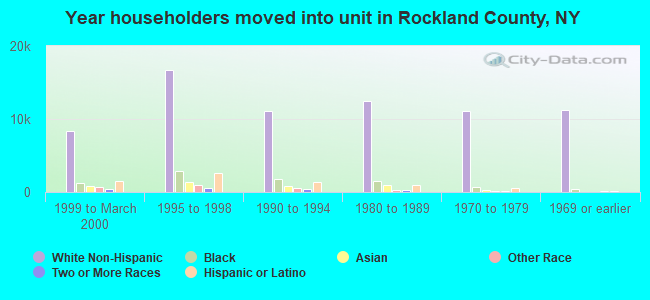
- Year house built in Rockland County, New York
- 1,5772020 or later
- 6,8582010 to 2019
- 6,2042000 to 2009
- 7,4851990 to 1999
- 12,9451980 to 1989
- 21,4071970 to 1979
- 23,4401960 to 1969
- 14,2951950 to 1959
- 3,5311940 to 1949
- 11,1921939 or earlier

- Rooms in owner-occupied houses in Rockland County, New York
- 551 room
- 5802 rooms
- 3,2123 rooms
- 4,3234 rooms
- 6,8635 rooms
- 11,1786 rooms
- 12,4397 rooms
- 12,8848 rooms
- 19,8809+ rooms
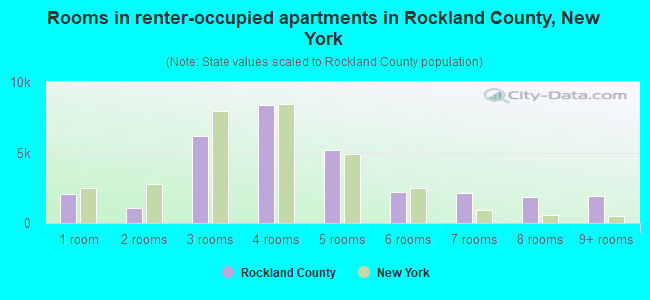
- Rooms in renter-occupied apartments in Rockland County, New York
- 1,2611 room
- 1,8052 rooms
- 8,6043 rooms
- 7,6004 rooms
- 4,1355 rooms
- 3,6246 rooms
- 2,6467 rooms
- 7228 rooms
- 2,1929+ rooms
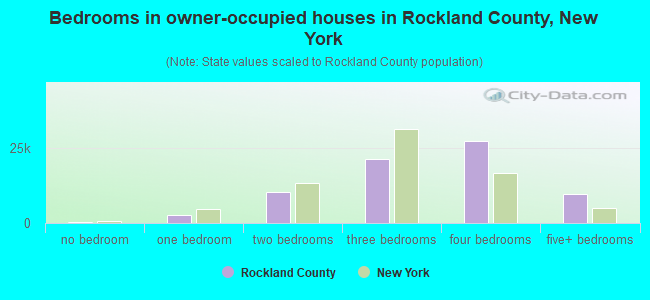
- Bedrooms in owner-occupied houses in Rockland County, New York
- 135no bedroom
- 3,8821 bedroom
- 10,1182 bedrooms
- 19,9273 bedrooms
- 25,6394 bedrooms
- 11,7135+ bedrooms

- Bedrooms in renter-occupied apartments in Rockland County, New York
- 1,312no bedroom
- 12,5801 bedroom
- 7,9722 bedrooms
- 3,8433 bedrooms
- 4,1664 bedrooms
- 2,7165+ bedrooms
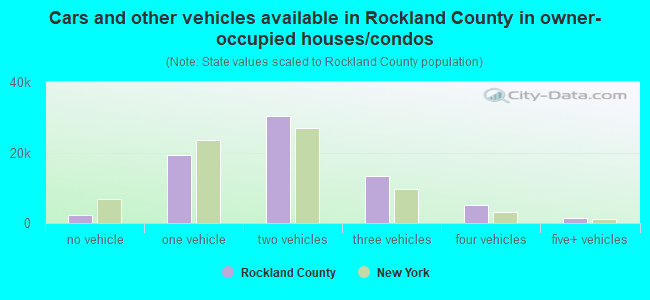
- Cars and other vehicles available in Rockland County in owner-occupied houses/condos
- 2,197no vehicle
- 19,2251 vehicle
- 32,6642 vehicles
- 11,6853 vehicles
- 3,8034 vehicles
- 1,8405+ vehicles
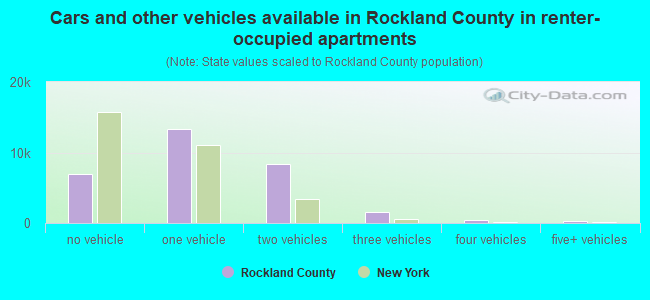
- Cars and other vehicles available in Rockland County in renter-occupied apartments
- 8,160no vehicle
- 14,7281 vehicle
- 6,4492 vehicles
- 2,4893 vehicles
- 5674 vehicles
- 1965+ vehicles
92.6% of Rockland County residents lived in the same house 1 years ago.
Out of people who lived in different houses, 35% lived in this county.
Out of people who lived in different counties, 73% lived in New York.
| Rockland County: | 92.6% |
| State average: | 89.6% |
Place of birth for U.S.-born residents:
- This state: 222,811
- Other state: 39,433
- Northeast: 26,928
- Midwest: 3,119
- South: 6,814
- West: 2,572
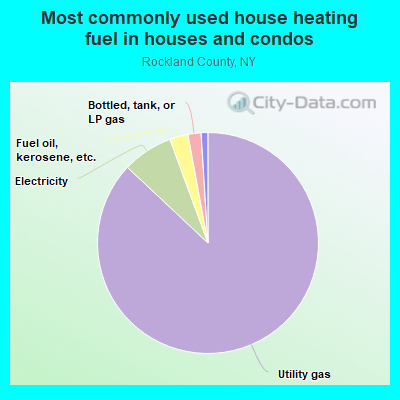
- 88.7%Utility gas
- 6.8%Electricity
- 2.4%Fuel oil, kerosene, etc.
- 0.9%Bottled, tank, or LP gas
- 0.5%Other fuel
- 0.4%Wood
- 0.2%No fuel used
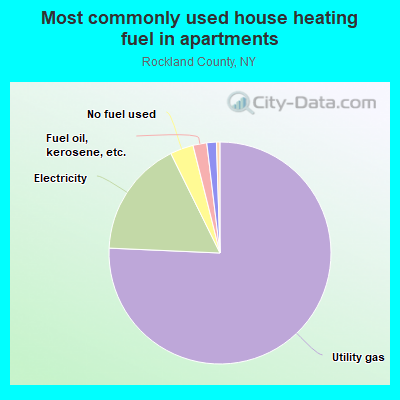
- 74.5%Utility gas
- 17.1%Electricity
- 3.8%Bottled, tank, or LP gas
- 2.2%No fuel used
- 1.3%Other fuel
- 1.2%Fuel oil, kerosene, etc.
Private vs. public school enrollment:
| Here: | 49.7% |
| New York: | 15.6% |
| Here: | 42.0% |
| New York: | 15.0% |
| Here: | 53.5% |
| New York: | 39.2% |
Rockland County government finances - Expenditure in 2018:
- Assistance and Subsidies - Public Welfare, Federal Categorical Assistance Programs: $7,596,000
Public Welfare, Cash Assistance Programs - Other: $5,721,000
Public Welfare, Federal Categorical Assistance Programs: $5,665,000
Public Welfare, Cash Assistance Programs - Other: $5,124,000
- Bond Funds - Cash and Securities: $111,753,000
Cash and Securities: $64,628,000
- Charges - Higher Education - Other: $19,951,000
Higher Education - Other: $16,889,000
Other: $16,666,000
Other: $11,040,000
Sewerage: $1,414,000
Sewerage: $1,247,000
Parks and Recreation: $29,000
Parks and Recreation: $28,000
- Construction - Sewerage: $10,907,000
Regular Highways: $10,775,000
Regular Highways: $10,119,000
General - Other: $9,441,000
General - Other: $5,626,000
Other Higher Education: $3,367,000
Health - Other: $2,473,000
Natural Resources - Other: $2,286,000
Sewerage: $2,056,000
Natural Resources - Other: $1,549,000
Health - Other: $1,530,000
Parks and Recreation: $1,379,000
Local Fire Protection: $1,241,000
Parks and Recreation: $124,000
Local Fire Protection: $95,000
- Current Operations - Health - Other: $88,559,000
Health - Other: $85,364,000
General - Other: $75,197,000
General - Other: $74,969,000
Other Higher Education: $72,142,000
Public Welfare - Other: $71,931,000
Other Higher Education: $71,331,000
Public Welfare - Other: $69,955,000
Police Protection: $39,770,000
Police Protection: $35,820,000
Correctional Institutions: $33,737,000
Correctional Institutions: $31,286,000
Transit Utilities: $26,591,000
Sewerage: $26,226,000
Transit Utilities: $24,642,000
Sewerage: $23,966,000
Judicial and Legal Services: $22,449,000
Judicial and Legal Services: $21,580,000
Central Staff Services: $20,206,000
Central Staff Services: $17,853,000
Regular Highways: $13,794,000
Regular Highways: $13,155,000
Corrections - Other: $10,603,000
Corrections - Other: $10,511,000
Financial Administration: $8,246,000
Financial Administration: $7,911,000
General Public Buildings: $6,934,000
General Public Buildings: $6,880,000
Local Fire Protection: $3,699,000
Local Fire Protection: $3,441,000
Housing and Community Development: $2,727,000
Parks and Recreation: $1,881,000
Parks and Recreation: $1,679,000
Public Welfare, Vendor Payments for Other Purposes: $173,000
Natural Resources - Other: $151,000
Public Welfare, Vendor Payments for Other Purposes: $149,000
Public Welfare, Vendor Payments for Medical Care: $97,000
Natural Resources - Other: $78,000
Housing and Community Development: $68,000
Public Welfare, Vendor Payments for Medical Care: $42,000
- Federal Intergovernmental - Highways: $3,600,000
Housing and Community Development: $3,406,000
Housing and Community Development: $3,095,000
Highways: $2,075,000
Other: $1,114,000
Other: $1,098,000
- General - Interest on Debt: $48,449,000
Interest on Debt: $40,968,000
- Intergovernmental to Local - Other - General - Other: $22,867,000
Other - General - Other: $18,408,000
- Intergovernmental to State - Public Welfare - Categorical Assistance Programs: $65,426,000
Public Welfare - Categorical Assistance Programs: $65,294,000
Transit Utilities: $2,049,000
Transit Utilities: $1,818,000
- Local Intergovernmental - Education: $20,609,000
Education: $20,280,000
Highways: $3,978,000
Highways: $3,524,000
Other: $978,000
Other: $887,000
Sewerage: $54,000
Sewerage: $41,000
- Long Term Debt - Beginning Outstanding - Unspecified Public Purpose: $544,488,000
Beginning Outstanding - Unspecified Public Purpose: $508,657,000
Outstanding Unspecified Public Purpose: $506,920,000
Outstanding Unspecified Public Purpose: $497,155,000
Retired Unspecified Public Purpose: $63,762,000
Issue, Unspecified Public Purpose: $62,025,000
Beginning Outstanding - Public Debt for Private Purpose: $57,175,000
Outstanding Nonguaranteed - Industrial Revenue: $52,425,000
Beginning Outstanding - Public Debt for Private Purpose: $47,675,000
Retired Unspecified Public Purpose: $47,333,000
Outstanding Nonguaranteed - Industrial Revenue: $42,925,000
Retired Nonguaranteed - Public Debt for Private Purpose: $4,750,000
Retired Nonguaranteed - Public Debt for Private Purpose: $4,750,000
- Miscellaneous - General Revenue - Other: $13,527,000
General Revenue - Other: $13,084,000
Interest Earnings: $4,916,000
Interest Earnings: $1,163,000
Fines and Forfeits: $1,141,000
Fines and Forfeits: $1,039,000
Rents: $87,000
Rents: $81,000
Donations From Private Sources: $7,000
Donations From Private Sources: $2,000
- Other Capital Outlay - Police Protection: $842,000
Police Protection: $463,000
Sewerage: $396,000
Health - Other: $95,000
Sewerage: $90,000
Correctional Institutions: $79,000
Public Welfare - Other: $76,000
Correctional Institutions: $63,000
General - Other: $56,000
Other Higher Education: $45,000
General - Other: $35,000
Central Staff Services: $28,000
Health - Other: $28,000
Local Fire Protection: $26,000
Judicial and Legal Services: $3,000
Transit Utilities: $2,000
- Other Funds - Cash and Securities: $156,554,000
Cash and Securities: $82,937,000
- Revenue - Transit Utilities: $4,540,000
Transit Utilities: $3,585,000
- Short Term Debt Outstanding - Beginning: $60,255,000
End of Fiscal Year: $60,237,000
Beginning: $60,000,000
End of Fiscal Year: $58,573,000
- Sinking Funds - Cash and Securities: $72,553,000
Cash and Securities: $71,947,000
- State Intergovernmental - Public Welfare: $57,535,000
Public Welfare: $53,921,000
Health and Hospitals: $40,528,000
Health and Hospitals: $40,351,000
Education: $20,797,000
Education: $20,734,000
Transit Utilities: $16,072,000
Transit Utilities: $15,894,000
Other: $14,816,000
Other: $12,707,000
Highways: $4,446,000
Highways: $4,310,000
- Tax - General Sales and Gross Receipts: $230,855,000
General Sales and Gross Receipts: $204,321,000
Property: $172,413,000
Property: $167,692,000
Public Utilities Sales: $10,907,000
Public Utilities Sales: $9,079,000
Other: $5,864,000
Other: $5,225,000
Other Selective Sales: $3,288,000
Other Selective Sales: $3,173,000
Other License: $1,300,000
Other License: $1,049,000
- Total Salaries and Wages: $142,099,000
: $133,136,000
Rockland County government finances - Revenue in 2018:
- Assistance and Subsidies - Public Welfare, Federal Categorical Assistance Programs: $7,596,000
Public Welfare, Cash Assistance Programs - Other: $5,721,000
Public Welfare, Federal Categorical Assistance Programs: $5,665,000
Public Welfare, Cash Assistance Programs - Other: $5,124,000
- Bond Funds - Cash and Securities: $111,753,000
Cash and Securities: $64,628,000
- Charges - Higher Education - Other: $19,951,000
Higher Education - Other: $16,889,000
Other: $16,666,000
Other: $11,040,000
Sewerage: $1,414,000
Sewerage: $1,247,000
Parks and Recreation: $29,000
Parks and Recreation: $28,000
- Construction - Sewerage: $10,907,000
Regular Highways: $10,775,000
Regular Highways: $10,119,000
General - Other: $9,441,000
General - Other: $5,626,000
Other Higher Education: $3,367,000
Health - Other: $2,473,000
Natural Resources - Other: $2,286,000
Sewerage: $2,056,000
Natural Resources - Other: $1,549,000
Health - Other: $1,530,000
Parks and Recreation: $1,379,000
Local Fire Protection: $1,241,000
Parks and Recreation: $124,000
Local Fire Protection: $95,000
- Current Operations - Health - Other: $88,559,000
Health - Other: $85,364,000
General - Other: $75,197,000
General - Other: $74,969,000
Other Higher Education: $72,142,000
Public Welfare - Other: $71,931,000
Other Higher Education: $71,331,000
Public Welfare - Other: $69,955,000
Police Protection: $39,770,000
Police Protection: $35,820,000
Correctional Institutions: $33,737,000
Correctional Institutions: $31,286,000
Transit Utilities: $26,591,000
Sewerage: $26,226,000
Transit Utilities: $24,642,000
Sewerage: $23,966,000
Judicial and Legal Services: $22,449,000
Judicial and Legal Services: $21,580,000
Central Staff Services: $20,206,000
Central Staff Services: $17,853,000
Regular Highways: $13,794,000
Regular Highways: $13,155,000
Corrections - Other: $10,603,000
Corrections - Other: $10,511,000
Financial Administration: $8,246,000
Financial Administration: $7,911,000
General Public Buildings: $6,934,000
General Public Buildings: $6,880,000
Local Fire Protection: $3,699,000
Local Fire Protection: $3,441,000
Housing and Community Development: $2,727,000
Parks and Recreation: $1,881,000
Parks and Recreation: $1,679,000
Public Welfare, Vendor Payments for Other Purposes: $173,000
Natural Resources - Other: $151,000
Public Welfare, Vendor Payments for Other Purposes: $149,000
Public Welfare, Vendor Payments for Medical Care: $97,000
Natural Resources - Other: $78,000
Housing and Community Development: $68,000
Public Welfare, Vendor Payments for Medical Care: $42,000
- Federal Intergovernmental - Highways: $3,600,000
Housing and Community Development: $3,406,000
Housing and Community Development: $3,095,000
Highways: $2,075,000
Other: $1,114,000
Other: $1,098,000
- General - Interest on Debt: $48,449,000
Interest on Debt: $40,968,000
- Intergovernmental to Local - Other - General - Other: $22,867,000
Other - General - Other: $18,408,000
- Intergovernmental to State - Public Welfare - Categorical Assistance Programs: $65,426,000
Public Welfare - Categorical Assistance Programs: $65,294,000
Transit Utilities: $2,049,000
Transit Utilities: $1,818,000
- Local Intergovernmental - Education: $20,609,000
Education: $20,280,000
Highways: $3,978,000
Highways: $3,524,000
Other: $978,000
Other: $887,000
Sewerage: $54,000
Sewerage: $41,000
- Long Term Debt - Beginning Outstanding - Unspecified Public Purpose: $544,488,000
Beginning Outstanding - Unspecified Public Purpose: $508,657,000
Outstanding Unspecified Public Purpose: $506,920,000
Outstanding Unspecified Public Purpose: $497,155,000
Retired Unspecified Public Purpose: $63,762,000
Issue, Unspecified Public Purpose: $62,025,000
Beginning Outstanding - Public Debt for Private Purpose: $57,175,000
Outstanding Nonguaranteed - Industrial Revenue: $52,425,000
Beginning Outstanding - Public Debt for Private Purpose: $47,675,000
Retired Unspecified Public Purpose: $47,333,000
Outstanding Nonguaranteed - Industrial Revenue: $42,925,000
Retired Nonguaranteed - Public Debt for Private Purpose: $4,750,000
Retired Nonguaranteed - Public Debt for Private Purpose: $4,750,000
- Miscellaneous - General Revenue - Other: $13,527,000
General Revenue - Other: $13,084,000
Interest Earnings: $4,916,000
Interest Earnings: $1,163,000
Fines and Forfeits: $1,141,000
Fines and Forfeits: $1,039,000
Rents: $87,000
Rents: $81,000
Donations From Private Sources: $7,000
Donations From Private Sources: $2,000
- Other Capital Outlay - Police Protection: $842,000
Police Protection: $463,000
Sewerage: $396,000
Health - Other: $95,000
Sewerage: $90,000
Correctional Institutions: $79,000
Public Welfare - Other: $76,000
Correctional Institutions: $63,000
General - Other: $56,000
Other Higher Education: $45,000
General - Other: $35,000
Central Staff Services: $28,000
Health - Other: $28,000
Local Fire Protection: $26,000
Judicial and Legal Services: $3,000
Transit Utilities: $2,000
- Other Funds - Cash and Securities: $156,554,000
Cash and Securities: $82,937,000
- Revenue - Transit Utilities: $4,540,000
Transit Utilities: $3,585,000
- Short Term Debt Outstanding - Beginning: $60,255,000
End of Fiscal Year: $60,237,000
Beginning: $60,000,000
End of Fiscal Year: $58,573,000
- Sinking Funds - Cash and Securities: $72,553,000
Cash and Securities: $71,947,000
- State Intergovernmental - Public Welfare: $57,535,000
Public Welfare: $53,921,000
Health and Hospitals: $40,528,000
Health and Hospitals: $40,351,000
Education: $20,797,000
Education: $20,734,000
Transit Utilities: $16,072,000
Transit Utilities: $15,894,000
Other: $14,816,000
Other: $12,707,000
Highways: $4,446,000
Highways: $4,310,000
- Tax - General Sales and Gross Receipts: $230,855,000
General Sales and Gross Receipts: $204,321,000
Property: $172,413,000
Property: $167,692,000
Public Utilities Sales: $10,907,000
Public Utilities Sales: $9,079,000
Other: $5,864,000
Other: $5,225,000
Other Selective Sales: $3,288,000
Other Selective Sales: $3,173,000
Other License: $1,300,000
Other License: $1,049,000
- Total Salaries and Wages: $142,099,000
: $133,136,000
Rockland County government finances - Debt in 2018:
- Assistance and Subsidies - Public Welfare, Federal Categorical Assistance Programs: $7,596,000
Public Welfare, Cash Assistance Programs - Other: $5,721,000
Public Welfare, Federal Categorical Assistance Programs: $5,665,000
Public Welfare, Cash Assistance Programs - Other: $5,124,000
- Bond Funds - Cash and Securities: $111,753,000
Cash and Securities: $64,628,000
- Charges - Higher Education - Other: $19,951,000
Higher Education - Other: $16,889,000
Other: $16,666,000
Other: $11,040,000
Sewerage: $1,414,000
Sewerage: $1,247,000
Parks and Recreation: $29,000
Parks and Recreation: $28,000
- Construction - Sewerage: $10,907,000
Regular Highways: $10,775,000
Regular Highways: $10,119,000
General - Other: $9,441,000
General - Other: $5,626,000
Other Higher Education: $3,367,000
Health - Other: $2,473,000
Natural Resources - Other: $2,286,000
Sewerage: $2,056,000
Natural Resources - Other: $1,549,000
Health - Other: $1,530,000
Parks and Recreation: $1,379,000
Local Fire Protection: $1,241,000
Parks and Recreation: $124,000
Local Fire Protection: $95,000
- Current Operations - Health - Other: $88,559,000
Health - Other: $85,364,000
General - Other: $75,197,000
General - Other: $74,969,000
Other Higher Education: $72,142,000
Public Welfare - Other: $71,931,000
Other Higher Education: $71,331,000
Public Welfare - Other: $69,955,000
Police Protection: $39,770,000
Police Protection: $35,820,000
Correctional Institutions: $33,737,000
Correctional Institutions: $31,286,000
Transit Utilities: $26,591,000
Sewerage: $26,226,000
Transit Utilities: $24,642,000
Sewerage: $23,966,000
Judicial and Legal Services: $22,449,000
Judicial and Legal Services: $21,580,000
Central Staff Services: $20,206,000
Central Staff Services: $17,853,000
Regular Highways: $13,794,000
Regular Highways: $13,155,000
Corrections - Other: $10,603,000
Corrections - Other: $10,511,000
Financial Administration: $8,246,000
Financial Administration: $7,911,000
General Public Buildings: $6,934,000
General Public Buildings: $6,880,000
Local Fire Protection: $3,699,000
Local Fire Protection: $3,441,000
Housing and Community Development: $2,727,000
Parks and Recreation: $1,881,000
Parks and Recreation: $1,679,000
Public Welfare, Vendor Payments for Other Purposes: $173,000
Natural Resources - Other: $151,000
Public Welfare, Vendor Payments for Other Purposes: $149,000
Public Welfare, Vendor Payments for Medical Care: $97,000
Natural Resources - Other: $78,000
Housing and Community Development: $68,000
Public Welfare, Vendor Payments for Medical Care: $42,000
- Federal Intergovernmental - Highways: $3,600,000
Housing and Community Development: $3,406,000
Housing and Community Development: $3,095,000
Highways: $2,075,000
Other: $1,114,000
Other: $1,098,000
- General - Interest on Debt: $48,449,000
Interest on Debt: $40,968,000
- Intergovernmental to Local - Other - General - Other: $22,867,000
Other - General - Other: $18,408,000
- Intergovernmental to State - Public Welfare - Categorical Assistance Programs: $65,426,000
Public Welfare - Categorical Assistance Programs: $65,294,000
Transit Utilities: $2,049,000
Transit Utilities: $1,818,000
- Local Intergovernmental - Education: $20,609,000
Education: $20,280,000
Highways: $3,978,000
Highways: $3,524,000
Other: $978,000
Other: $887,000
Sewerage: $54,000
Sewerage: $41,000
- Long Term Debt - Beginning Outstanding - Unspecified Public Purpose: $544,488,000
Beginning Outstanding - Unspecified Public Purpose: $508,657,000
Outstanding Unspecified Public Purpose: $506,920,000
Outstanding Unspecified Public Purpose: $497,155,000
Retired Unspecified Public Purpose: $63,762,000
Issue, Unspecified Public Purpose: $62,025,000
Beginning Outstanding - Public Debt for Private Purpose: $57,175,000
Outstanding Nonguaranteed - Industrial Revenue: $52,425,000
Beginning Outstanding - Public Debt for Private Purpose: $47,675,000
Retired Unspecified Public Purpose: $47,333,000
Outstanding Nonguaranteed - Industrial Revenue: $42,925,000
Retired Nonguaranteed - Public Debt for Private Purpose: $4,750,000
Retired Nonguaranteed - Public Debt for Private Purpose: $4,750,000
- Miscellaneous - General Revenue - Other: $13,527,000
General Revenue - Other: $13,084,000
Interest Earnings: $4,916,000
Interest Earnings: $1,163,000
Fines and Forfeits: $1,141,000
Fines and Forfeits: $1,039,000
Rents: $87,000
Rents: $81,000
Donations From Private Sources: $7,000
Donations From Private Sources: $2,000
- Other Capital Outlay - Police Protection: $842,000
Police Protection: $463,000
Sewerage: $396,000
Health - Other: $95,000
Sewerage: $90,000
Correctional Institutions: $79,000
Public Welfare - Other: $76,000
Correctional Institutions: $63,000
General - Other: $56,000
Other Higher Education: $45,000
General - Other: $35,000
Central Staff Services: $28,000
Health - Other: $28,000
Local Fire Protection: $26,000
Judicial and Legal Services: $3,000
Transit Utilities: $2,000
- Other Funds - Cash and Securities: $156,554,000
Cash and Securities: $82,937,000
- Revenue - Transit Utilities: $4,540,000
Transit Utilities: $3,585,000
- Short Term Debt Outstanding - Beginning: $60,255,000
End of Fiscal Year: $60,237,000
Beginning: $60,000,000
End of Fiscal Year: $58,573,000
- Sinking Funds - Cash and Securities: $72,553,000
Cash and Securities: $71,947,000
- State Intergovernmental - Public Welfare: $57,535,000
Public Welfare: $53,921,000
Health and Hospitals: $40,528,000
Health and Hospitals: $40,351,000
Education: $20,797,000
Education: $20,734,000
Transit Utilities: $16,072,000
Transit Utilities: $15,894,000
Other: $14,816,000
Other: $12,707,000
Highways: $4,446,000
Highways: $4,310,000
- Tax - General Sales and Gross Receipts: $230,855,000
General Sales and Gross Receipts: $204,321,000
Property: $172,413,000
Property: $167,692,000
Public Utilities Sales: $10,907,000
Public Utilities Sales: $9,079,000
Other: $5,864,000
Other: $5,225,000
Other Selective Sales: $3,288,000
Other Selective Sales: $3,173,000
Other License: $1,300,000
Other License: $1,049,000
- Total Salaries and Wages: $142,099,000
: $133,136,000
Rockland County government finances - Cash and Securities in 2018:
- Assistance and Subsidies - Public Welfare, Federal Categorical Assistance Programs: $7,596,000
Public Welfare, Cash Assistance Programs - Other: $5,721,000
Public Welfare, Federal Categorical Assistance Programs: $5,665,000
Public Welfare, Cash Assistance Programs - Other: $5,124,000
- Bond Funds - Cash and Securities: $111,753,000
Cash and Securities: $64,628,000
- Charges - Higher Education - Other: $19,951,000
Higher Education - Other: $16,889,000
Other: $16,666,000
Other: $11,040,000
Sewerage: $1,414,000
Sewerage: $1,247,000
Parks and Recreation: $29,000
Parks and Recreation: $28,000
- Construction - Sewerage: $10,907,000
Regular Highways: $10,775,000
Regular Highways: $10,119,000
General - Other: $9,441,000
General - Other: $5,626,000
Other Higher Education: $3,367,000
Health - Other: $2,473,000
Natural Resources - Other: $2,286,000
Sewerage: $2,056,000
Natural Resources - Other: $1,549,000
Health - Other: $1,530,000
Parks and Recreation: $1,379,000
Local Fire Protection: $1,241,000
Parks and Recreation: $124,000
Local Fire Protection: $95,000
- Current Operations - Health - Other: $88,559,000
Health - Other: $85,364,000
General - Other: $75,197,000
General - Other: $74,969,000
Other Higher Education: $72,142,000
Public Welfare - Other: $71,931,000
Other Higher Education: $71,331,000
Public Welfare - Other: $69,955,000
Police Protection: $39,770,000
Police Protection: $35,820,000
Correctional Institutions: $33,737,000
Correctional Institutions: $31,286,000
Transit Utilities: $26,591,000
Sewerage: $26,226,000
Transit Utilities: $24,642,000
Sewerage: $23,966,000
Judicial and Legal Services: $22,449,000
Judicial and Legal Services: $21,580,000
Central Staff Services: $20,206,000
Central Staff Services: $17,853,000
Regular Highways: $13,794,000
Regular Highways: $13,155,000
Corrections - Other: $10,603,000
Corrections - Other: $10,511,000
Financial Administration: $8,246,000
Financial Administration: $7,911,000
General Public Buildings: $6,934,000
General Public Buildings: $6,880,000
Local Fire Protection: $3,699,000
Local Fire Protection: $3,441,000
Housing and Community Development: $2,727,000
Parks and Recreation: $1,881,000
Parks and Recreation: $1,679,000
Public Welfare, Vendor Payments for Other Purposes: $173,000
Natural Resources - Other: $151,000
Public Welfare, Vendor Payments for Other Purposes: $149,000
Public Welfare, Vendor Payments for Medical Care: $97,000
Natural Resources - Other: $78,000
Housing and Community Development: $68,000
Public Welfare, Vendor Payments for Medical Care: $42,000
- Federal Intergovernmental - Highways: $3,600,000
Housing and Community Development: $3,406,000
Housing and Community Development: $3,095,000
Highways: $2,075,000
Other: $1,114,000
Other: $1,098,000
- General - Interest on Debt: $48,449,000
Interest on Debt: $40,968,000
- Intergovernmental to Local - Other - General - Other: $22,867,000
Other - General - Other: $18,408,000
- Intergovernmental to State - Public Welfare - Categorical Assistance Programs: $65,426,000
Public Welfare - Categorical Assistance Programs: $65,294,000
Transit Utilities: $2,049,000
Transit Utilities: $1,818,000
- Local Intergovernmental - Education: $20,609,000
Education: $20,280,000
Highways: $3,978,000
Highways: $3,524,000
Other: $978,000
Other: $887,000
Sewerage: $54,000
Sewerage: $41,000
- Long Term Debt - Beginning Outstanding - Unspecified Public Purpose: $544,488,000
Beginning Outstanding - Unspecified Public Purpose: $508,657,000
Outstanding Unspecified Public Purpose: $506,920,000
Outstanding Unspecified Public Purpose: $497,155,000
Retired Unspecified Public Purpose: $63,762,000
Issue, Unspecified Public Purpose: $62,025,000
Beginning Outstanding - Public Debt for Private Purpose: $57,175,000
Outstanding Nonguaranteed - Industrial Revenue: $52,425,000
Beginning Outstanding - Public Debt for Private Purpose: $47,675,000
Retired Unspecified Public Purpose: $47,333,000
Outstanding Nonguaranteed - Industrial Revenue: $42,925,000
Retired Nonguaranteed - Public Debt for Private Purpose: $4,750,000
Retired Nonguaranteed - Public Debt for Private Purpose: $4,750,000
- Miscellaneous - General Revenue - Other: $13,527,000
General Revenue - Other: $13,084,000
Interest Earnings: $4,916,000
Interest Earnings: $1,163,000
Fines and Forfeits: $1,141,000
Fines and Forfeits: $1,039,000
Rents: $87,000
Rents: $81,000
Donations From Private Sources: $7,000
Donations From Private Sources: $2,000
- Other Capital Outlay - Police Protection: $842,000
Police Protection: $463,000
Sewerage: $396,000
Health - Other: $95,000
Sewerage: $90,000
Correctional Institutions: $79,000
Public Welfare - Other: $76,000
Correctional Institutions: $63,000
General - Other: $56,000
Other Higher Education: $45,000
General - Other: $35,000
Central Staff Services: $28,000
Health - Other: $28,000
Local Fire Protection: $26,000
Judicial and Legal Services: $3,000
Transit Utilities: $2,000
- Other Funds - Cash and Securities: $156,554,000
Cash and Securities: $82,937,000
- Revenue - Transit Utilities: $4,540,000
Transit Utilities: $3,585,000
- Short Term Debt Outstanding - Beginning: $60,255,000
End of Fiscal Year: $60,237,000
Beginning: $60,000,000
End of Fiscal Year: $58,573,000
- Sinking Funds - Cash and Securities: $72,553,000
Cash and Securities: $71,947,000
- State Intergovernmental - Public Welfare: $57,535,000
Public Welfare: $53,921,000
Health and Hospitals: $40,528,000
Health and Hospitals: $40,351,000
Education: $20,797,000
Education: $20,734,000
Transit Utilities: $16,072,000
Transit Utilities: $15,894,000
Other: $14,816,000
Other: $12,707,000
Highways: $4,446,000
Highways: $4,310,000
- Tax - General Sales and Gross Receipts: $230,855,000
General Sales and Gross Receipts: $204,321,000
Property: $172,413,000
Property: $167,692,000
Public Utilities Sales: $10,907,000
Public Utilities Sales: $9,079,000
Other: $5,864,000
Other: $5,225,000
Other Selective Sales: $3,288,000
Other Selective Sales: $3,173,000
Other License: $1,300,000
Other License: $1,049,000
- Total Salaries and Wages: $142,099,000
: $133,136,000
Supplemental Security Income (SSI) in 2006:
- Total number of recipients: 5,256
- Number of aged recipients: 1,433
- Number of blind and disabled recipients: 3,823
- Number of recipients under 18: 440
- Number of recipients between 18 and 64: 2,736
- Number of recipients older than 64: 2,080
- Number of recipients also receiving OASDI: 2,016
- Amount of payments (thousands of dollars): 2,633
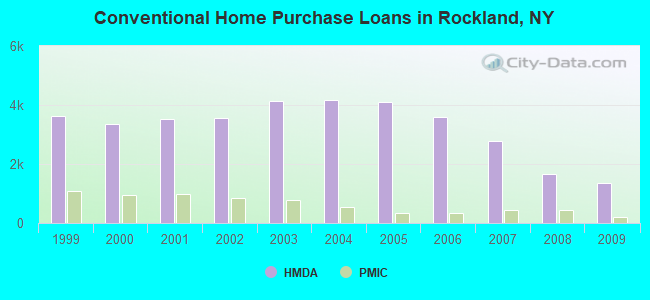
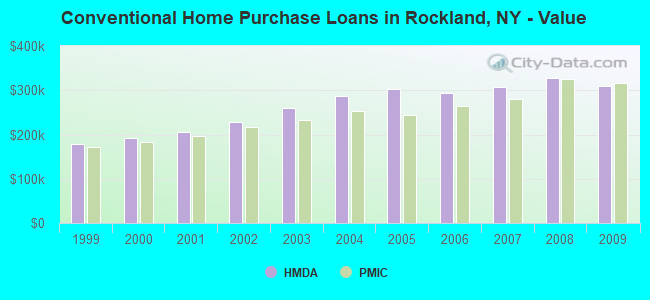
| Home Mortgage Disclosure Act Aggregated Statistics For Year 2009 (Based on 58 full tracts) | ||||||||||||||
| A) FHA, FSA/RHS & VA Home Purchase Loans | B) Conventional Home Purchase Loans | C) Refinancings | D) Home Improvement Loans | E) Loans on Dwellings For 5+ Families | F) Non-occupant Loans on < 5 Family Dwellings (A B C & D) | G) Loans On Manufactured Home Dwelling (A B C & D) | ||||||||
|---|---|---|---|---|---|---|---|---|---|---|---|---|---|---|
| Number | Average Value | Number | Average Value | Number | Average Value | Number | Average Value | Number | Average Value | Number | Average Value | Number | Average Value | |
| LOANS ORIGINATED | 411 | $331,518 | 1,363 | $310,281 | 2,796 | $290,276 | 207 | $169,386 | 7 | $10,577,429 | 193 | $269,767 | 3 | $70,333 |
| APPLICATIONS APPROVED, NOT ACCEPTED | 33 | $278,758 | 196 | $284,714 | 491 | $308,006 | 44 | $150,159 | 3 | $1,087,000 | 27 | $249,815 | 10 | $74,600 |
| APPLICATIONS DENIED | 108 | $304,676 | 446 | $282,087 | 1,863 | $325,391 | 210 | $103,119 | 3 | $2,359,333 | 158 | $268,892 | 10 | $101,100 |
| APPLICATIONS WITHDRAWN | 76 | $285,197 | 175 | $295,417 | 1,052 | $323,496 | 56 | $237,536 | 2 | $692,500 | 42 | $263,310 | 0 | $0 |
| FILES CLOSED FOR INCOMPLETENESS | 30 | $345,533 | 88 | $338,352 | 457 | $337,313 | 43 | $174,814 | 0 | $0 | 25 | $269,600 | 0 | $0 |
| Private Mortgage Insurance Companies Aggregated Statistics For Year 2009 (Based on 53 full tracts) | ||||||
| A) Conventional Home Purchase Loans | B) Refinancings | C) Non-occupant Loans on < 5 Family Dwellings (A & B) | ||||
|---|---|---|---|---|---|---|
| Number | Average Value | Number | Average Value | Number | Average Value | |
| LOANS ORIGINATED | 198 | $315,328 | 53 | $359,887 | 1 | $324,000 |
| APPLICATIONS APPROVED, NOT ACCEPTED | 67 | $355,881 | 32 | $348,594 | 0 | $0 |
| APPLICATIONS DENIED | 89 | $323,831 | 51 | $374,882 | 0 | $0 |
| APPLICATIONS WITHDRAWN | 23 | $333,435 | 16 | $354,000 | 0 | $0 |
| FILES CLOSED FOR INCOMPLETENESS | 5 | $382,000 | 3 | $368,000 | 0 | $0 |
| Most common first names in Rockland County, NY among deceased individuals | ||
| Name | Count | Lived (average) |
|---|---|---|
| Mary | 1,824 | 80.9 years |
| John | 1,754 | 74.2 years |
| Joseph | 1,279 | 75.1 years |
| William | 1,154 | 74.2 years |
| Anna | 1,063 | 83.4 years |
| Margaret | 831 | 79.9 years |
| James | 828 | 71.7 years |
| Helen | 799 | 80.9 years |
| George | 746 | 75.4 years |
| Rose | 745 | 83.0 years |
| Most common last names in Rockland County, NY among deceased individuals | ||
| Last name | Count | Lived (average) |
|---|---|---|
| Smith | 338 | 74.5 years |
| Cohen | 213 | 78.4 years |
| Johnson | 195 | 74.0 years |
| Conklin | 190 | 74.2 years |
| Miller | 182 | 76.6 years |
| Brown | 178 | 74.5 years |
| Jones | 158 | 72.6 years |
| Schwartz | 134 | 78.0 years |
| Murphy | 120 | 74.8 years |
| Kelly | 116 | 77.0 years |
| Businesses in Rockland County, NY | ||||
| Name | Count | Name | Count | |
|---|---|---|---|---|
| 7-Eleven | 6 | KFC | 3 | |
| A&P | 1 | Kincaid | 1 | |
| ALDO | 1 | Kohl's | 1 | |
| AT&T | 4 | Kroger | 2 | |
| Abercrombie & Fitch | 1 | La-Z-Boy | 5 | |
| Abercrombie Kids | 1 | Lane Bryant | 1 | |
| Advance Auto Parts | 2 | LensCrafters | 2 | |
| Aeropostale | 2 | Levi Strauss & Co. | 1 | |
| Aerosoles | 1 | Lowe's | 2 | |
| American Eagle Outfitters | 3 | Macy's | 2 | |
| Ann Taylor | 2 | Marriott | 1 | |
| Apple Store | 1 | Marshalls | 1 | |
| Applebee's | 1 | MasterBrand Cabinets | 25 | |
| Audi | 1 | McDonald's | 7 | |
| AutoZone | 3 | Men's Wearhouse | 1 | |
| Avenue | 1 | Motherhood Maternity | 4 | |
| BMW | 1 | New Balance | 8 | |
| Bakers | 1 | New York & Co | 1 | |
| Banana Republic | 1 | Nike | 23 | |
| Barnes & Noble | 2 | Nissan | 1 | |
| Baskin-Robbins | 3 | Office Depot | 1 | |
| Bath & Body Works | 2 | Old Navy | 1 | |
| Bed Bath & Beyond | 2 | Outback | 2 | |
| Best Western | 1 | Outback Steakhouse | 2 | |
| Blockbuster | 3 | Pac Sun | 1 | |
| Brookstone | 1 | Panera Bread | 1 | |
| Budget Car Rental | 1 | Pathmark | 1 | |
| Buffalo Wild Wings | 1 | Payless | 3 | |
| Burger King | 4 | Penske | 1 | |
| CVS | 7 | PetSmart | 1 | |
| Cache | 1 | Pier 1 Imports | 1 | |
| Casual Male XL | 1 | Pizza Hut | 2 | |
| Charlotte Russe | 1 | Pottery Barn | 1 | |
| Chevrolet | 1 | Qdoba Mexican Grill | 1 | |
| Chuck E. Cheese's | 1 | Quiznos | 1 | |
| Cinnabon | 1 | RadioShack | 5 | |
| Cold Stone Creamery | 1 | Raymour & Flanigan | 2 | |
| Comfort Inn | 1 | Red Lobster | 1 | |
| Costco | 1 | Rite Aid | 4 | |
| Curves | 2 | SAS Shoes | 1 | |
| DHL | 1 | Sears | 3 | |
| Days Inn | 1 | Sephora | 1 | |
| Decora Cabinetry | 16 | Skechers USA | 1 | |
| Domino's Pizza | 2 | Spencer Gifts | 1 | |
| DressBarn | 1 | Sprint Nextel | 6 | |
| Dressbarn | 1 | Staples | 2 | |
| Dunkin Donuts | 18 | Starbucks | 6 | |
| Express | 1 | Stop & Shop | 5 | |
| FedEx | 51 | Subaru | 1 | |
| Finish Line | 1 | Subway | 2 | |
| Foot Locker | 2 | Super 8 | 1 | |
| Ford | 2 | T-Mobile | 11 | |
| Forever 21 | 1 | T.G.I. Driday's | 1 | |
| GNC | 5 | T.J.Maxx | 1 | |
| GameStop | 5 | Taco Bell | 2 | |
| Gap | 2 | Target | 2 | |
| Gymboree | 1 | The Cheesecake Factory | 1 | |
| H&M | 1 | The Room Place | 2 | |
| H&R Block | 6 | Torrid | 1 | |
| Haagen-Dazs | 1 | Toyota | 2 | |
| Hilton | 3 | Toys"R"Us | 3 | |
| Holiday Inn | 3 | U-Haul | 10 | |
| Hollister Co. | 1 | UPS | 57 | |
| Home Depot | 2 | Vans | 2 | |
| Honda | 1 | Verizon Wireless | 5 | |
| Hot Topic | 1 | Victoria's Secret | 1 | |
| Howard Johnson | 1 | Volkswagen | 1 | |
| Hyundai | 1 | Walgreens | 3 | |
| IHOP | 1 | Walmart | 1 | |
| JCPenney | 1 | Wendy's | 5 | |
| Jamba Juice | 1 | Wet Seal | 1 | |
| Johnny Rockets | 1 | White Castle | 1 | |
| Jones New York | 13 | World Gym | 1 | |
| Journeys | 1 | YMCA | 1 | |
| Justice | 2 | |||
Rockland County on our top lists:
- #19 on the list of "Top 101 counties with the lowest number of infant deaths per 1000 residents 2007-2013 (pop. 50,000+)"
- #32 on the list of "Top 101 counties with the most Other adherents"
- #32 on the list of "Top 101 counties with the most Other adherents (pop. 50,000+)"
- #33 on the list of "Top 101 counties with the most Orthodox congregations"
- #33 on the list of "Top 101 counties with the most Orthodox congregations (pop. 50,000+)"
- #33 on the list of "Top 101 counties with the most Other congregations (pop. 50,000+)"
- #34 on the list of "Top 101 counties with the most Other congregations"
- #45 on the list of "Top 101 counties with the lowest percentage of residents relocating from other counties between 2010 and 2011 (pop. 50,000+)"
- #48 on the list of "Top 101 counties with the largest number of people moving out compared to moving in (pop. 50,000+)"
- #48 on the list of "Top 101 counties with the largest decrease in the number of infant deaths per 1000 residents 2000-2006 to 2007-2013 (pop. 50,000+)"
- #53 on the list of "Top 101 counties with the highest number of births per 1000 residents 2007-2013"
- #53 on the list of "Top 101 counties with the highest number of births per 1000 residents 2007-2013 (pop 50,000+)"
- #69 on the list of "Top 101 counties with the largest increase in the number of births per 1000 residents 2000-2006 to 2007-2013 (pop 50,000+)"
- #74 on the list of "Top 101 counties with the lowest percentage of residents relocating from other counties between 2010 and 2011"
- #82 on the list of "Top 101 counties with the lowest percentage of residents relocating to other counties in 2011 (pop. 50,000+)"
- #82 on the list of "Top 101 counties with the largest decrease in the number of deaths per 1000 residents 2000-2006 to 2007-2013 (pop. 50,000+)"
- #83 on the list of "Top 101 counties with the most Orthodox adherents (pop. 50,000+)"
- #84 on the list of "Top 101 counties with the most Orthodox adherents"