Estimated zip code population in 2022: 15,417 Zip code population in 2010: 14,791 Zip code population in 2000: 14,522
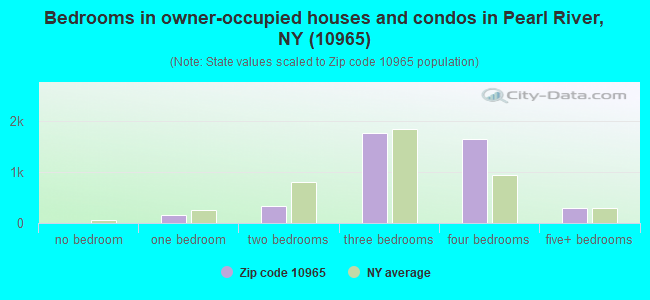
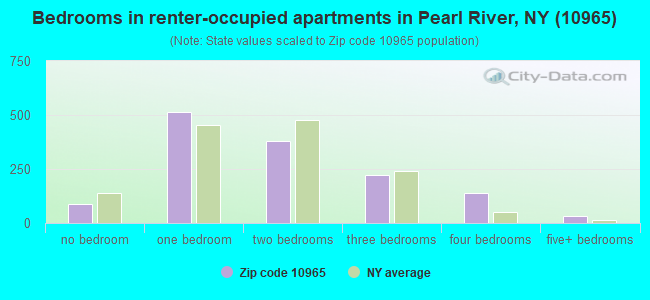
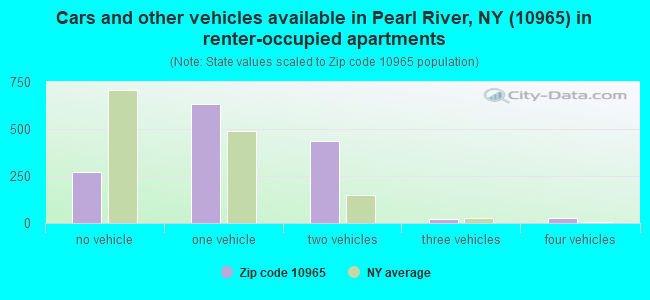
Houses and condos: 5,914 Renter-occupied apartments: 1,385
% of renters here:
25%
State:
46%
March 2022 cost of living index in zip code 10965: 132.6 (high, U.S. average is 100)
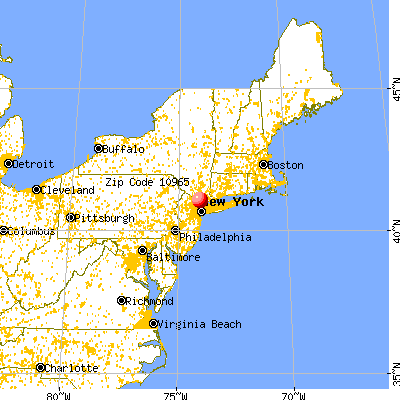
Land area: 5.3 sq. mi. Water area: 0.2 sq. mi.
Population density: 2,934 people per square mile
(average).
OSM Map
General Map
Google Map
MSN Map
OSM Map
General Map
Google Map
MSN Map
OSM Map
General Map
Google Map
MSN Map
OSM Map
General Map
Google Map
MSN Map
Please wait while loading the map...
Real estate property taxes paid for housing units in 2022:
This zip code:
1.8% ($9,805)
New York:
1.5% ($6,180)
Median real estate property taxes paid for housing units with mortgages in 2022: $9,858 (1.8%) Median real estate property taxes paid for housing units with no mortgage in 2022: $9,755 (1.9%)
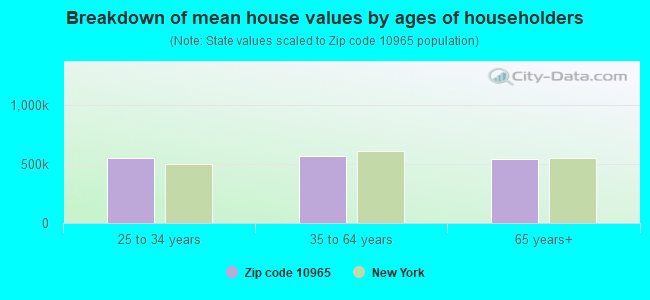
Estimated median house/condo value in 2022: $537,793
10965:
$537,793
New York:
$400,400
According to our research of New York and other state lists, there were 2 registered sex offenders living in 10965 zip code as of April 27, 2024. The ratio of all residents to sex offenders in zip code 10965 is 7,683 to 1. The ratio of registered sex offenders to all residents in this zip code is much lower than the state average.
Median resident age:
This zip code:
39.9 years
New York median age:
40.0 years
Average household size:
This zip code:
2.7 people
New York:
2.5 people
Averages for the 2020 tax year for zip code 10965, filed in 2021:
Average Adjusted Gross Income (AGI) in 2020: $108,010 (Individual Income Tax Returns)
Here:
$108,010
State:
$90,930
Salary/wage: $93,225 (reported on 77.0% of returns)
Here:
$93,225
State:
$72,104
(% of AGI for various income ranges: 1177.0% for AGIs below $25k, 3726.8% for AGIs $25k-50k, 6476.6% for AGIs $50k-75k, 9193.3% for AGIs $75k-100k, 17709.8% for AGIs $100k-200k, 59085.3% for AGIs over 200k)
Taxable interest for individuals: $1,437 (reported on 52.1% of returns)
This zip code:
$1,437
New York:
$3,075
(% of AGI for various income ranges: 33.2% for AGIs below $25k, 40.8% for AGIs $25k-50k, 87.4% for AGIs $50k-75k, 131.2% for AGIs $75k-100k, 158.8% for AGIs $100k-200k, 560.5% for AGIs over 200k)
Ordinary dividends: $6,323 (reported on 37.0% of returns)
Here:
$6,323
State:
$11,095
(% of AGI for various income ranges: 97.4% for AGIs below $25k, 123.2% for AGIs $25k-50k, 244.4% for AGIs $50k-75k, 301.6% for AGIs $75k-100k, 466.4% for AGIs $100k-200k, 2018.4% for AGIs over 200k)
Net capital gain/loss in AGI: +$16,147 (reported on 30.9% of returns)
Here:
+$16,147
State:
+$44,925
(% of AGI for various income ranges: 37.6% for AGIs below $25k, 81.5% for AGIs $25k-50k, 115.9% for AGIs $50k-75k, 258.4% for AGIs $75k-100k, 549.0% for AGIs $100k-200k, 7192.1% for AGIs over 200k)
Profit/loss from business: +$15,553 (reported on 13.2% of returns)
Here:
+$15,553
State:
+$14,940
(% of AGI for various income ranges: 158.1% for AGIs below $25k, 215.8% for AGIs $25k-50k, 137.4% for AGIs $50k-75k, 230.4% for AGIs $75k-100k, 379.5% for AGIs $100k-200k, 1673.0% for AGIs over 200k)
Taxable individual retirement arrangement distribution: $23,058 (reported on 14.0% of returns)
10965:
$23,058
New York:
$19,609
(% of AGI for various income ranges: 92.1% for AGIs below $25k, 227.9% for AGIs $25k-50k, 345.3% for AGIs $50k-75k, 647.8% for AGIs $75k-100k, 996.5% for AGIs $100k-200k, 1603.3% for AGIs over 200k)
Self-employed (Keogh) retirement plans: $21,014 (reported on 0.9% of returns)
10965:
$21,014
New York:
$32,497
(% of AGI for various income ranges: 34.2% for AGIs $100k-200k, 257.0% for AGIs over 200k)
Total itemized deductions: $28,794 (reported on 20.5% of returns)
Here:
$28,794
State:
$39,326
(% of AGI for various income ranges: 195.5% for AGIs below $25k, 329.2% for AGIs $25k-50k, 619.0% for AGIs $50k-75k, 904.7% for AGIs $75k-100k, 1572.2% for AGIs $100k-200k, 4006.7% for AGIs over 200k)
Charity contributions: $5,248 (reported on 18.4% of returns)
Here:
$5,248
State:
$15,420
(% of AGI for various income ranges: 8.8% for AGIs below $25k, 32.4% for AGIs $25k-50k, 64.9% for AGIs $50k-75k, 96.3% for AGIs $75k-100k, 226.0% for AGIs $100k-200k, 937.4% for AGIs over 200k)
Taxes paid: $9,531 (reported on 20.5% of returns)
10965:
$9,531
State:
$9,183
(% of AGI for various income ranges: 67.8% for AGIs below $25k, 118.6% for AGIs $25k-50k, 219.0% for AGIs $50k-75k, 325.1% for AGIs $75k-100k, 563.7% for AGIs $100k-200k, 1141.9% for AGIs over 200k)
Earned income credit: $1,641 (reported on 5.5% of returns)
Here:
$1,641
State:
$2,138
(% of AGI for various income ranges: 41.0% for AGIs below $25k, 44.7% for AGIs $25k-50k)
Percentage of individuals using paid preparers for their 2020 taxes: 94.6%
Here:
95%
State:
95%
(% for various income ranges: 92.3% for AGIs below $25k, 93.2% for AGIs $25k-50k, 95.3% for AGIs $50k-75k, 94.1% for AGIs $75k-100k, 96.0% for AGIs $100k-200k, 97.3% for AGIs over 200k)
Averages for the 2012 tax year for zip code 10965, filed in 2013:
Average Adjusted Gross Income (AGI) in 2012: $90,805 (Individual Income Tax Returns)
Here:
$90,805
State:
$77,088
Salary/wage: $78,289 (reported on 80.3% of returns)
Here:
$78,289
State:
$60,593
(% of AGI for various income ranges: 67.4% for AGIs below $25k, 68.3% for AGIs $25k-50k, 66.4% for AGIs $50k-75k, 65.7% for AGIs $75k-100k, 76.8% for AGIs $100k-200k, 62.4% for AGIs over 200k)
Taxable interest for individuals: $1,330 (reported on 55.3% of returns)
This zip code:
$1,330
New York:
$3,125
(% of AGI for various income ranges: 2.0% for AGIs below $25k, 1.1% for AGIs $25k-50k, 1.0% for AGIs $50k-75k, 0.8% for AGIs $75k-100k, 0.6% for AGIs $100k-200k, 0.8% for AGIs over 200k)
Ordinary dividends: $5,356 (reported on 37.2% of returns)
Here:
$5,356
State:
$10,299
(% of AGI for various income ranges: 3.4% for AGIs below $25k, 2.4% for AGIs $25k-50k, 1.9% for AGIs $50k-75k, 1.9% for AGIs $75k-100k, 1.4% for AGIs $100k-200k, 3.2% for AGIs over 200k)
Net capital gain/loss in AGI: +$10,967 (reported on 28.2% of returns)
Here:
+$10,967
State:
+$42,474
(% of AGI for various income ranges: 0.3% for AGIs $25k-50k, 0.3% for AGIs $50k-75k, 0.5% for AGIs $75k-100k, 0.7% for AGIs $100k-200k, 9.5% for AGIs over 200k)
Profit/loss from business: +$16,049 (reported on 13.0% of returns)
Here:
+$16,049
State:
+$16,168
(% of AGI for various income ranges: 6.5% for AGIs below $25k, 2.9% for AGIs $25k-50k, 2.4% for AGIs $50k-75k, 2.5% for AGIs $75k-100k, 2.0% for AGIs $100k-200k, 2.0% for AGIs over 200k)
Taxable individual retirement arrangement distribution: $15,018 (reported on 15.8% of returns)
10965:
$15,018
New York:
$17,621
(% of AGI for various income ranges: 5.5% for AGIs below $25k, 4.1% for AGIs $25k-50k, 3.7% for AGIs $50k-75k, 3.7% for AGIs $75k-100k, 2.8% for AGIs $100k-200k, 1.2% for AGIs over 200k)
Self-employment retirement plans: $18,014 (reported on 0.9% of returns)
10965:
$18,014
New York:
$27,330
(% of AGI for various income ranges: 0.1% for AGIs $100k-200k, 0.4% for AGIs over 200k)
Total itemized deductions: $31,747 (23% of AGI, reported on 56.5% of returns)
Here:
$31,747
State:
$34,985
Here:
23.2% of AGI
State:
21.3% of AGI
(% of AGI for various income ranges: 21.2% for AGIs below $25k, 17.0% for AGIs $25k-50k, 19.0% for AGIs $50k-75k, 22.0% for AGIs $75k-100k, 22.0% for AGIs $100k-200k, 17.0% for AGIs over 200k)
Charity contributions: $3,108 (reported on 51.8% of returns)
Here:
$3,108
State:
$5,572
(% of AGI for various income ranges: 1.1% for AGIs below $25k, 1.3% for AGIs $25k-50k, 1.7% for AGIs $50k-75k, 1.8% for AGIs $75k-100k, 1.7% for AGIs $100k-200k, 2.0% for AGIs over 200k)
Taxes paid: $16,933 (reported on 56.3% of returns)
10965:
$16,933
State:
$18,656
(% of AGI for various income ranges: 9.2% for AGIs below $25k, 8.0% for AGIs $25k-50k, 9.4% for AGIs $50k-75k, 10.6% for AGIs $75k-100k, 11.4% for AGIs $100k-200k, 10.3% for AGIs over 200k)
Earned income credit: $1,476 (reported on 5.5% of returns)
Here:
$1,476
State:
$2,230
(% of AGI for various income ranges: 2.1% for AGIs below $25k, 0.4% for AGIs $25k-50k)
Percentage of individuals using paid preparers for their 2012 taxes: 69.5%
Here:
70%
State:
66%
(% for various income ranges: 61.6% for AGIs below $25k, 64.0% for AGIs $25k-50k, 67.3% for AGIs $50k-75k, 73.1% for AGIs $75k-100k, 78.1% for AGIs $100k-200k, 78.7% for AGIs over 200k)
Averages for the 2004 tax year for zip code 10965, filed in 2005:
Average Adjusted Gross Income (AGI) in 2004: $73,674 (Individual Income Tax Returns)
Here:
$73,674
State:
$59,519
Salary/wage: $63,278 (reported on 80.5% of returns)
Here:
$63,278
State:
$50,673
(% of AGI for various income ranges: 214.8% for AGIs below $10k, 64.6% for AGIs $10k-25k, 71.8% for AGIs $25k-50k, 72.4% for AGIs $50k-75k, 74.0% for AGIs $75k-100k, 65.7% for AGIs over 100k)
Taxable interest for individuals: $1,526 (reported on 71.1% of returns)
This zip code:
$1,526
New York:
$2,377
(% of AGI for various income ranges: 12.5% for AGIs below $10k, 4.5% for AGIs $10k-25k, 2.3% for AGIs $25k-50k, 1.9% for AGIs $50k-75k, 1.3% for AGIs $75k-100k, 1.0% for AGIs over 100k)
Taxable dividends: $4,550 (reported on 44.3% of returns)
Here:
$4,550
State:
$5,394
(% of AGI for various income ranges: 12.1% for AGIs below $10k, 3.5% for AGIs $10k-25k, 1.8% for AGIs $25k-50k, 1.8% for AGIs $50k-75k, 1.5% for AGIs $75k-100k, 3.2% for AGIs over 100k)
Net capital gain/loss: +$14,443 (reported on 33.4% of returns)
Here:
+$14,443
State:
+$23,581
(% of AGI for various income ranges: -4.7% for AGIs below $10k, -0.8% for AGIs $10k-25k, 0.2% for AGIs $25k-50k, 1.0% for AGIs $50k-75k, 1.0% for AGIs $75k-100k, 10.6% for AGIs over 100k)
Profit/loss from business: +$16,360 (reported on 12.7% of returns)
Here:
+$16,360
State:
+$13,809
(% of AGI for various income ranges: 4.2% for AGIs below $10k, 6.5% for AGIs $10k-25k, 2.9% for AGIs $25k-50k, 2.0% for AGIs $50k-75k, 2.2% for AGIs $75k-100k, 2.9% for AGIs over 100k)
IRA payment deduction: $3,278 (reported on 2.9% of returns)
10965:
$3,278
New York:
$3,115
(% of AGI for various income ranges: 0.5% for AGIs $10k-25k, 0.3% for AGIs $25k-50k, 0.2% for AGIs $50k-75k, 0.2% for AGIs $75k-100k, 0.1% for AGIs over 100k)
Self-employed pension: $12,733 (reported on 1.2% of returns)
Here:
$12,733
New York:
$19,016
(% of AGI for various income ranges: 0.5% for AGIs $10k-25k, 0.2% for AGIs $75k-100k, 0.3% for AGIs over 100k)
Total itemized deductions: $25,713 (22% of AGI, reported on 54.3% of returns)
Here:
$25,713
State:
$25,864
Here:
22.5% of AGI
State:
21.9% of AGI
(% of AGI for various income ranges: 34.0% for AGIs below $10k, 19.3% for AGIs $10k-25k, 15.6% for AGIs $25k-50k, 20.8% for AGIs $50k-75k, 22.4% for AGIs $75k-100k, 18.1% for AGIs over 100k)
Charity contributions deductions: $3,524 (3% of AGI, reported on 52.0% of returns)
Here:
$3,524
State:
$4,439
Here:
3.0% of AGI
State:
3.6% of AGI
(% of AGI for various income ranges: 1.4% for AGIs below $10k, 2.1% for AGIs $10k-25k, 2.0% for AGIs $25k-50k, 2.5% for AGIs $50k-75k, 2.7% for AGIs $75k-100k, 2.6% for AGIs over 100k)
Total tax: $11,731 (reported on 82.2% of returns)
10965:
$11,731
State:
$11,730
(% of AGI for various income ranges: 6.2% for AGIs below $10k, 4.4% for AGIs $10k-25k, 8.2% for AGIs $25k-50k, 9.6% for AGIs $50k-75k, 9.9% for AGIs $75k-100k, 15.9% for AGIs over 100k)
Earned income credit: $1,330 (reported on 4.3% of returns)
Here:
$1,330
State:
$1,757
Percentage of individuals using paid preparers for their 2004 taxes: 67.9%
Here:
68%
State:
67%
(% for various income ranges: 53.1% for AGIs below $10k, 63.9% for AGIs $10k-25k, 68.5% for AGIs $25k-50k, 72.3% for AGIs $50k-75k, 72.7% for AGIs $75k-100k, 75.6% for AGIs over 100k)
Likely homosexual households (counted as self-reported same-sex unmarried-partner households)
Lesbian couples: 0.1% of all households
Gay men: 0.0% of all households
Household received Food Stamps/SNAP in the past 12 months: 404 Household did not receive Food Stamps/SNAP in the past 12 months: 5,145
Women who had a birth in the past 12 months: 147 (143 now married, 2 unmarried) Women who did not have a birth in the past 12 months: 3,170 (1,949 now married, 1,182 unmarried)
Housing units in zip code 10965 with a mortgage: 2,689 (472 second mortgage, 470 both second mortgage and home equity loan) Houses without a mortgage: 39
Median monthly owner costs for units with a mortgage: $3,210 Median monthly owner costs for units without a mortgage: $1,418
Residents with income below the poverty level in 2022:
This zip code:
7.0%
Whole state:
14.3%
Residents with income below 50% of the poverty level in 2022:
This zip code:
4.5%
Whole state:
6.8%
Median number of rooms in houses and condos:
Here:
6.9
State:
6.3
Median number of rooms in apartments:
Here:
4.1
State:
3.8
Notable locations in this zip code not listed on our city pages
Notable locations in zip code 10965: Blue Hill Golf Club (A), Pearl River Station (B), Pearl River Public Library (C), Promenade at Blue Hill Assisted Living Center (D), Pearl River Hook and Ladder Company (E), Pearl River Fire District (F). Display/hide their locations on the map
Churches in zip code 10965 include: Chinese Evangelical Church (A), Good Shepherd Lutheran Church (B), Orthodox Church of the Transfiguration (C), Rockland Chinese Alliance Church (D), Saint Aedan's Church (E), Saint Stephen's Episcopal Church (F), Seventh Day Adventist Church (G), Saint Margaret's Church (H), Pearl River United Methodist Church (I). Display/hide their locations on the map
3,192 married couples with children.
208 single-parent households (33 men, 175 women).
76.1% of residents of 10965 zip code speak English at home.
12.6% of residents speak Spanish at home (50% very well, 29% well, 20% not well).
7.9% of residents speak other Indo-European language at home (62% very well, 37% well, 1% not well).
3.3% of residents speak Asian or Pacific Island language at home (66% very well, 15% well, 20% not well).
0.2% of residents speak other language at home (100% very well).
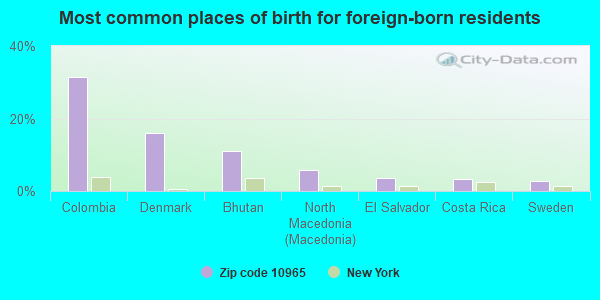
Foreign born population: 3,246 (21.1%) (63.5% of them are naturalized citizens)
This zip code:
21.1%
Whole state:
22.7%
31%Colombia
16%Denmark
11%Bhutan
6%North Macedonia (Macedonia)
4%El Salvador
3%Costa Rica
3%Sweden
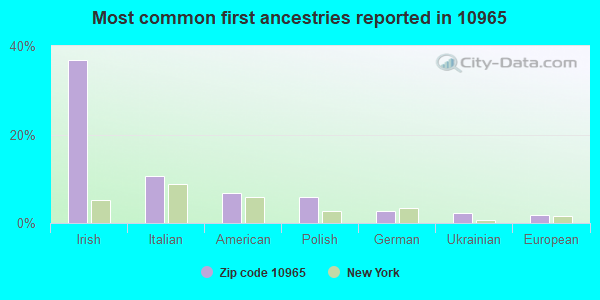
37%Irish
11%Italian
7%American
6%Polish
3%German
2%Ukrainian
2%European
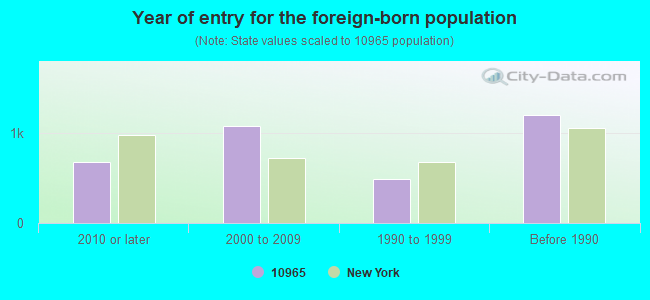
Year of entry for the foreign-born population
6792010 or later
1,0772000 to 2009
4871990 to 1999
1,205Before 1990
Facilities with environmental interests located in this zip code:
AEROFLEX MIC TECHNOLOGY CORP-THIN FILM (35 JEFFERSON AVE. in PEARL RIVER, NY)
STATE MASTER (New York facility tracking) - National Pollutant Discharge Elimination System Permit, AIR PROGRAM, National Pollutant Discharge Elimination System Permit, HAZARDOUS WASTE PROGRAM CRITERIA AND HAZARDOUS AIR POLLUTANT INVENTORY (Inventory of air pollution sources) HAZARDOUS WASTE BIENNIAL REPORTER (Resource Conservation and Recovery Act (tracking hazardous waste)) Large Quantity Generators, more that 1000 kg of hazardous waste/month (Resource Conservation and Recovery Act (tracking hazardous waste)) - notification TRI REPORTER (Tracking of toxic chemicals releasing facilities) Business SIC classification: ELECTRONIC COMPONENTS; SEARCH, DETECTION, NAVIGATION, GUIDANCE, AERONAUTICAL, AND NAUTICAL SYSTEMS AND INSTRUMENTS; NONCLASSIFIABLE ESTABLISHMENTS Business NAICS classification: OTHER ELECTRONIC COMPONENT MANUFACTURING.; SEARCH, DETECTION, NAVIGATION, GUIDANCE, AERONAUTICAL, AND NAUTICAL SYSTEM AND INSTRUMENT MANUFACTURING. Organizations: KARL KIRCHNER (CONTACT/OPERATOR)
, AEROFLEX PEARL RIVER (CONTACT/OPERATOR)
, VISHAY MIC TECHNOLOGY INC (CONTACT/OPERATOR)
, AEROFLEX INC (CONTACT/OWNER)
, AEROFLEX LABORATORIES INC (LEGALLY RESPONSIBLE PARTY)
, AEROFLEX MIC TECHNOLOGY CORPORATION (LEGALLY RESPONSIBLE PARTY)
Alternative names: AEROFLEX MIC TECH. CORP., AEROFLEX MICROELECTRONIC SOLUTIONS, MIC TECH. CORP.
HEGARTY HOMES INC (415 BLAUVELT RD in PEARL RIVER, NY)
(Integrated Compliance Information System) - ICIS-02-1992-0252, FORMAL ENFORCEMENT ACTION
INTERCHANGE COMMERCE CENTER ASSOCIATES (ONE BLUE HILL PLAZA in PEARL RIVER, NY)
(Integrated Compliance Information System) - ICIS-02-1995-0393, FORMAL ENFORCEMENT ACTION
HUDSON VALLEY ENVIRONMENTAL (46 E CENTRAL AVE in PEARL RIVER, NY)
Large Quantity Generators, more that 1000 kg of hazardous waste/month (Resource Conservation and Recovery Act (tracking hazardous waste)) USED OIL PROGRAM (Resource Conservation and Recovery Act (tracking hazardous waste)) Organizations: M & N ENVIRONMENTAL INC (CONTACT/OWNER)
AAMCO TRANSMISSIONS (30 W WASHINGTON AVE in PEARL RIVER, NY)
(Resource Conservation and Recovery Act (tracking hazardous waste))
GILBERT RIDGE REALTY INC (19 E WASHINGTON AVE in PEARL RIVER, NY)
(Resource Conservation and Recovery Act (tracking hazardous waste))
HAMMER & NAIL INC THE (56 WALTER ST in PEARL RIVER, NY)
(Resource Conservation and Recovery Act (tracking hazardous waste))
AMERICAN CYANAMID CO (P01 NORTH MIDDLELAWN RD in PEARL RIVER, NY)
COMPLIANCE ACTIVITY (Tracking inspections of insecticide, fungicide, and rodenticide, and toxic substances)
Housing units lacking complete kitchen facilities: 0.8%
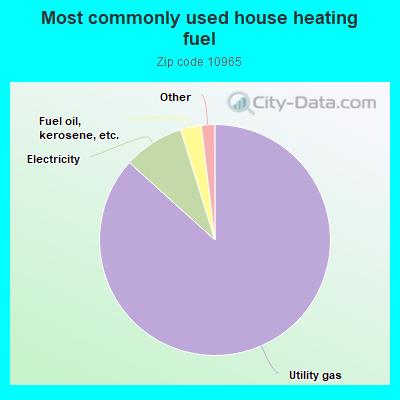
86.7%Utility gas
8.5%Electricity
2.9%Fuel oil, kerosene, etc.
0.9%Bottled, tank, or LP gas
0.5%Other fuel
Population in 1990: 14,791.
Place of birth for U.S.-born residents:
This state: 9,096
Northeast: 1,978
Midwest: 300
South: 340
West: 202
73% of the 10965 zip code residents lived in the same house 5 years ago. Out of people who lived in different houses, 51% lived in this county. Out of people who lived in different counties, 50% lived in New York.
98% of the 10965 zip code residents lived in the same house 1 year ago. Out of people who lived in different houses, 55% moved from this county. Out of people who lived in different houses, 24% moved from different county within same state. Out of people who lived in different houses, 2% moved from different state. Out of people who lived in different houses, 14% moved from abroad.
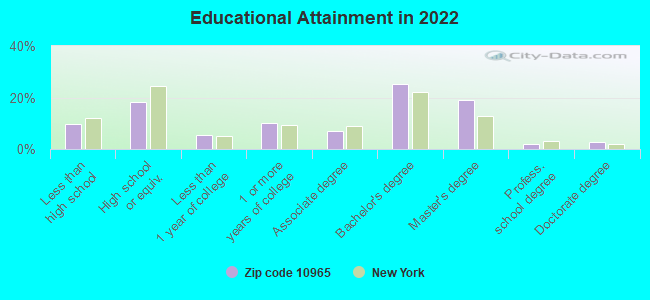
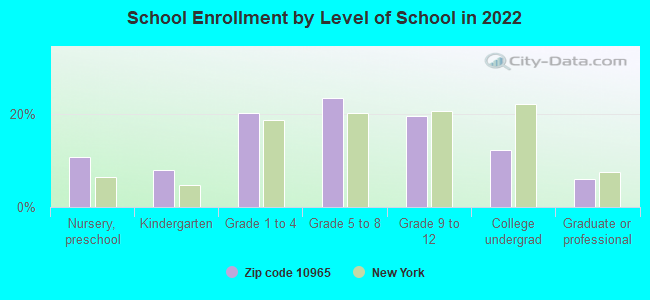
Private vs. public school enrollment:
Students in private schools in grades 1 to 8 (elementary and middle school): 377
Here:
21.8%
New York:
15.6%
Students in private schools in grades 9 to 12 (high school): 105
Here:
13.5%
New York:
15.0%
Students in private undergraduate colleges: 318
Here:
64.6%
New York:
39.2%
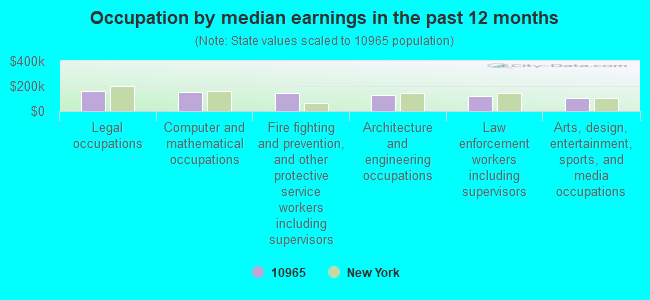
Occupation by median earnings in the past 12 months ($)
161,611Legal occupations
151,948Computer and mathematical occupations
146,045Fire fighting and prevention, and other protective service workers including supervisors
127,054Architecture and engineering occupations
118,478Law enforcement workers including supervisors
107,405Arts, design, entertainment, sports, and media occupations
Companies with federal contracts located in this zip code (PEARL RIVER, NY):
ORANGE AND ROCKLAND UTILITIES (1 BLUE HILL PLZ STE 20) : $55,523,676 in 133 contractsfrom 2000 to 2006
Contracts for Electric Services, Gas Services, Maintenance, Repair and Rebuilding of Equipment -- Electric Wire, and Power and Distribution Equipment, Maintenance, Repair and Rebuilding of Equipment -- Electrical and Electronic Equipment Components by Army, Bureau of Prisoners/Federal Prison System, Public Buildings Service Signed by year:2000: $8,657,364; 2001: $7,791,210; 2002: $5,877,453; 2003: $7,120,360; 2004: $9,876,052; 2005: $10,122,455; 2006: $6,078,782.
Biggest contracts:
$2,271,166 with Army for Electric Services. Signed on 2005-09-15. Completion date: 2005-10-31.
$1,581,832, same as above.Signed on 2006-01-01. Completion date: 2006-01-31.
$1,332,475, same as above.Signed on 2005-09-01. Completion date: 2005-09-30.
$1,268,315, same as above.Signed on 2006-01-01. Completion date: 2006-01-31.
FLOOD DAMAGE REDUCTION SPECIAL (ONE BLUE HILL PLAZA) : $2,446,161 in 14 contractsfrom 2001 to 2003
Contracts for Architect - Engineer Services (including landscaping, interior layout, and designing) by U.S. Army Corps of Engineers - civil program financing only Signed by year:2000: $0; 2001: $20,000; 2002: $1,419,088; 2003: $1,007,073; 2004: $0; 2005: $0; 2006: $0.
Biggest contracts:
$494,647 with U.S. Army Corps of Engineers - civil program financing only for Architect - Engineer Services (including landscaping, interior layout, and designing). Taking place in NJ. Signed on 2002-09-12. Completion date: 2003-02-14.
$429,822, same as above.Signed on 2003-07-14. Completion date: 2004-07-01.
$305,390 with U.S. Army Corps of Engineers - civil program financing only for Architect - Engineer Services (including landscaping, interior layout, and designing). Signed on 2002-12-05. Completion date: 2003-11-30.
$285,061, same as above.Signed on 2003-02-05. Completion date: 2003-12-22.
NY NJ ENVIRONMENTAL RESTORATIO (1 BLUE HILL PLAZA 12 FL) : $2,414,581 in 29 contractsfrom 2003 to 2006
Contracts for Other Architect and Engineering Services, Architect - Engineer Services (including landscaping, interior layout, and designing) by Army, U.S. Army Corps of Engineers - civil program financing only Signed by year:2000: $0; 2001: $0; 2002: $0; 2003: $421,991; 2004: -$3,126; 2005: $919,574; 2006: $1,076,142.
Biggest contracts:
$538,337 with Army for Other Architect and Engineering Services. Signed on 2006-03-24. Completion date: 2007-03-23.
$272,581 with Army for Architect - Engineer Services (including landscaping, interior layout, and designing). Signed on 2006-05-19. Completion date: 2007-05-18.
$265,224, same as above.Signed on 2006-04-20. Completion date: 2007-01-31.
$224,890 with U.S. Army Corps of Engineers - civil program financing only for Architect - Engineer Services (including landscaping, interior layout, and designing). Signed on 2003-08-13. Completion date: 2004-07-30.
DAMES & MOORE (ONE BLUE HILL PLAZA) : $791,483 in 7 contractsfrom 2000 to 2002
Contracts for Architect - Engineer Services (including landscaping, interior layout, and designing), Other Architect and Engineering Services by U.S. Army Corps of Engineers - civil program financing only, Army Signed by year:2000: $610,437; 2001: $121,866; 2002: $59,180; 2003: $0; 2004: $0; 2005: $0; 2006: $0.
Biggest contracts:
$376,150 with U.S. Army Corps of Engineers - civil program financing only for Architect - Engineer Services (including landscaping, interior layout, and designing). Taking place in NJ. Signed on 2000-09-30. Completion date: 2000-10-30.
$222,930 with U.S. Army Corps of Engineers - civil program financing only for Other Architect and Engineering Services. Taking place in NJ. Signed on 2000-09-20. Completion date: 2001-03-20.
$59,180 with Army for Architect - Engineer Services (including landscaping, interior layout, and designing). Taking place in NJ. Signed on 2002-09-23. Completion date: 2002-09-23.
$49,605 with U.S. Army Corps of Engineers - civil program financing only for Architect - Engineer Services (including landscaping, interior layout, and designing). Taking place in CT. Signed on 2001-04-17. Completion date: 2001-08-13.
NEW YORK NEW JERSEY HARBOR PAR (LMS - ONE BLUE HIL PLAZA) : $303,219 in 7 contractsfrom 1999 to 2000
Contracts for Other Architect and Engineering Services, Architect - Engineer Services (including landscaping, interior layout, and designing) by U.S. Army Corps of Engineers - civil program financing only, Army Signed by year:2000: $276,101; 2001: $0; 2002: $0; 2003: $0; 2004: $0; 2005: $0; 2006: $0.
Biggest contracts:
$176,975 with U.S. Army Corps of Engineers - civil program financing only for Other Architect and Engineering Services. Signed on 2000-08-18. Completion date: 2000-09-18.
$86,727, same as above.Signed on 2000-06-06. Completion date: 2000-08-31.
$13,559 with Army for Architect - Engineer Services (including landscaping, interior layout, and designing). Signed on 1999-11-02. Completion date: 2000-01-31.
$13,559 with U.S. Army Corps of Engineers - civil program financing only for Architect - Engineer Services (including landscaping, interior layout, and designing). Signed on 1999-11-02. Completion date: 2000-01-31.
ROBERT E SCHNELL (74 CHAMP AVENUE; small business) : $111,228 in 5 contractsfrom 2000 to 2005
Contracts for Personal Services Contracts by Departmental Offices Signed by year:2000: $71,000; 2001: $0; 2002: $0; 2003: $0; 2004: $33,903; 2005: $6,325; 2006: $0.
Biggest contracts:
$36,000 with Departmental Offices for Personal Services Contracts. Taking place in DC. Signed on 2000-09-15. Completion date: 2001-09-15.
$35,000, same as above.Signed on 2000-01-15. Completion date: 2001-09-15.
$33,903, same as above.Signed on 2004-09-30. Completion date: 2005-09-29.
$6,325, same as above.Signed on 2005-09-30. Completion date: 2005-09-29.
B DIAZ SANITATION INC (P O BOX 1042; small business) : $71,075 in 14 contractsfrom 2002 to 2005
Contracts for Trash/Garbage Collection Services - Including Portable Sanitation Services by Army Signed by year:2000: $0; 2001: $0; 2002: $1,156; 2003: $25,213; 2004: $20,040; 2005: $24,666; 2006: $0.
Biggest contracts:
$21,540 with Army for Trash/Garbage Collection Services - Including Portable Sanitation Services. Taking place in NJ. Signed on 2005-08-29. Completion date: 2006-08-31.
$20,040, same as above.Signed on 2004-07-23. Completion date: 2004-06-30.
$18,420, same as above.Signed on 2003-07-21. Completion date: 2004-06-30.
$3,340, same as above.Signed on 2005-06-27. Completion date: 2004-06-30.
HUDSON TECHNOLOGIES COMPANY (275 NORTH MIDDLETOWN ROAD)
$17,757 with Navy for Miscellaneous Items. Signed on 2005-08-29. Completion date: 2005-08-31.
ACME PARTRIDGE ENTERPRISES INC (32 EAST CENTRAL AVENUE; small business)
$4,772 with Army for Athletic and Sporting Equipment. Taking place in NJ. Signed on 2005-02-24. Completion date: 2005-03-25.
HIGHLAND CONSTRUCTION ASSOCIAT (11 WEST CROOKED HILL ROAD; small business) : -$275,136 in 6 contractsfrom 2001 to 2004
Contracts for Bars and Rods, Miscellaneous Prefabricated Structures, Miscellaneous Items by U.S. Army Corps of Engineers - civil program financing only, National Park Service, Army Signed by year:2000: $0; 2001: $268,000; 2002: $395,602; 2003: $0; 2004: -$938,738; 2005: $0; 2006: $0.
Biggest contracts:
$469,369 with U.S. Army Corps of Engineers - civil program financing only for Bars and Rods. Signed on 2002-07-01. Completion date: 2002-09-30.
$218,000 with U.S. Army Corps of Engineers - civil program financing only for Miscellaneous Prefabricated Structures. Signed on 2001-03-22. Completion date: 2001-06-30.
$50,000 with National Park Service for Miscellaneous Items. Taking place in MI. Signed on 2001-09-15. Completion date: 2002-03-15.
-$73,767 with U.S. Army Corps of Engineers - civil program financing only for Miscellaneous Prefabricated Structures. Signed on 2002-01-18. Completion date: 2001-06-30.
Top industries in this zip code by the number of employees in 2005:
Professional, Scientific, and Technical Services: Research and Development in the Physical, Engineering, and Life Sciences (over 1000 employees: 1 establishment, 50-99 employees: 1 establishment, 5-9 employees: 1 establishment)
Other Services (except Public Administration): Religious Organizations (500-999: 1, 20-49: 2, 10-19: 2, 1-4: 3)
2002 - 2018 National Fire Incident Reporting System (NFIRS) incidents
Based on the data from the years 2002 - 2018 the average number of fires per year is 35. The highest number of fire incidents - 65 took place in 2005, and the least - 0 in 2010. The data has a declining trend.
When looking into fire subcategories, the most reports belonged to: Structure Fires (49.1%), and Outside Fires (29.4%).
Fire incident types reported to NFIRS in Zip Code 10965


 Nearest zip codes: 10954, 07645, 07656, 10962, 10994, 10913.


 Based on the data from the years 2002 - 2018 the average number of fires per year is 35. The highest number of fire incidents - 65 took place in 2005, and the least - 0 in 2010. The data has a declining trend.
 When looking into fire subcategories, the most reports belonged to: Structure Fires (49.1%), and Outside Fires (29.4%).