Estimated zip code population in 2022: 20,201 Zip code population in 2010: 20,631 Zip code population in 2000: 19,315
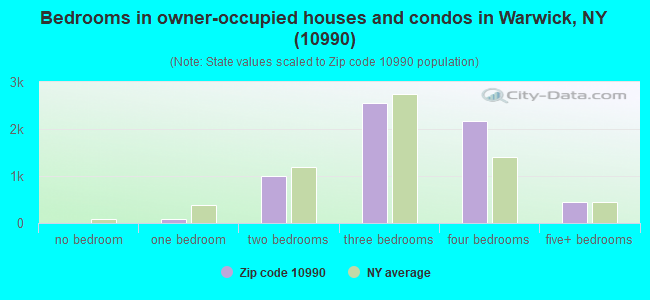
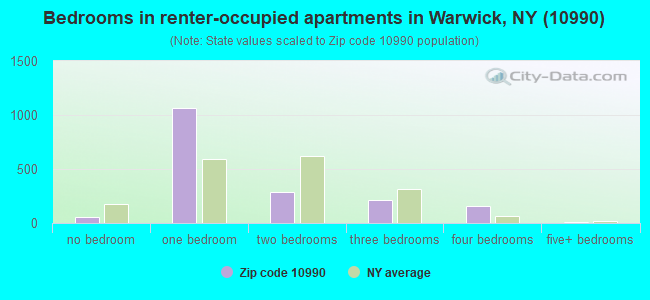
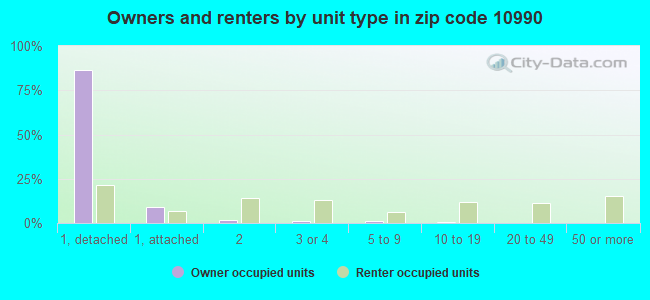
Houses and condos: 8,520 Renter-occupied apartments: 1,787
% of renters here:
22%
State:
46%
March 2022 cost of living index in zip code 10990: 132.8 (high, U.S. average is 100)
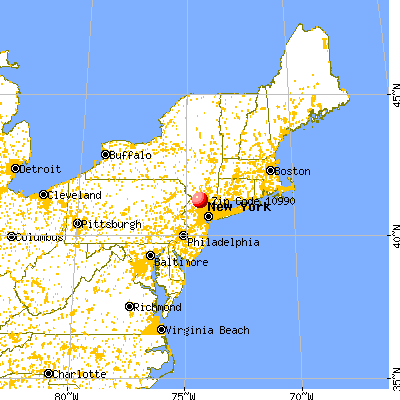
Land area: 60.9 sq. mi. Water area: 1.1 sq. mi.
Population density: 332 people per square mile
(very low).
OSM Map
General Map
Google Map
MSN Map
OSM Map
General Map
Google Map
MSN Map
OSM Map
General Map
Google Map
MSN Map
OSM Map
General Map
Google Map
MSN Map
Please wait while loading the map...
Real estate property taxes paid for housing units in 2022:
This zip code:
2.2% ($9,805)
New York:
1.5% ($6,180)
Median real estate property taxes paid for housing units with mortgages in 2022: $9,858 (2.2%) Median real estate property taxes paid for housing units with no mortgage in 2022: $9,687 (2.1%)
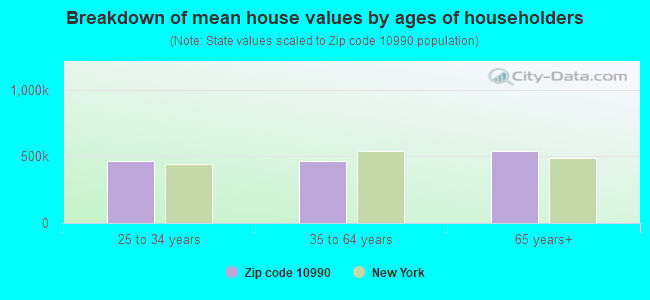
Estimated median house/condo value in 2022: $443,036
10990:
$443,036
New York:
$400,400
According to our research of New York and other state lists, there were 2 registered sex offenders living in 10990 zip code as of April 27, 2024. The ratio of all residents to sex offenders in zip code 10990 is 9,980 to 1. The ratio of registered sex offenders to all residents in this zip code is much lower than the state average.
Median resident age:
This zip code:
48.2 years
New York median age:
40.0 years
Average household size:
This zip code:
2.5 people
New York:
2.5 people
Averages for the 2020 tax year for zip code 10990, filed in 2021:
Average Adjusted Gross Income (AGI) in 2020: $110,102 (Individual Income Tax Returns)
Here:
$110,102
State:
$90,930
Salary/wage: $90,751 (reported on 78.4% of returns)
Here:
$90,751
State:
$72,104
(% of AGI for various income ranges: 1118.4% for AGIs below $25k, 3542.2% for AGIs $25k-50k, 6313.9% for AGIs $50k-75k, 9452.4% for AGIs $75k-100k, 18178.1% for AGIs $100k-200k, 79897.9% for AGIs over 200k)
Taxable interest for individuals: $1,700 (reported on 48.5% of returns)
This zip code:
$1,700
New York:
$3,075
(% of AGI for various income ranges: 31.5% for AGIs below $25k, 41.2% for AGIs $25k-50k, 57.6% for AGIs $50k-75k, 101.5% for AGIs $75k-100k, 137.3% for AGIs $100k-200k, 1149.5% for AGIs over 200k)
Ordinary dividends: $6,545 (reported on 32.0% of returns)
Here:
$6,545
State:
$11,095
(% of AGI for various income ranges: 60.4% for AGIs below $25k, 94.2% for AGIs $25k-50k, 173.0% for AGIs $50k-75k, 221.1% for AGIs $75k-100k, 399.8% for AGIs $100k-200k, 2852.8% for AGIs over 200k)
Net capital gain/loss in AGI: +$18,535 (reported on 28.3% of returns)
Here:
+$18,535
State:
+$44,925
(% of AGI for various income ranges: 35.1% for AGIs below $25k, 55.0% for AGIs $25k-50k, 122.2% for AGIs $50k-75k, 267.9% for AGIs $75k-100k, 616.9% for AGIs $100k-200k, 10502.8% for AGIs over 200k)
Profit/loss from business: +$18,867 (reported on 17.1% of returns)
Here:
+$18,867
State:
+$14,940
(% of AGI for various income ranges: 124.8% for AGIs below $25k, 186.5% for AGIs $25k-50k, 373.0% for AGIs $50k-75k, 359.8% for AGIs $75k-100k, 880.5% for AGIs $100k-200k, 3012.1% for AGIs over 200k)
Taxable individual retirement arrangement distribution: $21,737 (reported on 11.5% of returns)
10990:
$21,737
New York:
$19,609
(% of AGI for various income ranges: 90.8% for AGIs below $25k, 146.5% for AGIs $25k-50k, 255.5% for AGIs $50k-75k, 414.5% for AGIs $75k-100k, 748.5% for AGIs $100k-200k, 1999.7% for AGIs over 200k)
Self-employed (Keogh) retirement plans: $18,167 (reported on 1.2% of returns)
10990:
$18,167
New York:
$32,497
(% of AGI for various income ranges: 94.7% for AGIs $100k-200k, 240.8% for AGIs over 200k)
Total itemized deductions: $28,546 (reported on 17.1% of returns)
Here:
$28,546
State:
$39,326
(% of AGI for various income ranges: 163.9% for AGIs below $25k, 258.6% for AGIs $25k-50k, 525.1% for AGIs $50k-75k, 837.1% for AGIs $75k-100k, 1304.1% for AGIs $100k-200k, 4428.2% for AGIs over 200k)
Charity contributions: $5,848 (reported on 14.4% of returns)
Here:
$5,848
State:
$15,420
(% of AGI for various income ranges: 7.9% for AGIs below $25k, 23.7% for AGIs $25k-50k, 61.3% for AGIs $50k-75k, 93.5% for AGIs $75k-100k, 176.9% for AGIs $100k-200k, 1204.6% for AGIs over 200k)
Taxes paid: $9,499 (reported on 17.1% of returns)
10990:
$9,499
State:
$9,183
(% of AGI for various income ranges: 51.3% for AGIs below $25k, 80.6% for AGIs $25k-50k, 192.6% for AGIs $50k-75k, 345.2% for AGIs $75k-100k, 477.4% for AGIs $100k-200k, 1211.8% for AGIs over 200k)
Earned income credit: $1,675 (reported on 6.1% of returns)
Here:
$1,675
State:
$2,138
(% of AGI for various income ranges: 43.2% for AGIs below $25k, 36.1% for AGIs $25k-50k)
Percentage of individuals using paid preparers for their 2020 taxes: 94.8%
Here:
95%
State:
95%
(% for various income ranges: 92.8% for AGIs below $25k, 94.4% for AGIs $25k-50k, 95.3% for AGIs $50k-75k, 96.1% for AGIs $75k-100k, 95.9% for AGIs $100k-200k, 95.8% for AGIs over 200k)
Averages for the 2012 tax year for zip code 10990, filed in 2013:
Average Adjusted Gross Income (AGI) in 2012: $85,985 (Individual Income Tax Returns)
Here:
$85,985
State:
$77,088
Salary/wage: $74,605 (reported on 81.9% of returns)
Here:
$74,605
State:
$60,593
(% of AGI for various income ranges: 67.5% for AGIs below $25k, 69.7% for AGIs $25k-50k, 68.5% for AGIs $50k-75k, 71.9% for AGIs $75k-100k, 77.9% for AGIs $100k-200k, 65.4% for AGIs over 200k)
Taxable interest for individuals: $1,418 (reported on 51.2% of returns)
This zip code:
$1,418
New York:
$3,125
(% of AGI for various income ranges: 2.2% for AGIs below $25k, 1.1% for AGIs $25k-50k, 0.6% for AGIs $50k-75k, 1.0% for AGIs $75k-100k, 0.6% for AGIs $100k-200k, 0.9% for AGIs over 200k)
Ordinary dividends: $5,046 (reported on 32.2% of returns)
Here:
$5,046
State:
$10,299
(% of AGI for various income ranges: 3.2% for AGIs below $25k, 1.8% for AGIs $25k-50k, 1.5% for AGIs $50k-75k, 1.2% for AGIs $75k-100k, 1.2% for AGIs $100k-200k, 2.7% for AGIs over 200k)
Net capital gain/loss in AGI: +$8,812 (reported on 23.8% of returns)
Here:
+$8,812
State:
+$42,474
(% of AGI for various income ranges: 0.3% for AGIs $25k-50k, 0.5% for AGIs $50k-75k, 0.5% for AGIs $75k-100k, 0.8% for AGIs $100k-200k, 6.0% for AGIs over 200k)
Profit/loss from business: +$16,111 (reported on 17.8% of returns)
Here:
+$16,111
State:
+$16,168
(% of AGI for various income ranges: 7.6% for AGIs below $25k, 4.3% for AGIs $25k-50k, 3.7% for AGIs $50k-75k, 2.5% for AGIs $75k-100k, 2.4% for AGIs $100k-200k, 3.7% for AGIs over 200k)
Taxable individual retirement arrangement distribution: $16,209 (reported on 11.8% of returns)
10990:
$16,209
New York:
$17,621
(% of AGI for various income ranges: 4.0% for AGIs below $25k, 3.6% for AGIs $25k-50k, 3.5% for AGIs $50k-75k, 2.7% for AGIs $75k-100k, 2.3% for AGIs $100k-200k, 1.2% for AGIs over 200k)
Self-employment retirement plans: $18,667 (reported on 1.2% of returns)
10990:
$18,667
New York:
$27,330
(% of AGI for various income ranges: 0.4% for AGIs $25k-50k, 0.2% for AGIs $100k-200k, 0.5% for AGIs over 200k)
Total itemized deductions: $32,770 (24% of AGI, reported on 53.6% of returns)
Here:
$32,770
State:
$34,985
Here:
24.2% of AGI
State:
21.3% of AGI
(% of AGI for various income ranges: 22.8% for AGIs below $25k, 18.5% for AGIs $25k-50k, 20.7% for AGIs $50k-75k, 21.8% for AGIs $75k-100k, 21.6% for AGIs $100k-200k, 18.9% for AGIs over 200k)
Charity contributions: $2,713 (reported on 47.0% of returns)
Here:
$2,713
State:
$5,572
(% of AGI for various income ranges: 1.2% for AGIs below $25k, 1.3% for AGIs $25k-50k, 1.5% for AGIs $50k-75k, 1.6% for AGIs $75k-100k, 1.6% for AGIs $100k-200k, 1.3% for AGIs over 200k)
Taxes paid: $17,943 (reported on 53.5% of returns)
10990:
$17,943
State:
$18,656
(% of AGI for various income ranges: 8.4% for AGIs below $25k, 7.6% for AGIs $25k-50k, 9.0% for AGIs $50k-75k, 10.4% for AGIs $75k-100k, 11.4% for AGIs $100k-200k, 12.8% for AGIs over 200k)
Earned income credit: $1,786 (reported on 7.4% of returns)
Here:
$1,786
State:
$2,230
(% of AGI for various income ranges: 3.1% for AGIs below $25k, 0.6% for AGIs $25k-50k)
Percentage of individuals using paid preparers for their 2012 taxes: 68.6%
Here:
69%
State:
66%
(% for various income ranges: 59.1% for AGIs below $25k, 64.0% for AGIs $25k-50k, 73.8% for AGIs $50k-75k, 75.5% for AGIs $75k-100k, 75.6% for AGIs $100k-200k, 78.9% for AGIs over 200k)
Averages for the 2004 tax year for zip code 10990, filed in 2005:
Average Adjusted Gross Income (AGI) in 2004: $71,858 (Individual Income Tax Returns)
Here:
$71,858
State:
$59,519
Salary/wage: $65,899 (reported on 83.2% of returns)
Here:
$65,899
State:
$50,673
(% of AGI for various income ranges: 109.1% for AGIs below $10k, 64.3% for AGIs $10k-25k, 75.4% for AGIs $25k-50k, 77.8% for AGIs $50k-75k, 82.6% for AGIs $75k-100k, 74.8% for AGIs over 100k)
Taxable interest for individuals: $1,250 (reported on 67.5% of returns)
This zip code:
$1,250
New York:
$2,377
(% of AGI for various income ranges: 7.8% for AGIs below $10k, 4.0% for AGIs $10k-25k, 1.9% for AGIs $25k-50k, 1.1% for AGIs $50k-75k, 1.0% for AGIs $75k-100k, 0.9% for AGIs over 100k)
Taxable dividends: $3,008 (reported on 39.3% of returns)
Here:
$3,008
State:
$5,394
(% of AGI for various income ranges: 8.6% for AGIs below $10k, 2.9% for AGIs $10k-25k, 1.6% for AGIs $25k-50k, 1.5% for AGIs $50k-75k, 0.7% for AGIs $75k-100k, 1.7% for AGIs over 100k)
Net capital gain/loss: +$10,505 (reported on 31.1% of returns)
Here:
+$10,505
State:
+$23,581
(% of AGI for various income ranges: -0.9% for AGIs below $10k, 1.5% for AGIs $10k-25k, 0.7% for AGIs $25k-50k, 1.2% for AGIs $50k-75k, 1.0% for AGIs $75k-100k, 7.0% for AGIs over 100k)
Profit/loss from business: +$17,171 (reported on 17.1% of returns)
Here:
+$17,171
State:
+$13,809
(% of AGI for various income ranges: 12.2% for AGIs below $10k, 5.8% for AGIs $10k-25k, 5.4% for AGIs $25k-50k, 4.1% for AGIs $50k-75k, 3.9% for AGIs $75k-100k, 3.8% for AGIs over 100k)
IRA payment deduction: $3,396 (reported on 3.0% of returns)
10990:
$3,396
New York:
$3,115
(% of AGI for various income ranges: 0.4% for AGIs $10k-25k, 0.3% for AGIs $25k-50k, 0.2% for AGIs $50k-75k, 0.2% for AGIs $75k-100k, 0.1% for AGIs over 100k)
Self-employed pension: $15,364 (reported on 1.6% of returns)
Here:
$15,364
New York:
$19,016
(% of AGI for various income ranges: 0.2% for AGIs $25k-50k, 0.2% for AGIs $50k-75k, 0.2% for AGIs $75k-100k, 0.5% for AGIs over 100k)
Total itemized deductions: $26,373 (24% of AGI, reported on 56.9% of returns)
Here:
$26,373
State:
$25,864
Here:
23.9% of AGI
State:
21.9% of AGI
(% of AGI for various income ranges: 23.0% for AGIs below $10k, 20.9% for AGIs $10k-25k, 22.0% for AGIs $25k-50k, 25.2% for AGIs $50k-75k, 24.6% for AGIs $75k-100k, 18.8% for AGIs over 100k)
Charity contributions deductions: $2,798 (2% of AGI, reported on 52.9% of returns)
Here:
$2,798
State:
$4,439
Here:
2.5% of AGI
State:
3.6% of AGI
(% of AGI for various income ranges: 1.0% for AGIs below $10k, 1.7% for AGIs $10k-25k, 2.0% for AGIs $25k-50k, 2.3% for AGIs $50k-75k, 2.3% for AGIs $75k-100k, 2.0% for AGIs over 100k)
Total tax: $12,244 (reported on 81.1% of returns)
10990:
$12,244
State:
$11,730
(% of AGI for various income ranges: 3.7% for AGIs below $10k, 4.7% for AGIs $10k-25k, 7.3% for AGIs $25k-50k, 8.0% for AGIs $50k-75k, 9.1% for AGIs $75k-100k, 17.9% for AGIs over 100k)
Earned income credit: $1,437 (reported on 5.5% of returns)
Here:
$1,437
State:
$1,757
Percentage of individuals using paid preparers for their 2004 taxes: 69.3%
Here:
69%
State:
67%
(% for various income ranges: 57.2% for AGIs below $10k, 65.3% for AGIs $10k-25k, 68.1% for AGIs $25k-50k, 75.3% for AGIs $50k-75k, 76.0% for AGIs $75k-100k, 75.5% for AGIs over 100k)
Household received Food Stamps/SNAP in the past 12 months: 326 Household did not receive Food Stamps/SNAP in the past 12 months: 7,653
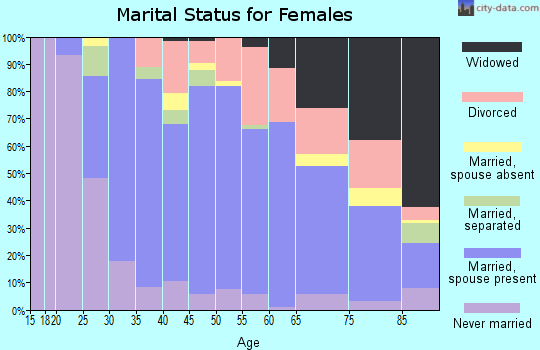
Women who had a birth in the past 12 months: 172 (169 now married, 0 unmarried) Women who did not have a birth in the past 12 months: 3,651 (1,718 now married, 1,913 unmarried)
Housing units in zip code 10990 with a mortgage: 4,018 (653 second mortgage, 22 home equity loan, 604 both second mortgage and home equity loan) Houses without a mortgage: 287
Median monthly owner costs for units with a mortgage: $3,007 Median monthly owner costs for units without a mortgage: $1,268
Residents with income below the poverty level in 2022:
This zip code:
4.8%
Whole state:
14.3%
Residents with income below 50% of the poverty level in 2022:
This zip code:
2.7%
Whole state:
6.8%
Median number of rooms in houses and condos:
Here:
7.0
State:
6.3
Median number of rooms in apartments:
Here:
3.7
State:
3.8
Notable locations in this zip code not listed on our city pages
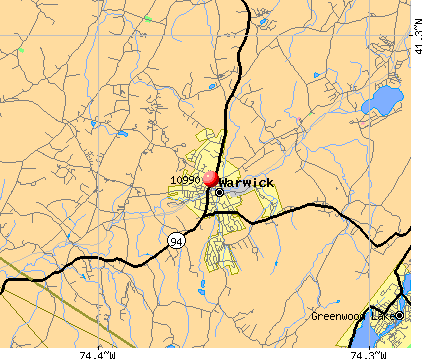
Notable locations in zip code 10990: Lake (A), Wright Family Farm (B), Warwick Drive-In (C), Jessup Road Orchard (D), Crystal Water Farm (E), Scheuermann Farms (F), Fox Ridge Christmas Tree Farm (G), Hickory Hill Golf Course (H), Pond In The Meadows Farm (I), Penningtons Orchard (J), Ochs Orchards (K), Masker Fruit Farms (L), Warwick Valley Country Club (M), Bellvale Farms (N), Cutler Farms (O), Warwick Valley Country Club (P), Applewood Orchards (Q), Blooms Corners (R), Applewood Winery (S), Demarest Hill Winery (T). Display/hide their locations on the map
Shopping Centers: Mitchell Corners Shopping Plaza Shopping Center (1), Flowick Shopping Center (2), Merchant Square Shopping Center (3), Warwick Shopping Center (4). Display/hide their locations on the map
Churches in zip code 10990 include: Saint Pauls Church (A), Saint Peters Church (B), Union African Methodist Episcopal Church (C), Good Shepherd Lutheran Church (D), Saint Stephen Roman Catholic Church (E), Warwick Assembly of God Church (F), Warwick United Methodist Church (G), Christ Episcopal Church (H), Warwick Reformed Church (I). Display/hide their locations on the map
Lakes and reservoirs: Wickham Lake (A), Cascade Lake (B), Warwick Reservoir (C), Glenmere Lake (D), Cindy Linda Lake (E), Hill Lake (F). Display/hide their locations on the map
Parks in zip code 10990 include: Warwick Town Park (1), Warwick Township Veterans Memorial Park (2), Lewis Park (3). Display/hide their locations on the map
3,083 married couples with children.
585 single-parent households (258 men, 327 women).
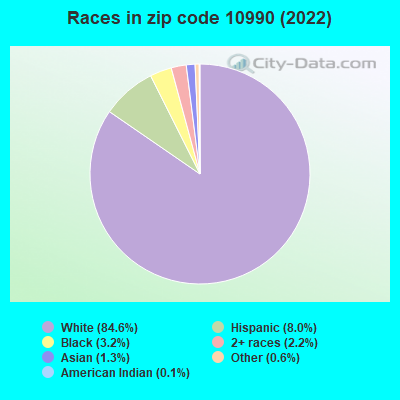
89.5% of residents of 10990 zip code speak English at home.
5.3% of residents speak Spanish at home (67% very well, 19% well, 7% not well, 7% not at all).
4.6% of residents speak other Indo-European language at home (97% very well, 3% well).
0.4% of residents speak Asian or Pacific Island language at home (89% very well, 11% well).
0.2% of residents speak other language at home (94% very well, 6% well).
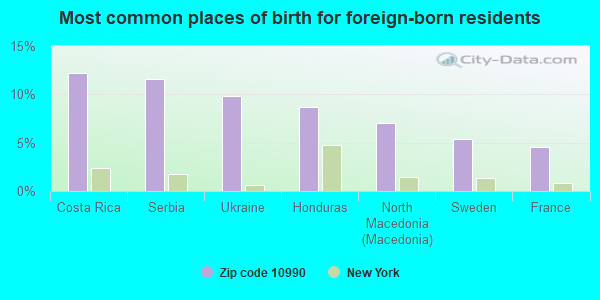
Foreign born population: 1,666 (8.3%) (62.3% of them are naturalized citizens)
This zip code:
8.3%
Whole state:
22.7%
12%Costa Rica
12%Serbia
10%Ukraine
9%Honduras
7%North Macedonia (Macedonia)
5%Sweden
5%France
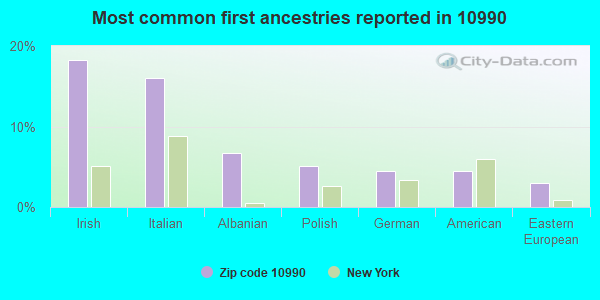
18%Irish
16%Italian
7%Albanian
5%Polish
4%German
4%American
3%Eastern European
Year of entry for the foreign-born population
4912010 or later
3222000 to 2009
2641990 to 1999
860Before 1990
Facilities with environmental interests located in this zip code:
AIR MAJOR (AIRS/AFS) - ICIS-, ENFORCEMENT/COMPLIANCE ACTIVITY STATE MASTER (New York facility tracking) - AIR PROGRAM, National Pollutant Discharge Elimination System Permit, AIR MAJOR, National Pollutant Discharge Elimination System Permit, HAZARDOUS WASTE PROGRAM CRITERIA AND HAZARDOUS AIR POLLUTANT INVENTORY (Inventory of air pollution sources) HAZARDOUS WASTE BIENNIAL REPORTER (Resource Conservation and Recovery Act (tracking hazardous waste)) Large Quantity Generators, more that 1000 kg of hazardous waste/month (Resource Conservation and Recovery Act (tracking hazardous waste)) - notification TSD (Resource Conservation and Recovery Act (tracking hazardous waste)) - notification TRI REPORTER (Tracking of toxic chemicals releasing facilities) Business SIC classification: COMMERCIAL PRINTING; PLATEMAKING AND RELATED SERVICES; NONCLASSIFIABLE ESTABLISHMENTS Business NAICS classification: COMMERCIAL FLEXOGRAPHIC PRINTING.; COMMERCIAL FLEXOGRAPHIC PRINTING. Organizations: GEORGIA-PACIFIC CORP (CONTACT/OPERATOR)
, DAVID M ROOT (CONTACT/OWNER)
, GEORGIA PACIFIC CORP (LEGALLY RESPONSIBLE PARTY)
Alternative names: GEORGIA PACIFIC CORPORATION
GREATER DISPLAY (32 DEKAY RD in WARWICK, NY)
STATE MASTER (New York facility tracking) - National Pollutant Discharge Elimination System Permit, AIR PROGRAM, National Pollutant Discharge Elimination System Permit (Resource Conservation and Recovery Act (tracking hazardous waste)) Business SIC classification: SERVICES Organizations: GREATER DISPLAY INC (LEGALLY RESPONSIBLE PARTY)
Alternative names: GREATER DISPLAY & WIRE FORM INC
COUNTRY CHEVROLET & OLDS INC (95 MAIN ST in WARWICK, NY)
STATE MASTER (New York facility tracking) - AIR PROGRAM, (Resource Conservation and Recovery Act (tracking hazardous waste)) Alternative names: COUNTRY CHEVROLET OLDS INC
AIRPORT RD ADN KNIGHTS LANE ( in WARWICK, NY)
National Pollutant Discharge Elimination System NON-MAJOR (Tracking pollutant discharge elimination systems) - permit Organizations: WICKHAM LAKE HOMES INC (CONTACT/OWNER)
Alternative names: WICKHAM LAKE HOMES
CHRYSLER JEEP DODGE OF WARWICK (185 RTE 94 S in WARWICK, NY)
Small Quantity Generators, between 100 kg and 1000 kg of hazardous waste/month (Resource Conservation and Recovery Act (tracking hazardous waste)) Organizations: MICHAEL ANNUNZIATA (CONTACT/OPERATOR)
, MICHAEL ANNUZIATA (CONTACT/OWNER)
Conditionally Exempt Small Quantity Generators, less than 100 kg/month of hazardous waste (Resource Conservation and Recovery Act (tracking hazardous waste)) - notification Organizations: CONKLIN & STRONG INC (CONTACT/OWNER)
INCO RESEARCH & DEVELOPMENT (RTE 84 STERLING FOREST in WARWICK TWP, NY)
TRANSPORTER (Resource Conservation and Recovery Act (tracking hazardous waste))
Housing units lacking complete kitchen facilities: 1.0%
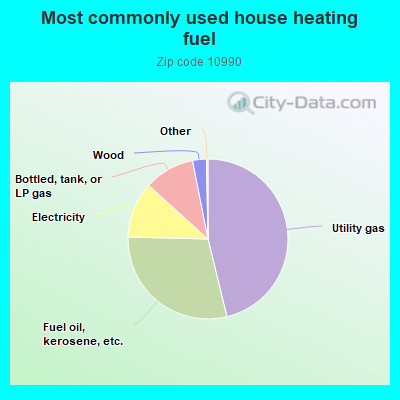
46.2%Utility gas
29.2%Fuel oil, kerosene, etc.
11.3%Electricity
10.2%Bottled, tank, or LP gas
2.8%Wood
Population in 1990: 16,960. Population change in the 1990s: +2,355 (+13.9%).
Place of birth for U.S.-born residents:
This state: 12,775
Northeast: 3,973
Midwest: 422
South: 747
West: 314
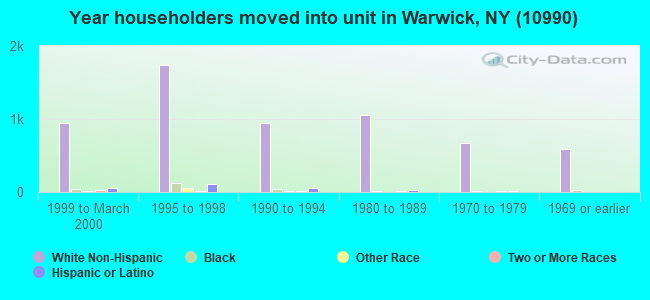
59% of the 10990 zip code residents lived in the same house 5 years ago. Out of people who lived in different houses, 45% lived in this county. Out of people who lived in different counties, 50% lived in New York.
93% of the 10990 zip code residents lived in the same house 1 year ago. Out of people who lived in different houses, 53% moved from this county. Out of people who lived in different houses, 23% moved from different county within same state. Out of people who lived in different houses, 18% moved from different state. Out of people who lived in different houses, 6% moved from abroad.
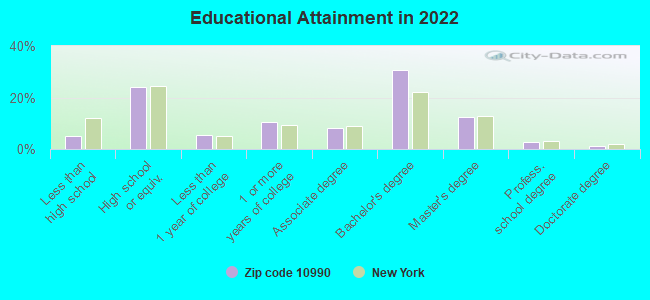
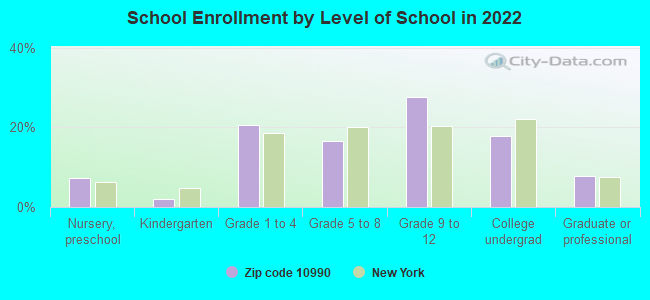
Private vs. public school enrollment:
Students in private schools in grades 1 to 8 (elementary and middle school): 55
Here:
3.3%
New York:
15.6%
Students in private schools in grades 9 to 12 (high school): 97
Here:
7.7%
New York:
15.0%
Students in private undergraduate colleges: 210
Here:
25.8%
New York:
39.2%
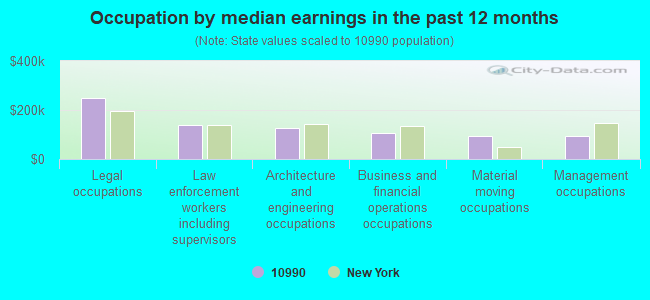
Occupation by median earnings in the past 12 months ($)
247,483Legal occupations
137,049Law enforcement workers including supervisors
127,142Architecture and engineering occupations
106,568Business and financial operations occupations
94,761Material moving occupations
92,638Management occupations
Companies with federal contracts located in this zip code:
SKE INTERNATIONAL INC (2 JOCKEY HOLLOW RD in WARWICK, NY) : $10,170,598 in 22 contractsfrom 2005 to 2006
Contracts for Construction of Structures and Facilities -- Miscellaneous Buildings, Maintenance, Repair or Alteration of Real Property -- Office Buildings by Army Signed by year:2000: $0; 2001: $0; 2002: $0; 2003: $0; 2004: $0; 2005: $1,796,476; 2006: $8,374,122.
Biggest contracts:
$4,218,554 with Army for Construction of Structures and Facilities -- Miscellaneous Buildings. Taking place in KS. Signed on 2006-02-24. Completion date: 2007-02-21.
$3,636,807, same as above.Signed on 2006-04-13. Completion date: 2007-04-30.
$542,870, same as above.Signed on 2006-02-28. Completion date: 2006-03-31.
$542,870, same as above.Signed on 2006-02-01. Completion date: 2006-08-21.
L M DULYE & CO (52 KAIN RD in WARWICK, NY; small business) : $258,538 in 9 contractsfrom 2002 to 2005
Contracts for Data Analyses (other than scientific), by Army, U.S. Army Corps of Engineers - civil program financing only, NASA Signed by year:2000: $0; 2001: $0; 2002: $22,500; 2003: $0; 2004: $32,000; 2005: $204,038; 2006: $0.
Biggest contracts:
$65,000 with Army for Data Analyses (other than scientific). Signed on 2005-06-22. Completion date: 2005-09-30.
$65,000 with U.S. Army Corps of Engineers - civil program financing only for Data Analyses (other than scientific). Signed on 2005-06-22. Completion date: 2005-09-30.
$22,500 with NASA for . Signed on 2002-09-30. Effective on 2002-06-01. Completion date: 2003-02-15.
$20,211 with U.S. Army Corps of Engineers - civil program financing only for Data Analyses (other than scientific). Taking place in TN. Signed on 2005-01-20. Completion date: 2005-05-16.
MECHANICAL RUBBER PRDTS CO INC (77 FORESTER AVE STE 1 in WARWICK, NY) : $116,215 in 18 contractsfrom 2003 to 2006
Contracts for Packing and Gasket Materials, Chemical Weapons and Equipment, Water Distillation Equipment, Marine and Industrial, Miscellaneous Fabricated Nonmetallic Materials, and moreby Defense Logistics Agency, Navy, Army Signed by year:2000: $0; 2001: $0; 2002: $0; 2003: $1,980; 2004: $6,176; 2005: $99,181; 2006: $8,878.
Biggest contracts:
$43,262 with Defense Logistics Agency for Packing and Gasket Materials. Signed on 2005-10-17. Completion date: 2006-09-05.
$8,165, same as above.Signed on 2005-08-15. Completion date: 2005-10-01.
$5,811, same as above.Signed on 2005-04-11. Completion date: 2005-05-21.
$5,386, same as above.Signed on 2006-01-26. Completion date: 2006-03-08.
john mickowski (50 Walling Road in Warwick, NY; small business)
$66,075 with Offices, Boards and Divisions (includes Attorney General, Deputy Attorney General, etc.) for Legal Services. Taking place in DC. Signed on 2005-07-26. Completion date: 2005-11-30.
GNB SALES INC (118 LAUDATEN WAY in WARWICK, NY; small business)
$54,000 with Army for Camouflage and Deception Equipment. Signed on 2001-06-01. Completion date: 2002-01-02.
A G CONTRACTORS (17 RIVER ST STE 11 in WARWICK, NY; small business) : $50,760 in 3 contractsfrom 2003 to 2004
$39,100 with Army for Maintenance, Repair or Alteration of Real Property -- Religious Facilities. Signed on 2003-05-14. Completion date: 2003-09-30.
$9,250, same as above.Signed on 2004-08-12. Completion date: 2004-05-21.
$2,410, same as above.Signed on 2003-09-29. Completion date: 2003-09-30.
Top industries in this zip code by the number of employees in 2005:
Health Care and Social Assistance: General Medical and Surgical Hospitals (250-499 employees: 1 establishment)
Health Care and Social Assistance: Offices of Physicians (except Mental Health Specialists) (20-49: 2, 10-19: 3, 5-9: 8, 1-4: 11)
2002 - 2018 National Fire Incident Reporting System (NFIRS) incidents
According to the data from the years 2002 - 2018 the average number of fire incidents per year is 50. The highest number of reported fires - 73 took place in 2016, and the least - 18 in 2004. The data has a declining trend.
When looking into fire subcategories, the most incidents belonged to: Structure Fires (46.0%), and Outside Fires (39.3%).
Fire incident types reported to NFIRS in Zip Code 10990


 Nearest zip codes: 10921, 10925, 07421, 10979, 07422, 10924.


 According to the data from the years 2002 - 2018 the average number of fire incidents per year is 50. The highest number of reported fires - 73 took place in 2016, and the least - 18 in 2004. The data has a declining trend.
 When looking into fire subcategories, the most incidents belonged to: Structure Fires (46.0%), and Outside Fires (39.3%).