Estimated zip code population in 2022: 13,743 Zip code population in 2010: 13,120 Zip code population in 2000: 12,308
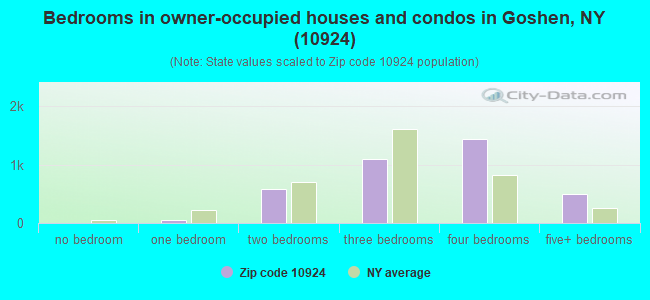
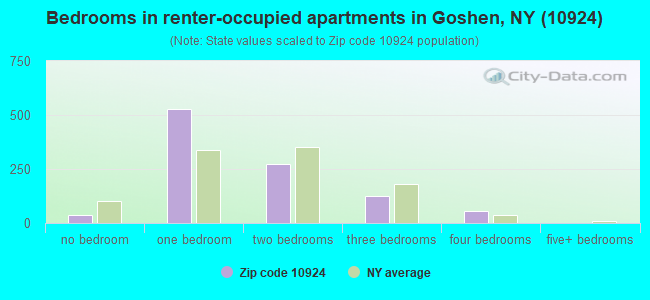
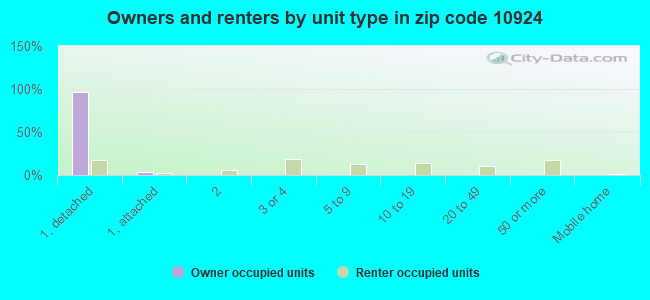
Houses and condos: 5,047 Renter-occupied apartments: 1,019
% of renters here:
22%
State:
46%
March 2022 cost of living index in zip code 10924: 133.6 (high, U.S. average is 100)
Land area: 38.3 sq. mi. Water area: 0.2 sq. mi.
Population density: 358 people per square mile
(very low).
OSM Map
General Map
Google Map
MSN Map
OSM Map
General Map
Google Map
MSN Map
OSM Map
General Map
Google Map
MSN Map
OSM Map
General Map
Google Map
MSN Map
Please wait while loading the map...
Real estate property taxes paid for housing units in 2022:
This zip code:
2.4% ($9,805)
New York:
1.5% ($6,180)
Median real estate property taxes paid for housing units with mortgages in 2022: $9,717 (2.3%) Median real estate property taxes paid for housing units with no mortgage in 2022: $9,755 (2.4%)
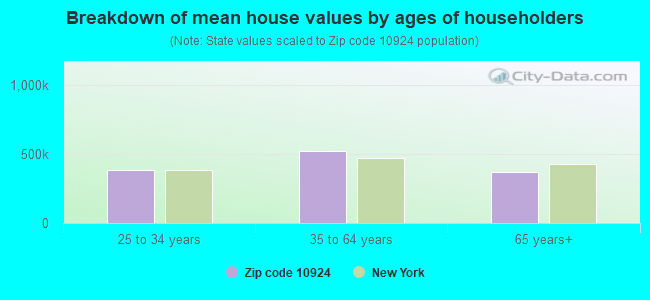
Estimated median house/condo value in 2022: $411,241
10924:
$411,241
New York:
$400,400
According to our research of New York and other state lists, there were 16 registered sex offenders living in 10924 zip code as of April 27, 2024. The ratio of all residents to sex offenders in zip code 10924 is 849 to 1. The ratio of registered sex offenders to all residents in this zip code is near the state average.
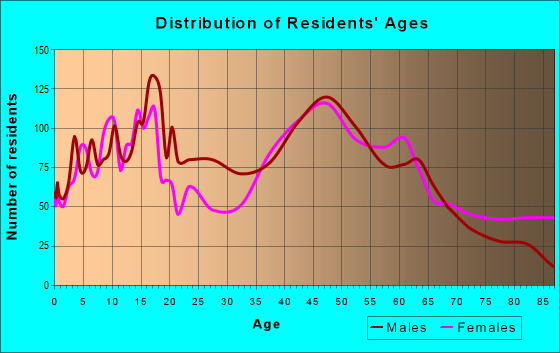
Median resident age:
This zip code:
44.0 years
New York median age:
40.0 years
Average household size:
This zip code:
2.7 people
New York:
2.5 people
Averages for the 2020 tax year for zip code 10924, filed in 2021:
Average Adjusted Gross Income (AGI) in 2020: $101,168 (Individual Income Tax Returns)
Here:
$101,168
State:
$90,930
Salary/wage: $83,467 (reported on 80.8% of returns)
Here:
$83,467
State:
$72,104
(% of AGI for various income ranges: 1348.1% for AGIs below $25k, 3681.4% for AGIs $25k-50k, 6463.2% for AGIs $50k-75k, 9983.2% for AGIs $75k-100k, 18189.4% for AGIs $100k-200k, 74392.2% for AGIs over 200k)
Taxable interest for individuals: $1,531 (reported on 44.3% of returns)
This zip code:
$1,531
New York:
$3,075
(% of AGI for various income ranges: 34.4% for AGIs below $25k, 35.9% for AGIs $25k-50k, 51.9% for AGIs $50k-75k, 70.5% for AGIs $75k-100k, 139.1% for AGIs $100k-200k, 917.0% for AGIs over 200k)
Ordinary dividends: $5,884 (reported on 26.9% of returns)
Here:
$5,884
State:
$11,095
(% of AGI for various income ranges: 46.1% for AGIs below $25k, 71.1% for AGIs $25k-50k, 98.7% for AGIs $50k-75k, 188.3% for AGIs $75k-100k, 284.9% for AGIs $100k-200k, 2498.7% for AGIs over 200k)
Net capital gain/loss in AGI: +$15,236 (reported on 23.4% of returns)
Here:
+$15,236
State:
+$44,925
(% of AGI for various income ranges: 25.4% for AGIs below $25k, 33.6% for AGIs $25k-50k, 93.5% for AGIs $50k-75k, 143.2% for AGIs $75k-100k, 442.5% for AGIs $100k-200k, 7961.3% for AGIs over 200k)
Profit/loss from business: +$21,823 (reported on 14.5% of returns)
Here:
+$21,823
State:
+$14,940
(% of AGI for various income ranges: 131.4% for AGIs below $25k, 116.0% for AGIs $25k-50k, 171.7% for AGIs $50k-75k, 317.8% for AGIs $75k-100k, 461.2% for AGIs $100k-200k, 5500.9% for AGIs over 200k)
Taxable individual retirement arrangement distribution: $23,029 (reported on 8.8% of returns)
10924:
$23,029
New York:
$19,609
(% of AGI for various income ranges: 48.8% for AGIs below $25k, 100.2% for AGIs $25k-50k, 191.7% for AGIs $50k-75k, 351.7% for AGIs $75k-100k, 597.8% for AGIs $100k-200k, 1982.6% for AGIs over 200k)
Self-employed (Keogh) retirement plans: $31,271 (reported on 1.0% of returns)
10924:
$31,271
New York:
$32,497
(% of AGI for various income ranges: 49.9% for AGIs $100k-200k, 767.4% for AGIs over 200k)
Total itemized deductions: $31,021 (reported on 16.0% of returns)
Here:
$31,021
State:
$39,326
(% of AGI for various income ranges: 129.9% for AGIs below $25k, 269.2% for AGIs $25k-50k, 588.1% for AGIs $50k-75k, 1005.4% for AGIs $75k-100k, 1163.1% for AGIs $100k-200k, 5222.6% for AGIs over 200k)
Charity contributions: $5,568 (reported on 13.5% of returns)
Here:
$5,568
State:
$15,420
(% of AGI for various income ranges: 5.6% for AGIs below $25k, 23.0% for AGIs $25k-50k, 48.4% for AGIs $50k-75k, 87.3% for AGIs $75k-100k, 167.2% for AGIs $100k-200k, 1166.5% for AGIs over 200k)
Taxes paid: $8,913 (reported on 16.0% of returns)
10924:
$8,913
State:
$9,183
(% of AGI for various income ranges: 28.1% for AGIs below $25k, 69.6% for AGIs $25k-50k, 162.5% for AGIs $50k-75k, 313.7% for AGIs $75k-100k, 391.5% for AGIs $100k-200k, 1327.8% for AGIs over 200k)
Earned income credit: $1,841 (reported on 7.3% of returns)
Here:
$1,841
State:
$2,138
(% of AGI for various income ranges: 51.7% for AGIs below $25k, 49.5% for AGIs $25k-50k)
Percentage of individuals using paid preparers for their 2020 taxes: 93.9%
Here:
94%
State:
95%
(% for various income ranges: 91.1% for AGIs below $25k, 94.0% for AGIs $25k-50k, 95.7% for AGIs $50k-75k, 94.0% for AGIs $75k-100k, 94.0% for AGIs $100k-200k, 97.3% for AGIs over 200k)
Averages for the 2012 tax year for zip code 10924, filed in 2013:
Average Adjusted Gross Income (AGI) in 2012: $86,158 (Individual Income Tax Returns)
Here:
$86,158
State:
$77,088
Salary/wage: $71,612 (reported on 82.8% of returns)
Here:
$71,612
State:
$60,593
(% of AGI for various income ranges: 71.5% for AGIs below $25k, 72.0% for AGIs $25k-50k, 74.5% for AGIs $50k-75k, 71.5% for AGIs $75k-100k, 77.6% for AGIs $100k-200k, 57.7% for AGIs over 200k)
Taxable interest for individuals: $1,509 (reported on 49.1% of returns)
This zip code:
$1,509
New York:
$3,125
(% of AGI for various income ranges: 1.5% for AGIs below $25k, 1.1% for AGIs $25k-50k, 0.8% for AGIs $50k-75k, 0.9% for AGIs $75k-100k, 0.7% for AGIs $100k-200k, 0.8% for AGIs over 200k)
Ordinary dividends: $7,034 (reported on 30.4% of returns)
Here:
$7,034
State:
$10,299
(% of AGI for various income ranges: 2.5% for AGIs below $25k, 1.8% for AGIs $25k-50k, 1.6% for AGIs $50k-75k, 1.3% for AGIs $75k-100k, 1.3% for AGIs $100k-200k, 4.2% for AGIs over 200k)
Net capital gain/loss in AGI: +$7,116 (reported on 22.3% of returns)
Here:
+$7,116
State:
+$42,474
(% of AGI for various income ranges: 0.4% for AGIs $50k-75k, 0.8% for AGIs $75k-100k, 1.0% for AGIs $100k-200k, 3.9% for AGIs over 200k)
Profit/loss from business: +$22,006 (reported on 14.6% of returns)
Here:
+$22,006
State:
+$16,168
(% of AGI for various income ranges: 6.5% for AGIs below $25k, 3.7% for AGIs $25k-50k, 1.7% for AGIs $50k-75k, 1.3% for AGIs $75k-100k, 3.1% for AGIs $100k-200k, 5.2% for AGIs over 200k)
Taxable individual retirement arrangement distribution: $15,697 (reported on 10.8% of returns)
10924:
$15,697
New York:
$17,621
(% of AGI for various income ranges: 2.7% for AGIs below $25k, 2.6% for AGIs $25k-50k, 2.2% for AGIs $50k-75k, 2.6% for AGIs $75k-100k, 1.7% for AGIs $100k-200k, 1.7% for AGIs over 200k)
Self-employment retirement plans: $25,500 (reported on 1.9% of returns)
10924:
$25,500
New York:
$27,330
(% of AGI for various income ranges: 0.9% for AGIs below $25k, 0.3% for AGIs $100k-200k, 1.2% for AGIs over 200k)
Total itemized deductions: $31,817 (22% of AGI, reported on 49.9% of returns)
Here:
$31,817
State:
$34,985
Here:
22.3% of AGI
State:
21.3% of AGI
(% of AGI for various income ranges: 18.6% for AGIs below $25k, 16.1% for AGIs $25k-50k, 18.2% for AGIs $50k-75k, 20.6% for AGIs $75k-100k, 21.0% for AGIs $100k-200k, 16.0% for AGIs over 200k)
Charity contributions: $2,870 (reported on 42.9% of returns)
Here:
$2,870
State:
$5,572
(% of AGI for various income ranges: 0.8% for AGIs below $25k, 1.0% for AGIs $25k-50k, 1.4% for AGIs $50k-75k, 1.4% for AGIs $75k-100k, 1.6% for AGIs $100k-200k, 1.4% for AGIs over 200k)
Taxes paid: $17,376 (reported on 49.6% of returns)
10924:
$17,376
State:
$18,656
(% of AGI for various income ranges: 7.4% for AGIs below $25k, 6.2% for AGIs $25k-50k, 8.0% for AGIs $50k-75k, 9.9% for AGIs $75k-100k, 11.1% for AGIs $100k-200k, 10.6% for AGIs over 200k)
Earned income credit: $1,855 (reported on 7.5% of returns)
Here:
$1,855
State:
$2,230
(% of AGI for various income ranges: 2.9% for AGIs below $25k, 0.6% for AGIs $25k-50k)
Percentage of individuals using paid preparers for their 2012 taxes: 67.1%
Here:
67%
State:
66%
(% for various income ranges: 58.4% for AGIs below $25k, 63.4% for AGIs $25k-50k, 64.9% for AGIs $50k-75k, 70.0% for AGIs $75k-100k, 77.5% for AGIs $100k-200k, 83.7% for AGIs over 200k)
Averages for the 2004 tax year for zip code 10924, filed in 2005:
Average Adjusted Gross Income (AGI) in 2004: $74,041 (Individual Income Tax Returns)
Here:
$74,041
State:
$59,519
Salary/wage: $61,937 (reported on 81.4% of returns)
Here:
$61,937
State:
$50,673
(% of AGI for various income ranges: 83.3% for AGIs below $10k, 63.4% for AGIs $10k-25k, 74.8% for AGIs $25k-50k, 75.1% for AGIs $50k-75k, 78.9% for AGIs $75k-100k, 63.3% for AGIs over 100k)
Taxable interest for individuals: $1,867 (reported on 64.8% of returns)
This zip code:
$1,867
New York:
$2,377
(% of AGI for various income ranges: 8.1% for AGIs below $10k, 4.0% for AGIs $10k-25k, 2.4% for AGIs $25k-50k, 1.6% for AGIs $50k-75k, 1.3% for AGIs $75k-100k, 1.3% for AGIs over 100k)
Taxable dividends: $2,672 (reported on 39.2% of returns)
Here:
$2,672
State:
$5,394
(% of AGI for various income ranges: 7.7% for AGIs below $10k, 3.4% for AGIs $10k-25k, 1.7% for AGIs $25k-50k, 1.9% for AGIs $50k-75k, 1.1% for AGIs $75k-100k, 1.1% for AGIs over 100k)
Net capital gain/loss: +$17,999 (reported on 30.5% of returns)
Here:
+$17,999
State:
+$23,581
(% of AGI for various income ranges: -6.8% for AGIs below $10k, 0.8% for AGIs $10k-25k, 0.4% for AGIs $25k-50k, 1.5% for AGIs $50k-75k, 1.7% for AGIs $75k-100k, 11.5% for AGIs over 100k)
Profit/loss from business: +$25,197 (reported on 14.7% of returns)
Here:
+$25,197
State:
+$13,809
(% of AGI for various income ranges: 6.0% for AGIs below $10k, 6.9% for AGIs $10k-25k, 3.4% for AGIs $25k-50k, 2.3% for AGIs $50k-75k, 3.2% for AGIs $75k-100k, 6.1% for AGIs over 100k)
Profit/loss from farming: +$4,837 (reported on 0.8% of returns)
Here:
+$4,837
State:
-$2,666
(% of AGI for various income ranges: 0.1% for AGIs $10k-25k, 0.5% for AGIs $50k-75k, -0.0% for AGIs over 100k)
IRA payment deduction: $3,421 (reported on 3.7% of returns)
10924:
$3,421
New York:
$3,115
(% of AGI for various income ranges: 0.4% for AGIs $10k-25k, 0.3% for AGIs $25k-50k, 0.3% for AGIs $50k-75k, 0.2% for AGIs $75k-100k, 0.1% for AGIs over 100k)
Self-employed pension: $21,388 (reported on 1.8% of returns)
Here:
$21,388
New York:
$19,016
Total itemized deductions: $27,171 (23% of AGI, reported on 51.4% of returns)
Here:
$27,171
State:
$25,864
Here:
23.4% of AGI
State:
21.9% of AGI
(% of AGI for various income ranges: 19.8% for AGIs below $10k, 19.6% for AGIs $10k-25k, 18.9% for AGIs $25k-50k, 21.6% for AGIs $50k-75k, 22.7% for AGIs $75k-100k, 17.4% for AGIs over 100k)
Charity contributions deductions: $2,950 (2% of AGI, reported on 47.9% of returns)
Here:
$2,950
State:
$4,439
Here:
2.4% of AGI
State:
3.6% of AGI
(% of AGI for various income ranges: 0.5% for AGIs below $10k, 1.3% for AGIs $10k-25k, 1.7% for AGIs $25k-50k, 2.2% for AGIs $50k-75k, 2.1% for AGIs $75k-100k, 1.9% for AGIs over 100k)
Total tax: $13,389 (reported on 81.0% of returns)
10924:
$13,389
State:
$11,730
(% of AGI for various income ranges: 2.6% for AGIs below $10k, 4.8% for AGIs $10k-25k, 7.4% for AGIs $25k-50k, 8.8% for AGIs $50k-75k, 9.7% for AGIs $75k-100k, 18.8% for AGIs over 100k)
Earned income credit: $1,442 (reported on 6.4% of returns)
Here:
$1,442
State:
$1,757
Percentage of individuals using paid preparers for their 2004 taxes: 71.2%
Here:
71%
State:
67%
(% for various income ranges: 63.3% for AGIs below $10k, 66.9% for AGIs $10k-25k, 67.9% for AGIs $25k-50k, 74.7% for AGIs $50k-75k, 74.6% for AGIs $75k-100k, 80.3% for AGIs over 100k)
Likely homosexual households (counted as self-reported same-sex unmarried-partner households)
Lesbian couples: 0.0% of all households
Gay men: 0.1% of all households
Household received Food Stamps/SNAP in the past 12 months: 254 Household did not receive Food Stamps/SNAP in the past 12 months: 4,405
Women who had a birth in the past 12 months: 227 (192 now married, 32 unmarried) Women who did not have a birth in the past 12 months: 2,476 (989 now married, 1,482 unmarried)
Housing units in zip code 10924 with a mortgage: 2,496 (288 second mortgage, 27 home equity loan, 202 both second mortgage and home equity loan) Houses without a mortgage: 143
Median monthly owner costs for units with a mortgage: $2,977 Median monthly owner costs for units without a mortgage: $1,310
Residents with income below the poverty level in 2022:
This zip code:
5.5%
Whole state:
14.3%
Residents with income below 50% of the poverty level in 2022:
This zip code:
0.6%
Whole state:
6.8%
Median number of rooms in houses and condos:
Here:
7.4
State:
6.3
Median number of rooms in apartments:
Here:
3.3
State:
3.8
Notable locations in this zip code not listed on our city pages
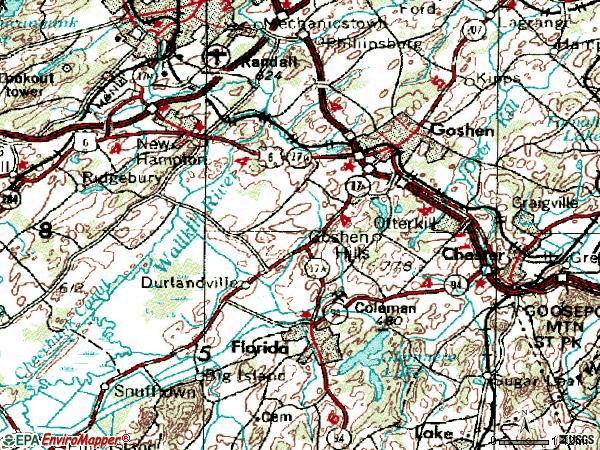
Notable locations in zip code 10924: Silent Farm Stables (A), Westgate Office Park (B), Al Turi Landfill (C), Bordens Dairy (D), Rainbow Building (E), Orange County Government Center (F), Goshen Professional Building (G), Orange County Correctional Facility (H), Goshen Library (I), Harness Racing Museum and Hall of Fame (J), Goshen Town Hall (K), Glen Arden Nursing Home (L). Display/hide their locations on the map
Churches in zip code 10924 include: Saint John's African Union Methodist Protestant Church (A), Kingdom Hall of Jehovah's Witnesses (B), Goshen Christian Reformed Church (C), Calvary Chapel of Orange County (D), First Presbyterian Church (E), Goshen United Methodist Church (F), Saint John The Evangelist Roman Catholic Church (G), Saint James Episcopal Church (H), Saint Dominic's Church (I). Display/hide their locations on the map
2,157 married couples with children.
277 single-parent households (48 men, 229 women).
80.6% of residents of 10924 zip code speak English at home.
11.6% of residents speak Spanish at home (63% very well, 25% well, 11% not well, 1% not at all).
5.0% of residents speak other Indo-European language at home (73% very well, 13% well, 13% not well, 1% not at all).
2.1% of residents speak Asian or Pacific Island language at home (68% very well, 6% well, 26% not well).
0.6% of residents speak other language at home (100% very well).
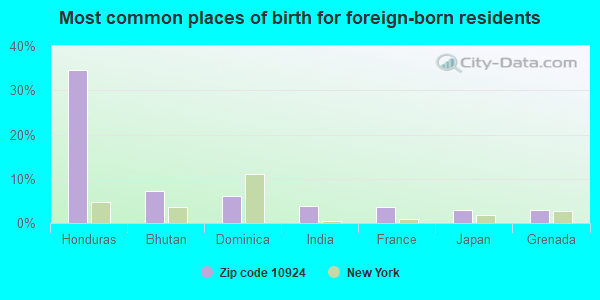
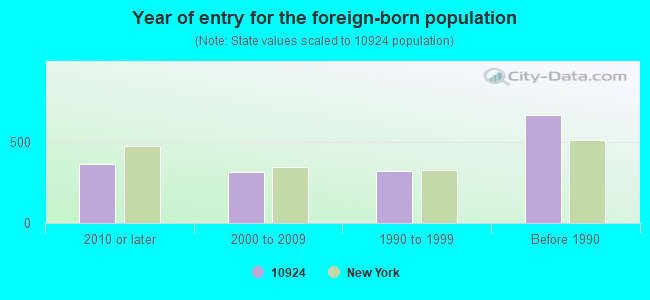
Foreign born population: 1,370 (10.0%) (45.9% of them are naturalized citizens)
Major facilities with environmental interests located in this zip code:
AL TURI LANDFILL & LFGTE FACILITY (73 HARTLEY ROAD in GOSHEN, NY)
AIR MAJOR (AIRS/AFS) - ICIS-, ENFORCEMENT/COMPLIANCE ACTIVITY AIR MAJOR (AIRS/AFS) STATE MASTER (New York facility tracking) - AIR PROGRAM, MINE OPERATING PERMIT, REFUSE DISPOSAL, AIR PROGRAM, REFUSE DISPOSAL, REFUSE DISPOSAL, SOLID WASTE PROGRAM, AIR PROGRAM, REFUSE DISPOSAL, National Pollutant Discharge Elimination System Permit, MINE OPERATING PERMIT, SOLID WASTE PROGRAM, National Pollutant Discharge Elimination System Permit STATE MASTER (New York facility tracking) - AIR MAJOR, CRITERIA AND HAZARDOUS AIR POLLUTANT INVENTORY (Inventory of air pollution sources) National Pollutant Discharge Elimination System NON-MAJOR (Tracking pollutant discharge elimination systems) - permit (Resource Conservation and Recovery Act (tracking hazardous waste)) Business SIC classification: ELECTRIC AND OTHER SERVICES COMBINED; REFUSE SYSTEMS Business NAICS classification: SOLID WASTE LANDFILL. Organizations: AL TURI LANDFILL INC, AMERESCO LFG-1 INC, AL TURI LANDFILL, INC (CONTACT/OWNER)
, JOSEPH J GURDA (FACILITY APPLICATION CONTACT)
, SUPERIOR HUDSON VALLEY (LEGALLY RESPONSIBLE PARTY)
, AL TURI LANDFILL INC (LEGALLY RESPONSIBLE PARTY)
Alternative names: SUPERIOR HUDSON VALLY (AL TURI) LANDFILL
AL TURI LFGTE FACILITY (91 HARTLEY ROAD in GOSHEN, NY)
AIR MAJOR (AIRS/AFS) - ICIS-, ENFORCEMENT/COMPLIANCE ACTIVITY STATE MASTER (New York facility tracking) - REFUSE DISPOSAL, AIR PROGRAM, SOLID WASTE PROGRAM, SOLID WASTE PROGRAM, CRITERIA AND HAZARDOUS AIR POLLUTANT INVENTORY (Inventory of air pollution sources) (Resource Conservation and Recovery Act (tracking hazardous waste)) Business SIC classification: ELECTRIC AND OTHER SERVICES COMBINED Business NAICS classification: OTHER ELECTRIC POWER GENERATION. Organizations: J W OPERATING/AL TURI (CONTACT/OWNER)
, MIDDLETOWN LFG LTD (LEGALLY RESPONSIBLE PARTY)
, AMERESCO LFG-1 INC (LEGALLY RESPONSIBLE PARTY)
Alternative names: J W OPERATING
GOSHEN WASTE WATER TREATMENT PLANT (ROUTE 17 & FLETCHER STREET in GOSHEN, NY)
(Integrated Compliance Information System) - ICIS-02-1995-0221, FORMAL ENFORCEMENT ACTION National Pollutant Discharge Elimination System MAJOR (Tracking pollutant discharge elimination systems) - permit - ICIS-, ENFORCEMENT/COMPLIANCE ACTIVITY Business SIC classification: SEWERAGE SYSTEMS Organizations: GOSHEN (V) (CONTACT/OWNER)
Alternative names: GOSHEN (V), GOSHEN (V) WWTP, GOSHEN WWTP
GOSHEN PATIENT SERVICE CENTER (70 HATFIELD LANE in GOSHEN, NY)
ENFORCEMENT/COMPLIANCE ACTIVITY (Integrated Compliance Information System) - ICIS-02-2004-0823, FORMAL ENFORCEMENT ACTION (Integrated Compliance Information System) - ICIS-02-2004-0823, FORMAL ENFORCEMENT ACTION
HORIZON IMAGING (40 MATTHEWS STREET in GOSHEN, NY)
ENFORCEMENT/COMPLIANCE ACTIVITY (Integrated Compliance Information System) - ICIS-02-2004-0823, FORMAL ENFORCEMENT ACTION (Integrated Compliance Information System) - ICIS-02-2004-0823, FORMAL ENFORCEMENT ACTION
GOSHEN CENTRAL HS ( in GOSHEN, NY)
(National Center for Education Statistics) - STATE ID-440601040001 Organizations: GOSHEN CSD (SCHOOL DISTRICT)
GOSHEN IS ( in GOSHEN, NY)
(National Center for Education Statistics) - STATE ID-440601040005 Organizations: GOSHEN CSD (SCHOOL DISTRICT)
GOSHEN QUARRY (220 ROUTE 17A in GOSHEN, NY)
AIR SYNTHETIC MINOR (AIRS/AFS) National Pollutant Discharge Elimination System NON-MAJOR (Tracking pollutant discharge elimination systems) - permit (Resource Conservation and Recovery Act (tracking hazardous waste)) Business SIC classification: CRUSHED AND BROKEN STONE; ASPHALT PAVING MIXTURES AND BLOCKS Organizations: DUTCHESS QUARRY & SUPPLY CO (CONTACT/OWNER)
Alternative names: DUTCHESS QUARRY & SUPPLY CO, DUTCHESS QUARRY & SUPPLY GOSHEN, DUTCHESS QUARRY & SUPPLY GOSHEN QUARRY
GOSHEN RES CTR ( in GOSHEN, NY)
(National Center for Education Statistics) - STATE ID-440601977423 Organizations: GOSHEN CSD (SCHOOL DISTRICT)
GOSHEN RESIDENTIAL CTR (CROSS RD in GOSHEN, NY)
(Integrated Compliance Information System) - ICIS-02-2001-8066, FORMAL ENFORCEMENT ACTION Business SIC classification: WATER SUPPLY
GOSHEN TERMINAL (289 WEST MAIN STREET in GOSHEN, NY)
National Pollutant Discharge Elimination System NON-MAJOR (Tracking pollutant discharge elimination systems) - permit Business SIC classification: PETROLEUM BULK STATIONS AND TERMINALS Organizations: PANCO PETROLEUM COMPANY (CONTACT/OWNER)
, PANCO PETROLEUM CO (CONTACT/OWNER)
Alternative names: PANCO PETROLEUM CO
I & J EXIT 124 INC (GREENWICH AVE & RTE 17 in GOSHEN, NY)
(Resource Conservation and Recovery Act (tracking hazardous waste)) Organizations: MOBIL OIL CORPORATION (CONTACT/OPERATOR)
GOSHEN CHRISTIAN SCHOOL (FLORIDA RD in GOSHEN, NY)
COMPLIANCE ACTIVITY (Tracking inspections of insecticide, fungicide, and rodenticide, and toxic substances)
Housing units lacking complete plumbing facilities: 1.0% Housing units lacking complete kitchen facilities: 1.4%
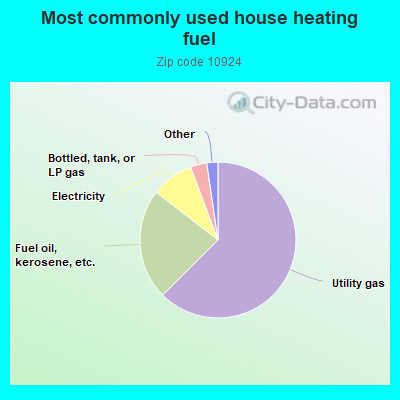
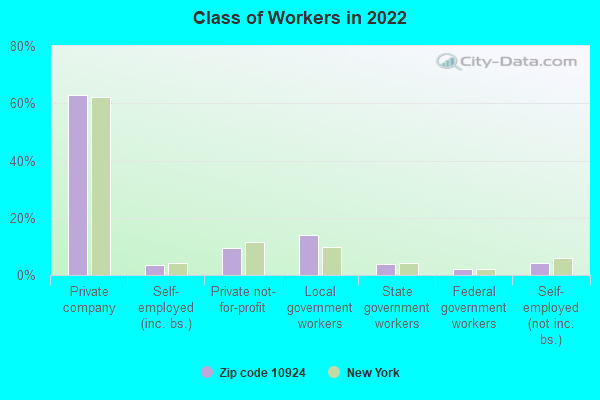
62.6%Utility gas
23.0%Fuel oil, kerosene, etc.
8.8%Electricity
3.4%Bottled, tank, or LP gas
0.9%Solar energy
0.7%Wood
Population in 1990: 11,019. Population change in the 1990s: +1,289 (+11.7%).
Place of birth for U.S.-born residents:
This state: 9,061
Northeast: 2,168
Midwest: 230
South: 343
West: 245
55% of the 10924 zip code residents lived in the same house 5 years ago. Out of people who lived in different houses, 56% lived in this county. Out of people who lived in different counties, 50% lived in New York.
89% of the 10924 zip code residents lived in the same house 1 year ago. Out of people who lived in different houses, 55% moved from this county. Out of people who lived in different houses, 29% moved from different county within same state. Out of people who lived in different houses, 11% moved from different state. Out of people who lived in different houses, 5% moved from abroad.
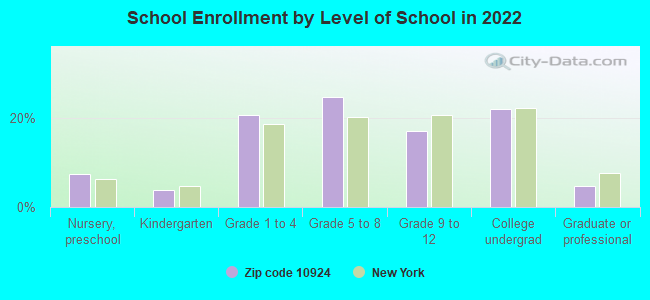
Private vs. public school enrollment:
Students in private schools in grades 1 to 8 (elementary and middle school): 62
Here:
4.4%
New York:
15.6%
Students in private schools in grades 9 to 12 (high school): 82
Here:
15.4%
New York:
15.0%
Students in private undergraduate colleges: 200
Here:
28.9%
New York:
39.2%
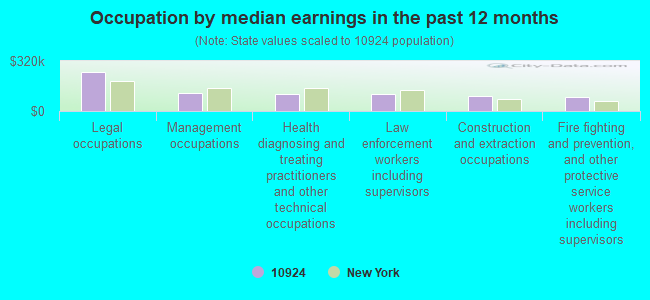
Occupation by median earnings in the past 12 months ($)
247,483Legal occupations
112,243Management occupations
110,408Health diagnosing and treating practitioners and other technical occupations
106,741Law enforcement workers including supervisors
95,631Construction and extraction occupations
90,409Fire fighting and prevention, and other protective service workers including supervisors
Companies with federal contracts located in this zip code:
CREATIVE GRAPHICS BY MARC TOLE (127 HILL RD in GOSHEN, NY; small business) : $164,371 in 10 contractsfrom 2000 to 2005
Contracts for Arts/Graphics Services by Army Signed by year:2000: $26,399; 2001: $27,447; 2002: $34,500; 2003: $36,225; 2004: -$28,024; 2005: $67,824; 2006: $0.
Biggest contracts:
$36,225 with Army for Arts/Graphics Services. Signed on 2003-10-28. Completion date: 2003-09-30.
$34,500, same as above.Signed on 2002-11-08. Completion date: 2003-09-30.
$29,834, same as above.Signed on 2005-12-15. Completion date: 2003-09-30.
$28,024, same as above.Signed on 2005-02-04. Completion date: 2003-09-30.
JONES SERVICES COMPANY, LLC (230 ROUTE 17A, # 202 in GOSHEN, NY; small business)
$6,095 with Navy for Construction of Structures and Facilities -- Family Housing Facilities. Signed on 2003-05-28. Completion date: 2003-05-28.
Top industries in this zip code by the number of employees in 2005:
Health Care and Social Assistance: General Medical and Surgical Hospitals (500-999 employees: 1 establishment)
Health Care and Social Assistance: Nursing Care Facilities (250-499: 1)
Health Care and Social Assistance: Offices of Physicians (except Mental Health Specialists) (20-49: 5, 10-19: 4, 5-9: 7, 1-4: 14)
Professional, Scientific, and Technical Services: Offices of Lawyers (20-49: 1, 10-19: 2, 5-9: 13, 1-4: 40)
Finance and Insurance: Insurance Agencies and Brokerages (100-249: 1, 10-19: 2, 5-9: 2, 1-4: 6)
Administrative and Support and Waste Management and Remediation Services: Solid Waste Collection (100-249: 1, 5-9: 1)
2002 - 2018 National Fire Incident Reporting System (NFIRS) incidents
Based on the data from the years 2002 - 2018 the average number of fires per year is 45. The highest number of fire incidents - 86 took place in 2006, and the least - 26 in 2011. The data has a declining trend.
When looking into fire subcategories, the most reports belonged to: Structure Fires (52.8%), and Outside Fires (25.2%).
Fire incident types reported to NFIRS in Zip Code 10924


+$4,837
-$2,666
(% of AGI for various income ranges: 0.1% for AGIs $10k-25k, 0.5% for AGIs $50k-75k, -0.0% for AGIs over 100k) Nearest zip codes: 10921, 10958, 10918, 10941, 10990, 10916.
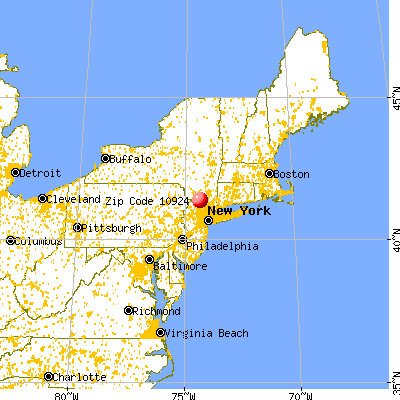


 Based on the data from the years 2002 - 2018 the average number of fires per year is 45. The highest number of fire incidents - 86 took place in 2006, and the least - 26 in 2011. The data has a declining trend.
 When looking into fire subcategories, the most reports belonged to: Structure Fires (52.8%), and Outside Fires (25.2%).