Estimated zip code population in 2022: 3,489 Zip code population in 2010: 3,430 Zip code population in 2000: 3,804
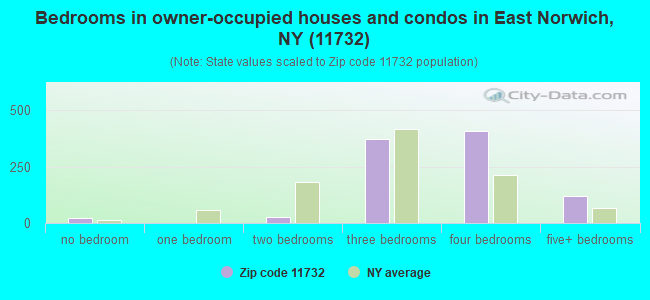
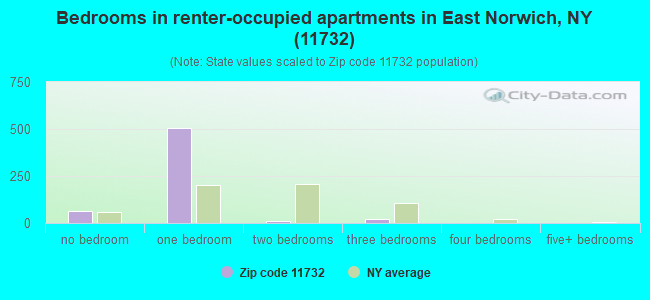
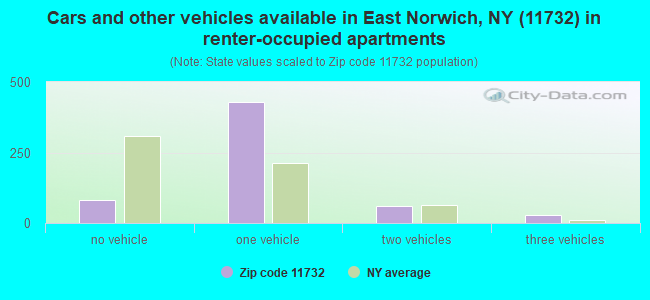
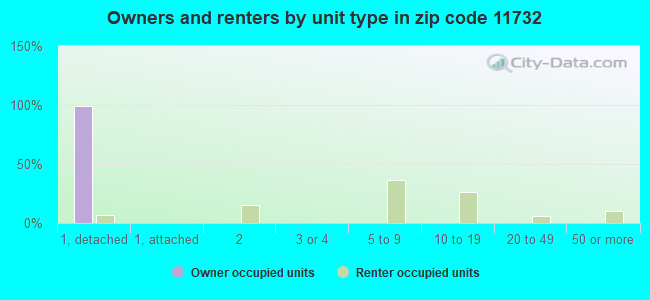
Houses and condos: 1,543 Renter-occupied apartments: 595
% of renters here:
38%
State:
46%
March 2022 cost of living index in zip code 11732: 154.7 (very high, U.S. average is 100)
Land area: 1.5 sq. mi. Water area: 0.0 sq. mi.
Population density: 2,281 people per square mile
(low).
OSM Map
General Map
Google Map
MSN Map
OSM Map
General Map
Google Map
MSN Map
OSM Map
General Map
Google Map
MSN Map
OSM Map
General Map
Google Map
MSN Map
Please wait while loading the map...
Real estate property taxes paid for housing units in 2022:
This zip code:
1.3% ($9,805)
New York:
1.5% ($6,180)
Median real estate property taxes paid for housing units with mortgages in 2022: $9,858 (1.3%) Median real estate property taxes paid for housing units with no mortgage in 2022: $9,755 (1.2%)
Business Search- 14 Million verified businesses
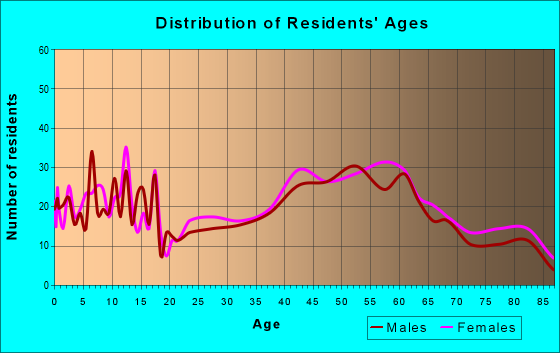
Males: 1,462
(41.9%)
Females: 2,026
(58.1%)
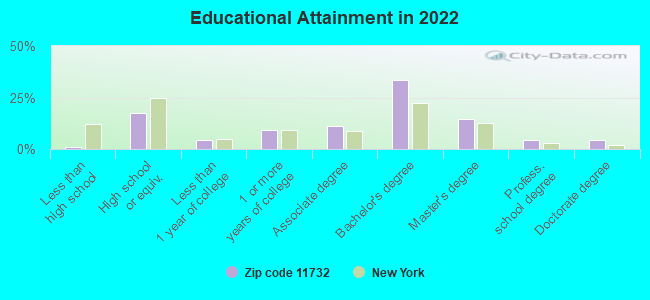
For population 25 years and over in 11732:
High school or higher: 100.0%
Bachelor's degree or higher: 57.5%
Graduate or professional degree: 23.6%
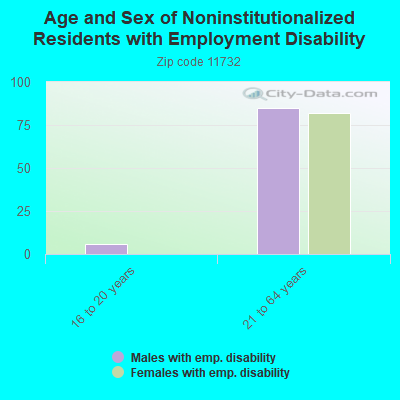
Unemployed: 3.4%
Mean travel time to work (commute): 35.2 minutes
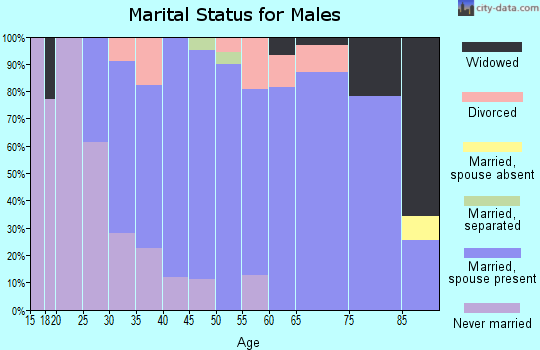
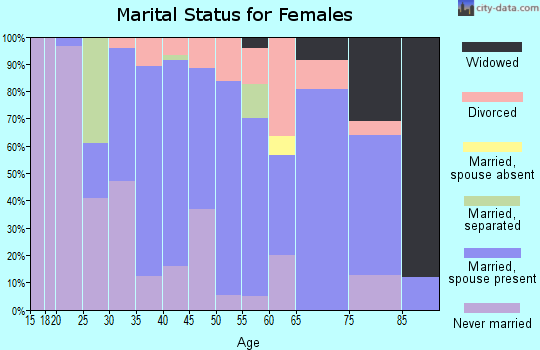
For population 15 years and over in 11732:
Never married: 24.3%
Now married: 55.8%
Separated: 0.7%
Widowed: 12.0%
Divorced: 7.3%
Zip code 11732 compared to state average:
Median house value above state average.
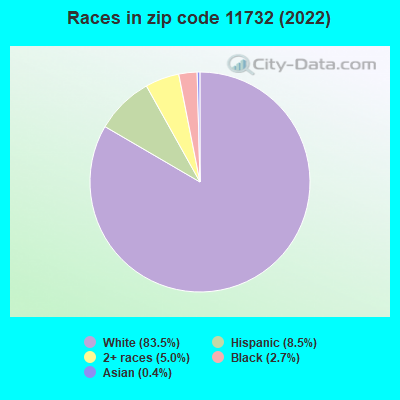
Black race population percentage significantly below state average.
Hispanic race population percentage below state average.
Median age significantly above state average.
Foreign-born population percentage significantly below state average.
Length of stay since moving in significantly above state average.
Number of rooms per house above state average.
Number of college students below state average.
Percentage of population with a bachelor's degree or higher above state average.
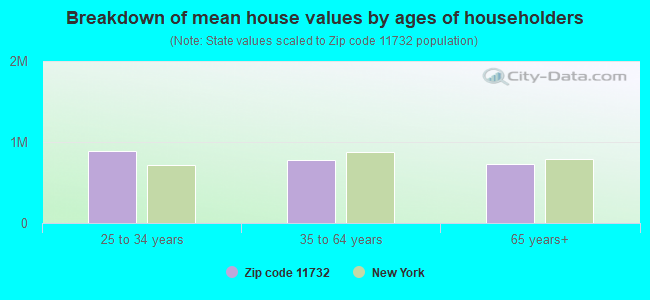
Estimated median house/condo value in 2022: $767,129
11732:
$767,129
New York:
$400,400
According to our research of New York and other state lists, there was 1 registered sex offender living in 11732 zip code as of April 27, 2024. The ratio of all residents to sex offenders in zip code 11732 is 3,911 to 1. The ratio of registered sex offenders to all residents in this zip code is much lower than the state average.
Median resident age:
This zip code:
51.4 years
New York median age:
40.0 years
Average household size:
This zip code:
2.2 people
New York:
2.5 people
Averages for the 2020 tax year for zip code 11732, filed in 2021:
Average Adjusted Gross Income (AGI) in 2020: $163,964 (Individual Income Tax Returns)
Here:
$163,964
State:
$90,930
Salary/wage: $110,409 (reported on 77.9% of returns)
Here:
$110,409
State:
$72,104
(% of AGI for various income ranges: 1489.0% for AGIs below $25k, 3960.0% for AGIs $25k-50k, 7049.3% for AGIs $50k-75k, 9925.5% for AGIs $75k-100k, 19969.0% for AGIs $100k-200k, 83423.6% for AGIs over 200k)
Taxable interest for individuals: $4,409 (reported on 59.5% of returns)
This zip code:
$4,409
New York:
$3,075
(% of AGI for various income ranges: 60.5% for AGIs below $25k, 93.3% for AGIs $25k-50k, 154.3% for AGIs $50k-75k, 315.5% for AGIs $75k-100k, 380.0% for AGIs $100k-200k, 3054.5% for AGIs over 200k)
Ordinary dividends: $12,429 (reported on 44.7% of returns)
Here:
$12,429
State:
$11,095
(% of AGI for various income ranges: 85.0% for AGIs below $25k, 254.7% for AGIs $25k-50k, 387.9% for AGIs $50k-75k, 333.6% for AGIs $75k-100k, 787.6% for AGIs $100k-200k, 6771.8% for AGIs over 200k)
Net capital gain/loss in AGI: +$40,744 (reported on 41.1% of returns)
Here:
+$40,744
State:
+$44,925
(% of AGI for various income ranges: 71.5% for AGIs below $25k, 130.0% for AGIs $25k-50k, 280.7% for AGIs $50k-75k, 299.1% for AGIs $75k-100k, 1147.6% for AGIs $100k-200k, 25736.4% for AGIs over 200k)
Profit/loss from business: +$25,755 (reported on 15.3% of returns)
Here:
+$25,755
State:
+$14,940
(% of AGI for various income ranges: 123.0% for AGIs below $25k, 179.3% for AGIs $25k-50k, 207.9% for AGIs $50k-75k, 648.2% for AGIs $75k-100k, 684.8% for AGIs $100k-200k, 4101.8% for AGIs over 200k)
Taxable individual retirement arrangement distribution: $17,992 (reported on 13.2% of returns)
11732:
$17,992
New York:
$19,609
(% of AGI for various income ranges: 260.7% for AGIs $25k-50k, 368.6% for AGIs $50k-75k, 537.3% for AGIs $75k-100k, 813.8% for AGIs $100k-200k, 1173.6% for AGIs over 200k)
Self-employed (Keogh) retirement plans: $47,400 (reported on 1.6% of returns)
11732:
$47,400
New York:
$32,497
(% of AGI for various income ranges: 1292.7% for AGIs over 200k)
Total itemized deductions: $34,174 (reported on 24.2% of returns)
Here:
$34,174
State:
$39,326
(% of AGI for various income ranges: 262.0% for AGIs below $25k, 465.3% for AGIs $25k-50k, 835.0% for AGIs $50k-75k, 1275.5% for AGIs $75k-100k, 1912.9% for AGIs $100k-200k, 7190.0% for AGIs over 200k)
Charity contributions: $7,959 (reported on 21.6% of returns)
Here:
$7,959
State:
$15,420
(% of AGI for various income ranges: 47.3% for AGIs $25k-50k, 105.7% for AGIs $50k-75k, 119.1% for AGIs $75k-100k, 201.4% for AGIs $100k-200k, 2263.6% for AGIs over 200k)
Taxes paid: $9,144 (reported on 23.7% of returns)
11732:
$9,144
State:
$9,183
(% of AGI for various income ranges: 71.0% for AGIs below $25k, 124.0% for AGIs $25k-50k, 277.1% for AGIs $50k-75k, 365.5% for AGIs $75k-100k, 602.9% for AGIs $100k-200k, 1573.6% for AGIs over 200k)
Earned income credit: $1,312 (reported on 4.2% of returns)
Here:
$1,312
State:
$2,138
(% of AGI for various income ranges: 52.5% for AGIs below $25k)
Percentage of individuals using paid preparers for their 2020 taxes: 95.3%
Here:
95%
State:
95%
(% for various income ranges: 92.5% for AGIs below $25k, 96.2% for AGIs $25k-50k, 95.8% for AGIs $50k-75k, 95.0% for AGIs $75k-100k, 95.5% for AGIs $100k-200k, 97.2% for AGIs over 200k)
Averages for the 2012 tax year for zip code 11732, filed in 2013:
Average Adjusted Gross Income (AGI) in 2012: $137,804 (Individual Income Tax Returns)
Here:
$137,804
State:
$77,088
Salary/wage: $100,443 (reported on 77.9% of returns)
Here:
$100,443
State:
$60,593
(% of AGI for various income ranges: 62.8% for AGIs below $25k, 68.0% for AGIs $25k-50k, 67.3% for AGIs $50k-75k, 66.1% for AGIs $75k-100k, 73.5% for AGIs $100k-200k, 46.2% for AGIs over 200k)
Taxable interest for individuals: $2,971 (reported on 66.3% of returns)
This zip code:
$2,971
New York:
$3,125
(% of AGI for various income ranges: 3.9% for AGIs below $25k, 1.9% for AGIs $25k-50k, 1.4% for AGIs $50k-75k, 1.1% for AGIs $75k-100k, 1.1% for AGIs $100k-200k, 1.5% for AGIs over 200k)
Ordinary dividends: $7,160 (reported on 45.9% of returns)
Here:
$7,160
State:
$10,299
(% of AGI for various income ranges: 5.6% for AGIs below $25k, 3.4% for AGIs $25k-50k, 2.2% for AGIs $50k-75k, 3.5% for AGIs $75k-100k, 2.3% for AGIs $100k-200k, 2.1% for AGIs over 200k)
Net capital gain/loss in AGI: +$11,446 (reported on 38.7% of returns)
Here:
+$11,446
State:
+$42,474
(% of AGI for various income ranges: 0.5% for AGIs $50k-75k, 1.5% for AGIs $75k-100k, 1.0% for AGIs $100k-200k, 5.1% for AGIs over 200k)
Profit/loss from business: +$29,168 (reported on 17.1% of returns)
Here:
+$29,168
State:
+$16,168
(% of AGI for various income ranges: 11.5% for AGIs below $25k, 6.9% for AGIs $25k-50k, 4.7% for AGIs $50k-75k, 4.5% for AGIs $75k-100k, 2.3% for AGIs $100k-200k, 3.5% for AGIs over 200k)
Taxable individual retirement arrangement distribution: $15,676 (reported on 16.0% of returns)
11732:
$15,676
New York:
$17,621
(% of AGI for various income ranges: 5.6% for AGIs below $25k, 4.4% for AGIs $25k-50k, 3.3% for AGIs $50k-75k, 4.0% for AGIs $75k-100k, 3.0% for AGIs $100k-200k, 0.6% for AGIs over 200k)
Self-employment retirement plans: $21,125 (reported on 2.2% of returns)
11732:
$21,125
New York:
$27,330
(% of AGI for various income ranges: 1.3% for AGIs $100k-200k)
Total itemized deductions: $43,400 (21% of AGI, reported on 58.0% of returns)
Here:
$43,400
State:
$34,985
Here:
20.7% of AGI
State:
21.3% of AGI
(% of AGI for various income ranges: 27.2% for AGIs below $25k, 17.1% for AGIs $25k-50k, 19.6% for AGIs $50k-75k, 20.3% for AGIs $75k-100k, 20.6% for AGIs $100k-200k, 16.7% for AGIs over 200k)
Charity contributions: $4,102 (reported on 53.6% of returns)
Here:
$4,102
State:
$5,572
(% of AGI for various income ranges: 1.2% for AGIs below $25k, 1.3% for AGIs $25k-50k, 1.8% for AGIs $50k-75k, 1.7% for AGIs $75k-100k, 1.7% for AGIs $100k-200k, 1.5% for AGIs over 200k)
Taxes paid: $24,910 (reported on 58.0% of returns)
11732:
$24,910
State:
$18,656
(% of AGI for various income ranges: 10.0% for AGIs below $25k, 7.9% for AGIs $25k-50k, 8.4% for AGIs $50k-75k, 9.0% for AGIs $75k-100k, 10.7% for AGIs $100k-200k, 11.0% for AGIs over 200k)
Earned income credit: $1,325 (reported on 4.4% of returns)
Here:
$1,325
State:
$2,230
(% of AGI for various income ranges: 2.5% for AGIs below $25k)
Percentage of individuals using paid preparers for their 2012 taxes: 76.8%
Here:
77%
State:
66%
(% for various income ranges: 68.9% for AGIs below $25k, 72.4% for AGIs $25k-50k, 78.3% for AGIs $50k-75k, 82.4% for AGIs $75k-100k, 79.5% for AGIs $100k-200k, 87.0% for AGIs over 200k)
Averages for the 2004 tax year for zip code 11732, filed in 2005:
Average Adjusted Gross Income (AGI) in 2004: $110,645 (Individual Income Tax Returns)
Here:
$110,645
State:
$59,519
Salary/wage: $90,884 (reported on 78.7% of returns)
Here:
$90,884
State:
$50,673
(% of AGI for various income ranges: 78.2% for AGIs below $10k, 60.9% for AGIs $10k-25k, 70.5% for AGIs $25k-50k, 67.7% for AGIs $50k-75k, 70.8% for AGIs $75k-100k, 63.1% for AGIs over 100k)
Taxable interest for individuals: $3,025 (reported on 74.5% of returns)
This zip code:
$3,025
New York:
$2,377
(% of AGI for various income ranges: 10.2% for AGIs below $10k, 6.1% for AGIs $10k-25k, 4.3% for AGIs $25k-50k, 2.1% for AGIs $50k-75k, 3.0% for AGIs $75k-100k, 1.6% for AGIs over 100k)
Taxable dividends: $4,698 (reported on 51.2% of returns)
Here:
$4,698
State:
$5,394
(% of AGI for various income ranges: 12.0% for AGIs below $10k, 5.1% for AGIs $10k-25k, 2.9% for AGIs $25k-50k, 2.7% for AGIs $50k-75k, 2.2% for AGIs $75k-100k, 1.9% for AGIs over 100k)
Net capital gain/loss: +$15,391 (reported on 43.6% of returns)
Here:
+$15,391
State:
+$23,581
(% of AGI for various income ranges: -6.8% for AGIs below $10k, -0.6% for AGIs $10k-25k, -0.8% for AGIs $25k-50k, 1.1% for AGIs $50k-75k, -0.0% for AGIs $75k-100k, 8.0% for AGIs over 100k)
Profit/loss from business: +$23,162 (reported on 16.9% of returns)
Here:
+$23,162
State:
+$13,809
(% of AGI for various income ranges: 7.2% for AGIs below $10k, 5.7% for AGIs $10k-25k, 5.9% for AGIs $25k-50k, 4.8% for AGIs $50k-75k, 5.1% for AGIs $75k-100k, 3.0% for AGIs over 100k)
IRA payment deduction: $4,059 (reported on 4.6% of returns)
11732:
$4,059
New York:
$3,115
(% of AGI for various income ranges: 0.6% for AGIs $25k-50k, 0.3% for AGIs $50k-75k, 0.3% for AGIs $75k-100k, 0.1% for AGIs over 100k)
Self-employed pension: $15,391 (reported on 2.5% of returns)
Here:
$15,391
New York:
$19,016
Total itemized deductions: $32,768 (20% of AGI, reported on 59.0% of returns)
Here:
$32,768
State:
$25,864
Here:
20.1% of AGI
State:
21.9% of AGI
(% of AGI for various income ranges: 31.9% for AGIs below $10k, 25.8% for AGIs $10k-25k, 19.8% for AGIs $25k-50k, 21.2% for AGIs $50k-75k, 22.3% for AGIs $75k-100k, 16.1% for AGIs over 100k)
Charity contributions deductions: $4,133 (2% of AGI, reported on 55.6% of returns)
Here:
$4,133
State:
$4,439
Here:
2.5% of AGI
State:
3.6% of AGI
(% of AGI for various income ranges: 1.0% for AGIs below $10k, 2.3% for AGIs $10k-25k, 2.0% for AGIs $25k-50k, 2.2% for AGIs $50k-75k, 2.3% for AGIs $75k-100k, 2.1% for AGIs over 100k)
Total tax: $24,045 (reported on 85.8% of returns)
11732:
$24,045
State:
$11,730
(% of AGI for various income ranges: 3.3% for AGIs below $10k, 4.7% for AGIs $10k-25k, 8.1% for AGIs $25k-50k, 10.2% for AGIs $50k-75k, 11.3% for AGIs $75k-100k, 21.6% for AGIs over 100k)
Earned income credit: $867 (reported on 3.2% of returns)
Here:
$867
State:
$1,757
Percentage of individuals using paid preparers for their 2004 taxes: 74.2%
Here:
74%
State:
67%
(% for various income ranges: 68.3% for AGIs below $10k, 66.7% for AGIs $10k-25k, 70.4% for AGIs $25k-50k, 75.9% for AGIs $50k-75k, 78.6% for AGIs $75k-100k, 80.5% for AGIs over 100k)
Household received Food Stamps/SNAP in the past 12 months: 124 Household did not receive Food Stamps/SNAP in the past 12 months: 1,413
Women who had a birth in the past 12 months: 12 (12 now married, 0 unmarried) Women who did not have a birth in the past 12 months: 599 (330 now married, 264 unmarried)
Housing units in zip code 11732 with a mortgage: 503 (55 second mortgage, 37 both second mortgage and home equity loan) Houses without a mortgage: 17
Median monthly owner costs for units with a mortgage: $3,814 Median monthly owner costs for units without a mortgage: $1,487
Residents with income below the poverty level in 2022:
This zip code:
8.7%
Whole state:
14.3%
Residents with income below 50% of the poverty level in 2022:
This zip code:
1.6%
Whole state:
6.8%
Median number of rooms in houses and condos:
Here:
7.2
State:
6.3
Median number of rooms in apartments:
Here:
3.4
State:
3.8
Notable locations in this zip code not listed on our city pages
In group quarters: 16 (-1 institutionalized population)
Size of family households: 358 2-persons, 194 3-persons, 169 4-persons, 104 5-persons, 5 7-or-more-persons
Size of nonfamily households: 623 1-person, 90 2-persons, 12 3-persons
612 married couples with children.
0 single-parent households ().
88.1% of residents of 11732 zip code speak English at home.
4.1% of residents speak Spanish at home (60% very well, 22% well, 18% not well).
7.2% of residents speak other Indo-European language at home (70% very well, 30% well).
0.6% of residents speak Asian or Pacific Island language at home (73% very well, 27% not well).
0.2% of residents speak other language at home (100% very well).
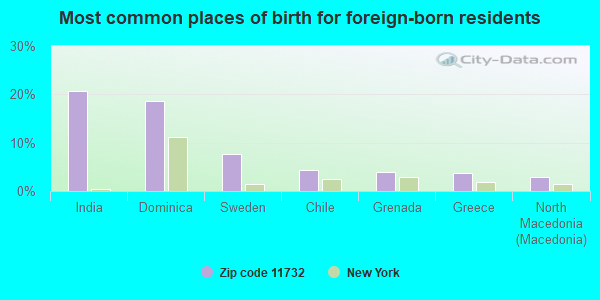
Foreign born population: 304 (8.7%) (80.8% of them are naturalized citizens)
This zip code:
8.7%
Whole state:
22.7%
21%India
19%Dominica
8%Sweden
4%Chile
4%Grenada
4%Greece
3%North Macedonia (Macedonia)
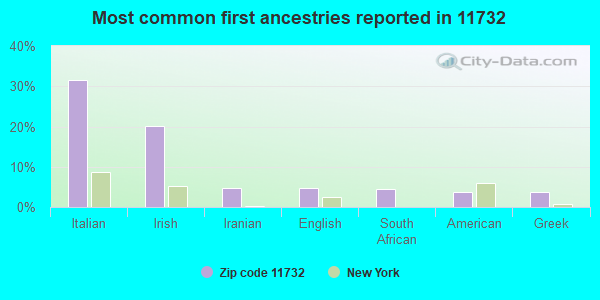
31%Italian
20%Irish
5%Iranian
5%English
4%South African
4%American
4%Greek
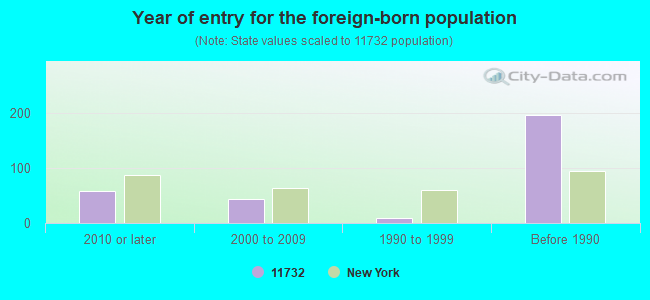
Year of entry for the foreign-born population
582010 or later
432000 to 2009
91990 to 1999
196Before 1990
Facilities with environmental interests located in this zip code:
A G WETZEL CONSTRUCTION CORP (6000 N HEMPSTEAD TNPK in EAST NORWICH, NY)
Large Quantity Generators, more that 1000 kg of hazardous waste/month (Resource Conservation and Recovery Act (tracking hazardous waste)) - notification Organizations: ANTON WETZEL C-O HOFFMAN CENTER (CONTACT/OWNER)
Alternative names: FOX MEADOW AKA FOX RUN/FDIC AS
CUMBERLAND FARMS #70236 (62-61 NORTHERN BLVD in EAST NORWICH, NY)
Small Quantity Generators, between 100 kg and 1000 kg of hazardous waste/month (Resource Conservation and Recovery Act (tracking hazardous waste)) Organizations: CUMBERLAND FARMS INC (CONTACT/OPERATOR)
, TOSCO (CONTACT/OWNER)
Alternative names: EXXON CO USA 31778, TOSCO #34642
BERMINGHAM ESTATES LLC (20 SCHOOL HOUSE RD in EAST NORWICH, NY)
Large Quantity Generators, more that 1000 kg of hazardous waste/month (Resource Conservation and Recovery Act (tracking hazardous waste)) - notification
ANASTASIO AUTOMOTIVE CTR (6261 NORTHERN BLVD in EAST NORWICH, NY)
(Resource Conservation and Recovery Act (tracking hazardous waste))
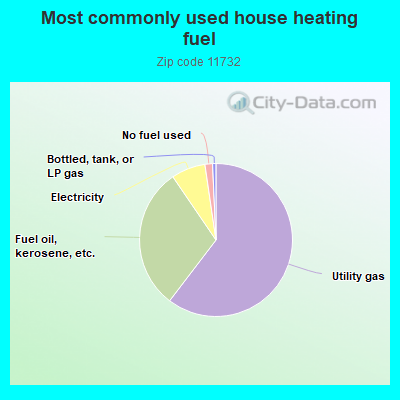
60.2%Utility gas
30.0%Fuel oil, kerosene, etc.
7.2%Electricity
1.6%No fuel used
0.7%Bottled, tank, or LP gas
Population in 1990: 3,276. Population change in the 1990s: +528 (+16.1%).
Place of birth for U.S.-born residents:
This state: 2,893
Northeast: 184
Midwest: 8
South: 60
West: 19
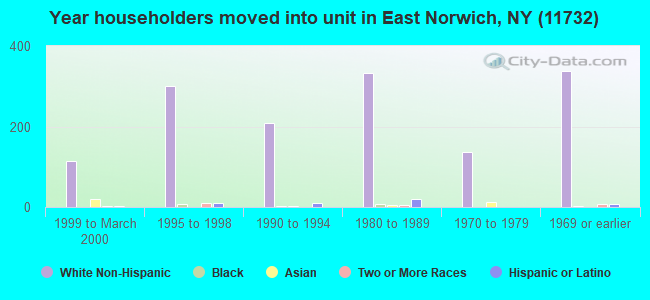
78% of the 11732 zip code residents lived in the same house 5 years ago. Out of people who lived in different houses, 59% lived in this county. Out of people who lived in different counties, 50% lived in New York.
97% of the 11732 zip code residents lived in the same house 1 year ago. Out of people who lived in different houses, 33% moved from this county. Out of people who lived in different houses, 57% moved from different county within same state. Out of people who lived in different houses, 6% moved from different state.
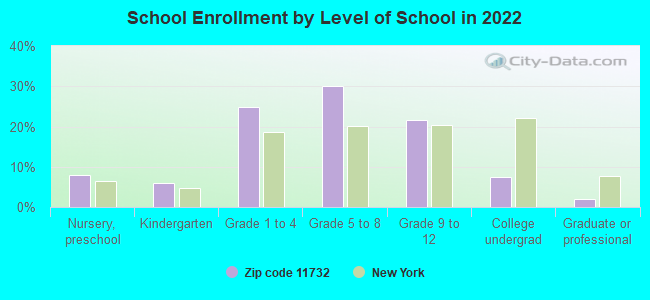
Private vs. public school enrollment:
Students in private schools in grades 1 to 8 (elementary and middle school): 12
Here:
3.3%
New York:
15.6%
Students in private schools in grades 9 to 12 (high school): 7
Here:
5.0%
New York:
15.0%
Students in private undergraduate colleges: 27
Here:
52.8%
New York:
39.2%
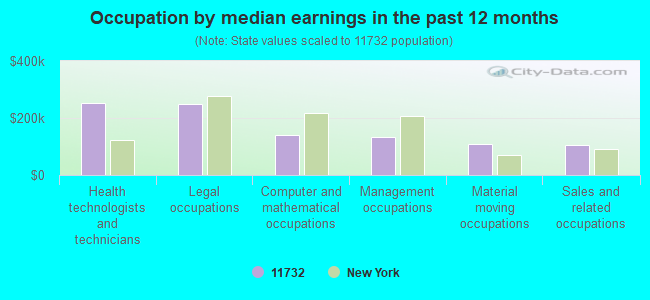
Occupation by median earnings in the past 12 months ($)
252,767Health technologists and technicians
247,483Legal occupations
139,644Computer and mathematical occupations
134,157Management occupations
108,288Material moving occupations
104,170Sales and related occupations
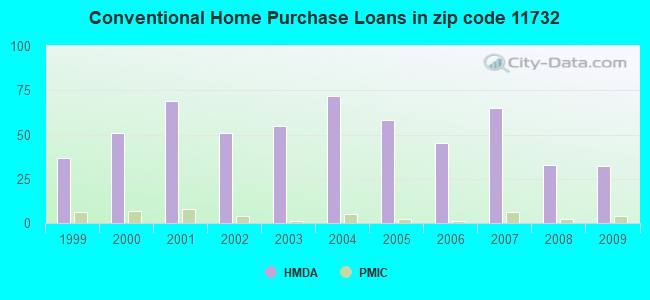
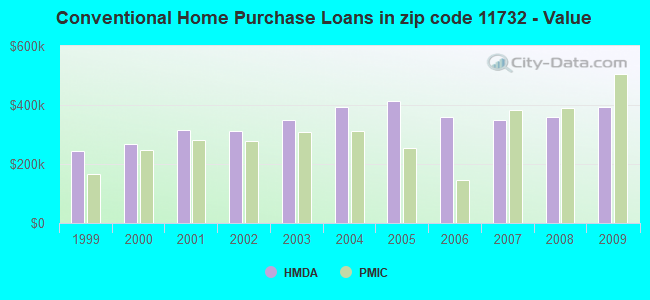
Top industries in this zip code by the number of employees in 2005:
Detailed PMIC statistics for the following Tracts:5180.00
, 5181.00
2002 - 2018 National Fire Incident Reporting System (NFIRS) incidents
According to the data from the years 2002 - 2018 the average number of fire incidents per year is 11. The highest number of reported fire incidents - 30 took place in 2015, and the least - 0 in 2004. The data has a declining trend.
When looking into fire subcategories, the most reports belonged to: Structure Fires (52.4%), and Outside Fires (29.3%).
Fire incident types reported to NFIRS in Zip Code 11732
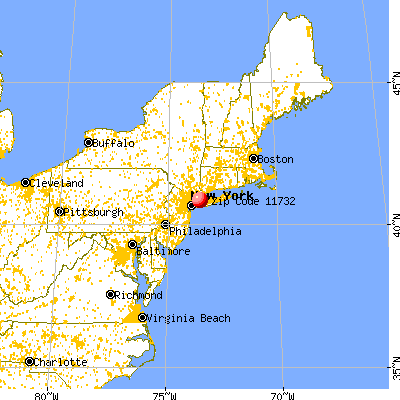


 Nearest zip codes: 11771, 11791, 11765, 11753, 11545, 11560.


 According to the data from the years 2002 - 2018 the average number of fire incidents per year is 11. The highest number of reported fire incidents - 30 took place in 2015, and the least - 0 in 2004. The data has a declining trend.
 When looking into fire subcategories, the most reports belonged to: Structure Fires (52.4%), and Outside Fires (29.3%).