Estimated zip code population in 2022: 696 Zip code population in 2010: 737 Zip code population in 2000: 732
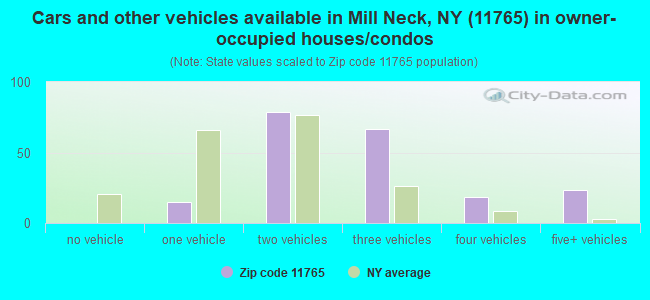
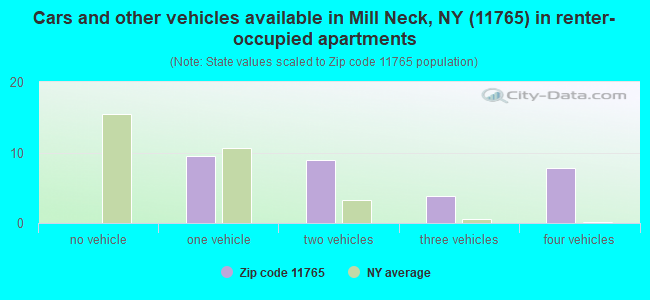
Houses and condos: 262 Renter-occupied apartments: 29
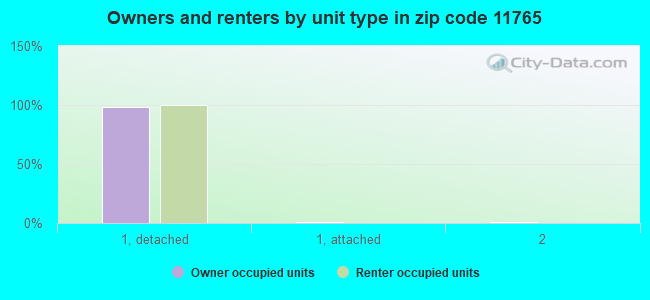
% of renters here:
12%
State:
46%
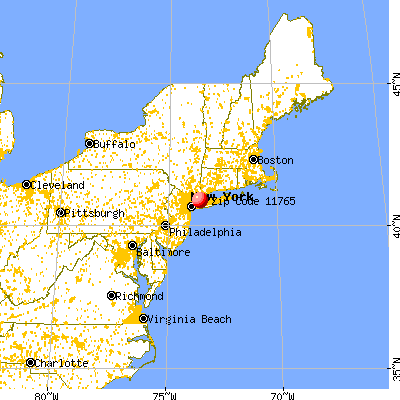
March 2022 cost of living index in zip code 11765: 129.6 (high, U.S. average is 100)
Land area: 2.4 sq. mi. Water area: 0.3 sq. mi.
Population density: 284 people per square mile
(very low).
OSM Map
General Map
Google Map
MSN Map
OSM Map
General Map
Google Map
MSN Map
OSM Map
General Map
Google Map
MSN Map
OSM Map
General Map
Google Map
MSN Map
Please wait while loading the map...
Real estate property taxes paid for housing units in 2022:
This zip code:
0.5% ($9,805)
New York:
1.5% ($6,180)
Median real estate property taxes paid for housing units with mortgages in 2022: $9,858 (0.5%) Median real estate property taxes paid for housing units with no mortgage in 2022: $9,755 (0.5%)
Business Search- 14 Million verified businesses
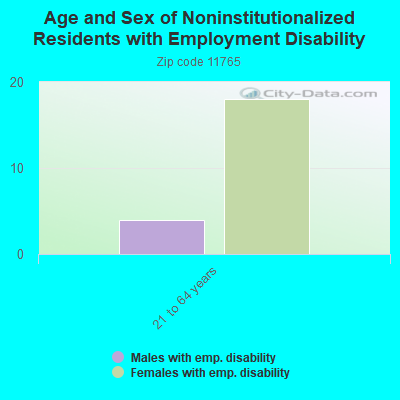
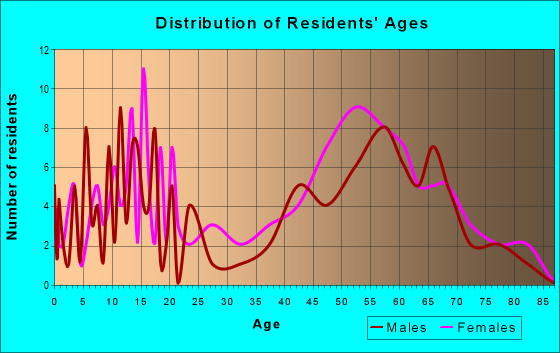
Males: 370
(53.1%)
Females: 326
(46.9%)
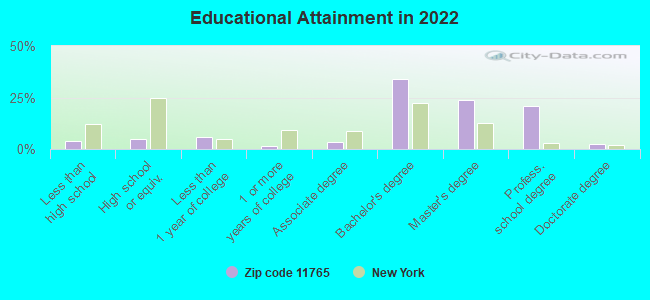
For population 25 years and over in 11765:
High school or higher: 97.5%
Bachelor's degree or higher: 81.3%
Graduate or professional degree: 47.6%
Unemployed: 5.4%
Mean travel time to work (commute): 31.8 minutes
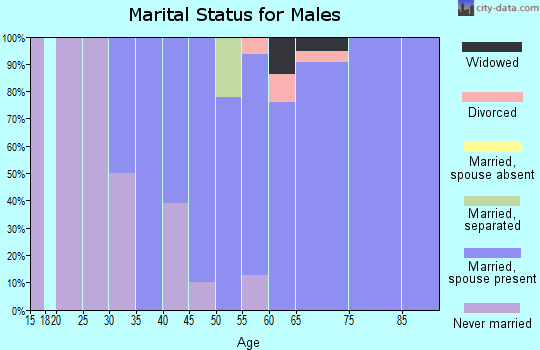
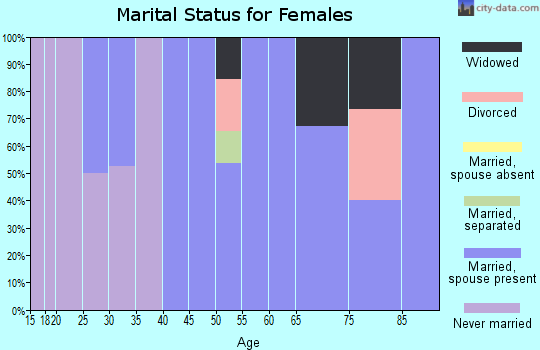
For population 15 years and over in 11765:
Never married: 20.2%
Now married: 73.1%
Separated: 0.9%
Widowed: 1.4%
Divorced: 4.4%
Zip code 11765 compared to state average:
Median household income significantly above state average.
Median house value significantly above state average.
Black race population percentage significantly below state average.
Median age significantly above state average.
Foreign-born population percentage below state average.
Renting percentage significantly below state average.
Number of rooms per house significantly above state average.
Percentage of population with a bachelor's degree or higher above state average.
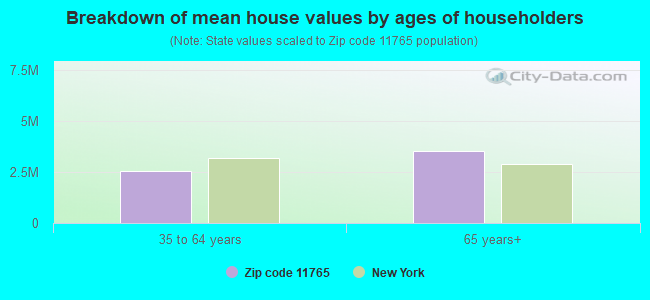
Estimated median house/condo value in 2022: $2,084,875
11765:
$2,084,875
New York:
$400,400
Median resident age:
This zip code:
48.9 years
New York median age:
40.0 years
Average household size:
This zip code:
2.9 people
New York:
2.5 people
Averages for the 2020 tax year for zip code 11765, filed in 2021:
Average Adjusted Gross Income (AGI) in 2020: $614,018 (Individual Income Tax Returns)
Here:
$614,018
State:
$90,930
Salary/wage: $252,317 (reported on 70.6% of returns)
Here:
$252,317
State:
$72,104
(% of AGI for various income ranges: 2440.0% for AGIs $25k-50k, 4400.0% for AGIs $50k-75k, 22380.0% for AGIs $100k-200k, 172763.3% for AGIs over 200k)
Taxable interest for individuals: $28,762 (reported on 70.6% of returns)
This zip code:
$28,762
New York:
$3,075
(% of AGI for various income ranges: 186.7% for AGIs $50k-75k, 350.0% for AGIs $100k-200k, 22490.0% for AGIs over 200k)
Ordinary dividends: $87,245 (reported on 58.8% of returns)
Here:
$87,245
State:
$11,095
(% of AGI for various income ranges: 960.0% for AGIs $50k-75k, 3330.0% for AGIs $100k-200k, 54420.0% for AGIs over 200k)
Net capital gain/loss in AGI: +$232,895 (reported on 55.9% of returns)
Here:
+$232,895
State:
+$44,925
(% of AGI for various income ranges: 130.0% for AGIs $50k-75k, 4425.0% for AGIs $100k-200k, 144370.0% for AGIs over 200k)
Profit/loss from business: +$69,250 (reported on 23.5% of returns)
Here:
+$69,250
State:
+$14,940
(% of AGI for various income ranges: 2830.0% for AGIs $25k-50k, 14693.3% for AGIs over 200k)
Taxable individual retirement arrangement distribution: $33,725 (reported on 11.8% of returns)
11765:
$33,725
New York:
$19,609
(% of AGI for various income ranges: 4496.7% for AGIs over 200k)
Total itemized deductions: $83,833 (reported on 35.3% of returns)
Here:
$83,833
State:
$39,326
(% of AGI for various income ranges: 4190.0% for AGIs $100k-200k, 28606.7% for AGIs over 200k)
Charity contributions: $37,117 (reported on 35.3% of returns)
Here:
$37,117
State:
$15,420
(% of AGI for various income ranges: 965.0% for AGIs $100k-200k, 14203.3% for AGIs over 200k)
Taxes paid: $12,450 (reported on 35.3% of returns)
11765:
$12,450
State:
$9,183
(% of AGI for various income ranges: 487.5% for AGIs $25k-50k, 1120.0% for AGIs $100k-200k, 3583.3% for AGIs over 200k)
Percentage of individuals using paid preparers for their 2020 taxes: 100.0%
Here:
100%
State:
95%
(% for various income ranges: 100.0% for AGIs below $25k, 100.0% for AGIs $25k-50k, 100.0% for AGIs $50k-75k, 100.0% for AGIs $75k-100k, 100.0% for AGIs $100k-200k, 100.0% for AGIs over 200k)
Averages for the 2012 tax year for zip code 11765, filed in 2013:
Average Adjusted Gross Income (AGI) in 2012: $937,794 (Individual Income Tax Returns)
Here:
$937,794
State:
$77,088
Salary/wage: $198,410 (reported on 65.6% of returns)
Here:
$198,410
State:
$60,593
(% of AGI for various income ranges: 40.8% for AGIs below $25k, 66.6% for AGIs $25k-50k, 126.4% for AGIs $50k-75k, 50.1% for AGIs $100k-200k, 11.9% for AGIs over 200k)
Taxable interest for individuals: $31,778 (reported on 71.9% of returns)
This zip code:
$31,778
New York:
$3,125
(% of AGI for various income ranges: 3.3% for AGIs below $25k, 0.6% for AGIs $25k-50k, 3.4% for AGIs $50k-75k, 0.5% for AGIs $100k-200k, 2.5% for AGIs over 200k)
Ordinary dividends: $47,817 (reported on 56.2% of returns)
Here:
$47,817
State:
$10,299
(% of AGI for various income ranges: 22.3% for AGIs below $25k, 17.8% for AGIs $50k-75k, 5.9% for AGIs $100k-200k, 2.7% for AGIs over 200k)
Net capital gain/loss in AGI: +$257,331 (reported on 50.0% of returns)
Here:
+$257,331
State:
+$42,474
(% of AGI for various income ranges: 6.8% for AGIs $100k-200k, 14.2% for AGIs over 200k)
Profit/loss from business: +$131,833 (reported on 18.8% of returns)
Here:
+$131,833
State:
+$16,168
Taxable individual retirement arrangement distribution: $55,480 (reported on 15.6% of returns)
11765:
$55,480
New York:
$17,621
Total itemized deductions: $173,214 (12% of AGI, reported on 65.6% of returns)
Here:
$173,214
State:
$34,985
Here:
12.3% of AGI
State:
21.3% of AGI
(% of AGI for various income ranges: 43.8% for AGIs $25k-50k, 26.7% for AGIs $75k-100k, 31.4% for AGIs $100k-200k, 11.4% for AGIs over 200k)
Charity contributions: $29,705 (reported on 59.4% of returns)
Here:
$29,705
State:
$5,572
(% of AGI for various income ranges: 3.8% for AGIs $50k-75k, 3.3% for AGIs $100k-200k, 1.9% for AGIs over 200k)
Taxes paid: $105,657 (reported on 65.6% of returns)
11765:
$105,657
State:
$18,656
(% of AGI for various income ranges: 18.3% for AGIs $25k-50k, 13.7% for AGIs $75k-100k, 13.3% for AGIs $100k-200k, 7.2% for AGIs over 200k)
Percentage of individuals using paid preparers for their 2012 taxes: 96.9%
Here:
97%
State:
66%
(% for various income ranges: 85.7% for AGIs below $25k, 100.0% for AGIs $25k-50k, 100.0% for AGIs $50k-75k, 100.0% for AGIs $75k-100k, 100.0% for AGIs $100k-200k, 100.0% for AGIs over 200k)
Averages for the 2004 tax year for zip code 11765, filed in 2005:
Average Adjusted Gross Income (AGI) in 2004: $613,182 (Individual Income Tax Returns)
Here:
$613,182
State:
$59,519
Salary/wage: $242,120 (reported on 66.7% of returns)
Here:
$242,120
State:
$50,673
(% of AGI for various income ranges: 55.0% for AGIs $10k-25k, 57.6% for AGIs $25k-50k, 60.3% for AGIs $50k-75k, 64.1% for AGIs $75k-100k, 24.7% for AGIs over 100k)
Taxable interest for individuals: $24,365 (reported on 78.5% of returns)
This zip code:
$24,365
New York:
$2,377
(% of AGI for various income ranges: 1.7% for AGIs $10k-25k, 3.3% for AGIs $25k-50k, 1.4% for AGIs $50k-75k, 1.0% for AGIs $75k-100k, 3.1% for AGIs over 100k)
Taxable dividends: $56,069 (reported on 68.3% of returns)
Here:
$56,069
State:
$5,394
(% of AGI for various income ranges: 7.1% for AGIs $10k-25k, 7.6% for AGIs $25k-50k, 6.5% for AGIs $50k-75k, 4.3% for AGIs $75k-100k, 6.2% for AGIs over 100k)
Net capital gain/loss: +$177,913 (reported on 63.4% of returns)
Here:
+$177,913
State:
+$23,581
(% of AGI for various income ranges: 0.1% for AGIs $25k-50k, -0.7% for AGIs $50k-75k, -1.0% for AGIs $75k-100k, 18.8% for AGIs over 100k)
Profit/loss from business: +$51,726 (reported on 17.1% of returns)
Here:
+$51,726
State:
+$13,809
Self-employed pension: $54,765 (reported on 4.7% of returns)
Here:
$54,765
New York:
$19,016
Total itemized deductions: $142,243 (15% of AGI, reported on 62.3% of returns)
Here:
$142,243
State:
$25,864
Here:
14.5% of AGI
State:
21.9% of AGI
(% of AGI for various income ranges: 27.9% for AGIs $25k-50k, 19.4% for AGIs $50k-75k, 35.6% for AGIs $75k-100k, 14.0% for AGIs over 100k)
Charity contributions deductions: $33,881 (3% of AGI, reported on 57.9% of returns)
Here:
$33,881
State:
$4,439
Here:
3.2% of AGI
State:
3.6% of AGI
(% of AGI for various income ranges: 1.6% for AGIs $25k-50k, 1.5% for AGIs $50k-75k, 2.2% for AGIs $75k-100k, 3.2% for AGIs over 100k)
Total tax: $177,463 (reported on 81.5% of returns)
11765:
$177,463
State:
$11,730
(% of AGI for various income ranges: 5.6% for AGIs $10k-25k, 9.9% for AGIs $25k-50k, 11.8% for AGIs $50k-75k, 10.4% for AGIs $75k-100k, 23.8% for AGIs over 100k)
Percentage of individuals using paid preparers for their 2004 taxes: 88.4%
Here:
88%
State:
67%
(% for various income ranges: 89.6% for AGIs below $10k, 82.1% for AGIs $10k-25k, 78.6% for AGIs $25k-50k, 86.5% for AGIs $50k-75k, 90.9% for AGIs $75k-100k, 92.8% for AGIs over 100k)
Household received Food Stamps/SNAP in the past 12 months: 0 Household did not receive Food Stamps/SNAP in the past 12 months: 235
Women who had a birth in the past 12 months: 3 (3 now married, 0 unmarried) Women who did not have a birth in the past 12 months: 118 (53 now married, 64 unmarried)
Housing units in zip code 11765 with a mortgage: 135 (7 second mortgage, 5 both second mortgage and home equity loan) Median monthly owner costs for units with a mortgage: $3,860 Median monthly owner costs for units without a mortgage: $1,487
Residents with income below the poverty level in 2022:
This zip code:
3.3%
Whole state:
14.3%
Residents with income below 50% of the poverty level in 2022:
This zip code:
1.5%
Whole state:
6.8%
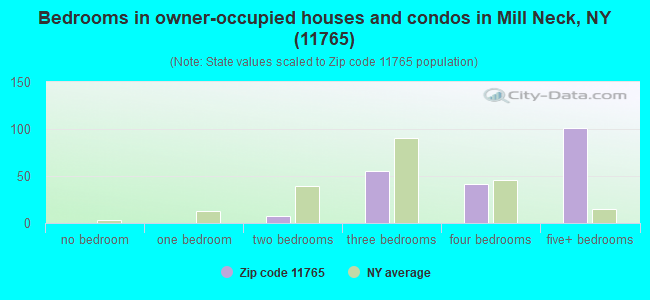
Median number of rooms in houses and condos:
Here:
9.8
State:
6.3
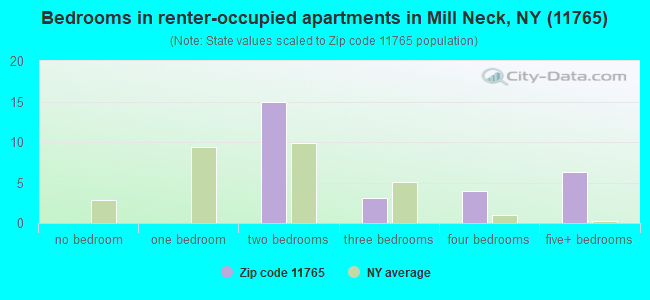
Median number of rooms in apartments:
Here:
6.3
State:
3.8
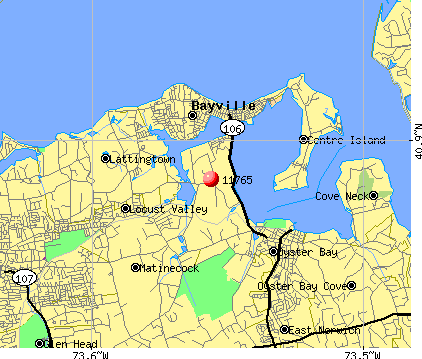
Notable locations in this zip code not listed on our city pages
Lakes, reservoirs, and swamps: Spring Lake (A), Upper Francis Pond (B), Lower Francis Pond (C), Beaver Lake (D), Shu Swamp (E). Display/hide their locations on the map
Size of family households: 89 2-persons, 42 3-persons, 22 4-persons, 28 5-persons, 22 6-persons, 2 7-or-more-persons
Size of nonfamily households: 24 1-person, 5 2-persons
175 married couples with children.
1 single-parent households (1 women).
84.7% of residents of 11765 zip code speak English at home.
5.5% of residents speak Spanish at home (64% very well, 36% well).
2.3% of residents speak other Indo-European language at home (100% very well).
7.1% of residents speak Asian or Pacific Island language at home (64% very well, 28% well, 9% not well).
0.8% of residents speak other language at home (100% very well).
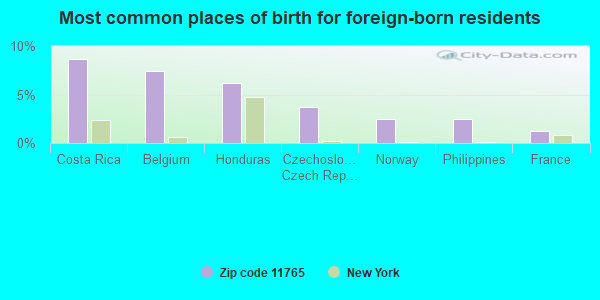
Foreign born population: 80 (11.6%) (56.2% of them are naturalized citizens)
This zip code:
11.6%
Whole state:
22.7%
9%Costa Rica
7%Belgium
6%Honduras
4%Czechoslovakia (includes Czech Republic and Slovakia)
2%Norway
2%Philippines
1%France
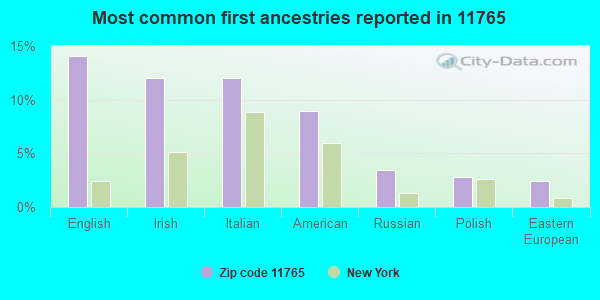
14%English
12%Irish
12%Italian
9%American
3%Russian
3%Polish
2%Eastern European
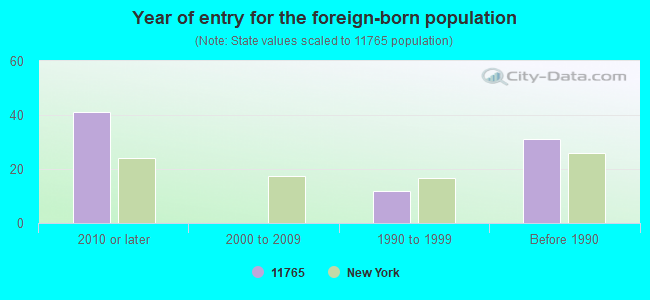
Year of entry for the foreign-born population
412010 or later
02000 to 2009
121990 to 1999
31Before 1990
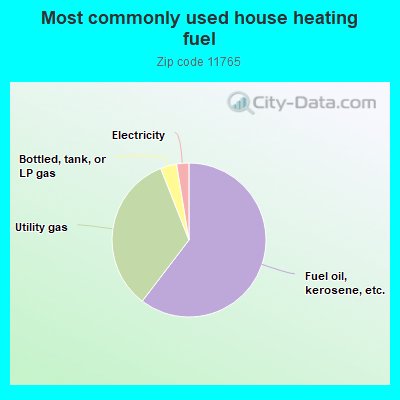
60.7%Fuel oil, kerosene, etc.
33.8%Utility gas
3.4%Bottled, tank, or LP gas
2.6%Electricity
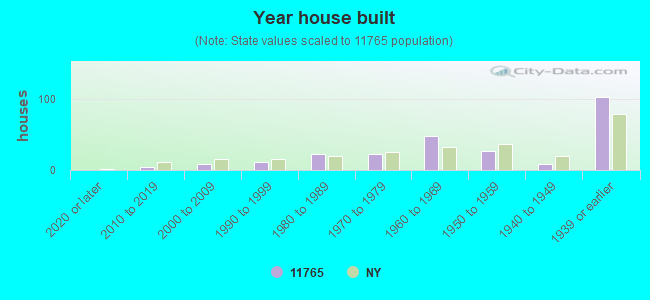
Population in 1990: 877.
Place of birth for U.S.-born residents:
This state: 503
Northeast: 54
Midwest: 18
South: 30
West: 7
56% of the 11765 zip code residents lived in the same house 5 years ago. Out of people who lived in different houses, 72% lived in this county. Out of people who lived in different counties, 50% lived in New York.
96% of the 11765 zip code residents lived in the same house 1 year ago. Out of people who lived in different houses, 53% moved from this county. Out of people who lived in different houses, 32% moved from different county within same state. Out of people who lived in different houses, 11% moved from abroad.
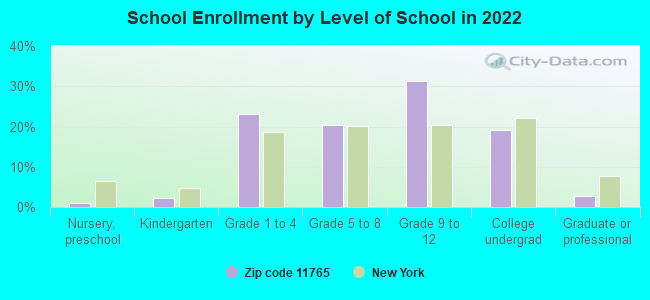
Private vs. public school enrollment:
Students in private schools in grades 1 to 8 (elementary and middle school): 8
Here:
11.3%
New York:
15.6%
Students in private schools in grades 9 to 12 (high school): 11
Here:
20.7%
New York:
15.0%
Students in private undergraduate colleges: 25
Here:
70.1%
New York:
39.2%
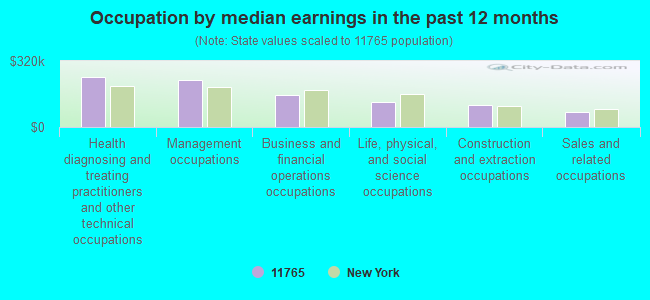
Occupation by median earnings in the past 12 months ($)
241,457Health diagnosing and treating practitioners and other technical occupations
227,607Management occupations
152,973Business and financial operations occupations
121,113Life, physical, and social science occupations
107,835Construction and extraction occupations
71,417Sales and related occupations
Top industries in this zip code by the number of employees in 2005:
Educational Services: Elementary and Secondary Schools (100-249 employees: 1 establishment)
Health Care and Social Assistance: Vocational Rehabilitation Services (100-249: 1)
Other Services (except Public Administration): Voluntary Health Organizations (10-19: 1)
Administrative and Support and Waste Management and Remediation Services: Landscaping Services (1-4: 2)
Professional, Scientific, and Technical Services: Administrative Management and General Management Consulting Services (1-4: 1)
Wholesale Trade: Medical, Dental, and Hospital Equipment and Supplies Merchant Wholesalers (1-4: 1)
Arts, Entertainment, and Recreation: Independent Artists, Writers, and Performers (1-4: 1)
Wholesale Trade: Other Electronic Parts and Equipment Merchant Wholesalers (1-4: 1)
Construction: New Single-Family Housing Construction (except Operative Builders) (1-4: 1)
Real Estate and Rental and Leasing: Lessors of Residential Buildings and Dwellings (1-4: 1)
Home Mortgage Disclosure Act Aggregated Statistics For Year 2009 (Based on 2 partial tracts)
A) FHA, FSA/RHS & VA Home Purchase Loans
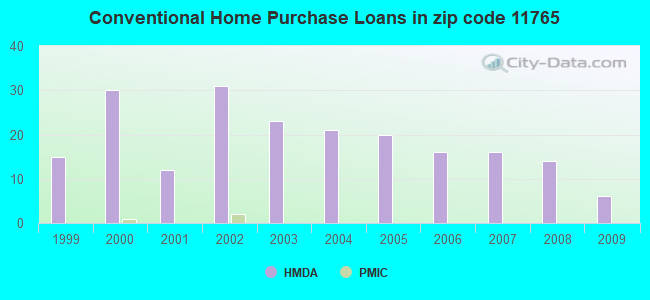
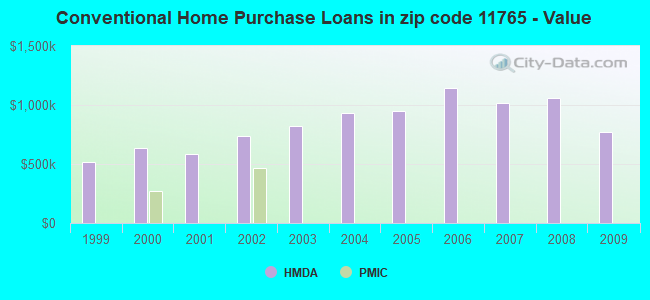
B) Conventional Home Purchase Loans
C) Refinancings
F) Non-occupant Loans on < 5 Family Dwellings (A B C & D)
Number
Average Value
Number
Average Value
Number
Average Value
Number
Average Value
LOANS ORIGINATED
1
$634,490
6
$773,302
19
$549,048
1
$1,205,780
APPLICATIONS APPROVED, NOT ACCEPTED
0
$0
2
$520,235
2
$562,535
0
$0
APPLICATIONS DENIED
0
$0
3
$607,103
11
$671,752
1
$524,610
APPLICATIONS WITHDRAWN
0
$0
4
$485,592
5
$404,810
0
$0
FILES CLOSED FOR INCOMPLETENESS
0
$0
0
$0
1
$463,350
0
$0
Aggregated Statistics For Year 2008 (Based on 2 partial tracts)
B) Conventional Home Purchase Loans
C) Refinancings
D) Home Improvement Loans
F) Non-occupant Loans on < 5 Family Dwellings (A B C & D)
Number
Average Value
Number
Average Value
Number
Average Value
Number
Average Value
LOANS ORIGINATED
14
$1,058,874
10
$989,903
1
$299,010
1
$1,345,800
APPLICATIONS APPROVED, NOT ACCEPTED
3
$1,058,457
2
$1,280,410
0
$0
0
$0
APPLICATIONS DENIED
3
$1,273,357
8
$831,402
0
$0
0
$0
APPLICATIONS WITHDRAWN
2
$1,981,020
2
$630,115
0
$0
0
$0
FILES CLOSED FOR INCOMPLETENESS
1
$1,030,260
1
$962,190
0
$0
0
$0
Aggregated Statistics For Year 2007 (Based on 2 partial tracts)
B) Conventional Home Purchase Loans
C) Refinancings
D) Home Improvement Loans
F) Non-occupant Loans on < 5 Family Dwellings (A B C & D)
Number
Average Value
Number
Average Value
Number
Average Value
Number
Average Value
LOANS ORIGINATED
16
$1,019,956
18
$1,031,473
1
$247,480
3
$1,436,233
APPLICATIONS APPROVED, NOT ACCEPTED
2
$1,229,355
5
$967,636
0
$0
0
$0
APPLICATIONS DENIED
4
$1,056,270
10
$660,017
3
$304,523
0
$0
APPLICATIONS WITHDRAWN
1
$1,591,330
4
$780,958
0
$0
0
$0
FILES CLOSED FOR INCOMPLETENESS
1
$486,200
1
$814,380
0
$0
0
$0
Aggregated Statistics For Year 2006 (Based on 2 partial tracts)
B) Conventional Home Purchase Loans
C) Refinancings
D) Home Improvement Loans
F) Non-occupant Loans on < 5 Family Dwellings (A B C & D)
Number
Average Value
Number
Average Value
Number
Average Value
Number
Average Value
LOANS ORIGINATED
16
$1,147,827
21
$1,011,250
4
$804,660
3
$1,928,593
APPLICATIONS APPROVED, NOT ACCEPTED
3
$1,117,773
2
$919,160
1
$660,750
0
$0
APPLICATIONS DENIED
10
$959,370
5
$744,080
1
$430,290
2
$664,150
APPLICATIONS WITHDRAWN
5
$850,752
7
$647,480
0
$0
0
$0
FILES CLOSED FOR INCOMPLETENESS
2
$685,055
1
$1,876,730
0
$0
0
$0
Aggregated Statistics For Year 2005 (Based on 2 partial tracts)
B) Conventional Home Purchase Loans
C) Refinancings
D) Home Improvement Loans
F) Non-occupant Loans on < 5 Family Dwellings (A B C & D)
Number
Average Value
Number
Average Value
Number
Average Value
Number
Average Value
LOANS ORIGINATED
20
$949,841
27
$998,871
3
$826,540
4
$1,255,490
APPLICATIONS APPROVED, NOT ACCEPTED
3
$1,085,037
7
$728,814
1
$759,440
1
$1,200,910
APPLICATIONS DENIED
6
$1,130,497
9
$805,796
1
$802,230
0
$0
APPLICATIONS WITHDRAWN
4
$2,436,592
10
$508,030
2
$348,850
1
$122,520
FILES CLOSED FOR INCOMPLETENESS
0
$0
1
$1,150,350
0
$0
0
$0
Aggregated Statistics For Year 2004 (Based on 2 partial tracts)
B) Conventional Home Purchase Loans
C) Refinancings
D) Home Improvement Loans
F) Non-occupant Loans on < 5 Family Dwellings (A B C & D)
Number
Average Value
Number
Average Value
Number
Average Value
Number
Average Value
LOANS ORIGINATED
21
$929,614
32
$929,432
2
$500,785
3
$1,117,613
APPLICATIONS APPROVED, NOT ACCEPTED
4
$1,017,372
4
$582,590
1
$466,750
0
$0
APPLICATIONS DENIED
5
$1,147,918
12
$582,224
3
$254,120
0
$0
APPLICATIONS WITHDRAWN
1
$1,293,290
7
$669,567
1
$1,458,600
0
$0
FILES CLOSED FOR INCOMPLETENESS
2
$805,145
1
$619,420
0
$0
0
$0
Aggregated Statistics For Year 2003 (Based on 2 partial tracts)
B) Conventional Home Purchase Loans
C) Refinancings
D) Home Improvement Loans
F) Non-occupant Loans on < 5 Family Dwellings (A B C & D)
Number
Average Value
Number
Average Value
Number
Average Value
Number
Average Value
LOANS ORIGINATED
23
$819,374
89
$585,844
1
$150,720
4
$929,858
APPLICATIONS APPROVED, NOT ACCEPTED
7
$796,743
16
$491,214
0
$0
0
$0
APPLICATIONS DENIED
5
$1,924,380
29
$832,995
2
$44,975
1
$337,420
APPLICATIONS WITHDRAWN
3
$1,611,917
18
$603,833
2
$70,500
0
$0
FILES CLOSED FOR INCOMPLETENESS
1
$2,852,050
9
$501,218
1
$85,080
0
$0
Aggregated Statistics For Year 2002 (Based on 2 partial tracts)
B) Conventional Home Purchase Loans
C) Refinancings
D) Home Improvement Loans
F) Non-occupant Loans on < 5 Family Dwellings (A B C & D)
Number
Average Value
Number
Average Value
Number
Average Value
Number
Average Value
LOANS ORIGINATED
31
$735,621
66
$565,230
9
$145,698
4
$792,142
APPLICATIONS APPROVED, NOT ACCEPTED
4
$934,962
11
$535,793
1
$138,570
0
$0
APPLICATIONS DENIED
7
$1,134,027
22
$507,990
4
$247,110
1
$883,430
APPLICATIONS WITHDRAWN
3
$818,923
14
$335,929
4
$151,088
1
$486,200
FILES CLOSED FOR INCOMPLETENESS
1
$656,370
5
$599,290
0
$0
0
$0
Aggregated Statistics For Year 2001 (Based on 2 partial tracts)
B) Conventional Home Purchase Loans
C) Refinancings
D) Home Improvement Loans
Number
Average Value
Number
Average Value
Number
Average Value
LOANS ORIGINATED
12
$583,318
36
$519,761
7
$100,921
APPLICATIONS APPROVED, NOT ACCEPTED
2
$833,105
5
$467,724
0
$0
APPLICATIONS DENIED
4
$495,438
17
$453,625
9
$160,554
APPLICATIONS WITHDRAWN
1
$464,810
8
$479,332
0
$0
FILES CLOSED FOR INCOMPLETENESS
0
$0
4
$280,660
0
$0
Aggregated Statistics For Year 2000 (Based on 2 partial tracts)
B) Conventional Home Purchase Loans
C) Refinancings
D) Home Improvement Loans
F) Non-occupant Loans on < 5 Family Dwellings (A B C & D)
Number
Average Value
Number
Average Value
Number
Average Value
Number
Average Value
LOANS ORIGINATED
30
$632,984
13
$535,755
12
$275,513
1
$1,017,620
APPLICATIONS APPROVED, NOT ACCEPTED
3
$957,490
2
$655,155
1
$146,830
1
$933,500
APPLICATIONS DENIED
3
$448,113
7
$499,744
8
$216,359
0
$0
APPLICATIONS WITHDRAWN
3
$872,730
4
$345,080
2
$45,215
0
$0
FILES CLOSED FOR INCOMPLETENESS
0
$0
1
$1,162,020
0
$0
0
$0
Aggregated Statistics For Year 1999 (Based on 1 partial tract)
B) Conventional Home Purchase Loans
C) Refinancings
D) Home Improvement Loans
F) Non-occupant Loans on < 5 Family Dwellings (A B C & D)


 Nearest zip codes: 11709, 11560, 11771, 11732, 11545, 11542.