Estimated zip code population in 2022: 18,138 Zip code population in 2010: 18,958 Zip code population in 2000: 18,847
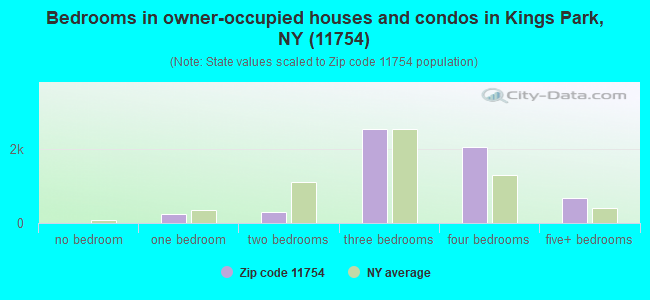
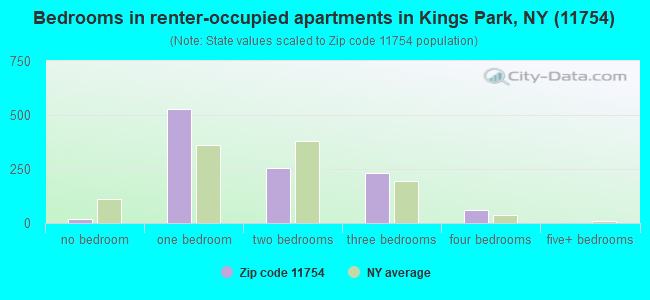
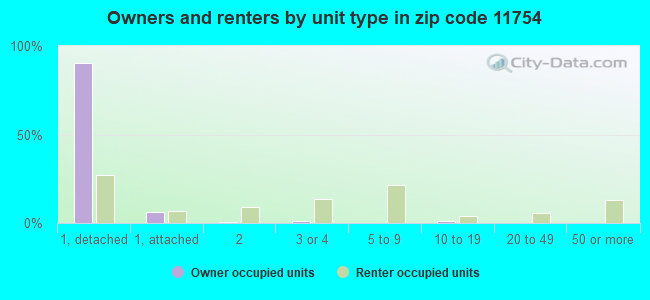
Houses and condos: 7,150 Renter-occupied apartments: 1,095
% of renters here:
16%
State:
46%
March 2022 cost of living index in zip code 11754: 149.3 (very high, U.S. average is 100)
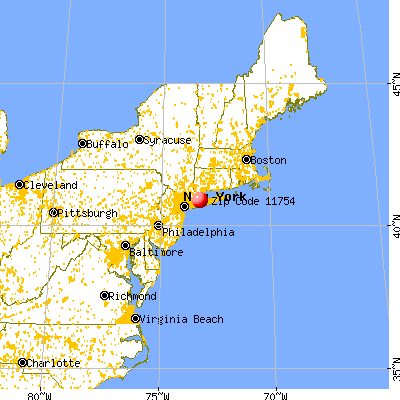
Land area: 7.4 sq. mi. Water area: 1.0 sq. mi.
Population density: 2,464 people per square mile
(low).
OSM Map
General Map
Google Map
MSN Map
OSM Map
General Map
Google Map
MSN Map
OSM Map
General Map
Google Map
MSN Map
OSM Map
General Map
Google Map
MSN Map
Please wait while loading the map...
Real estate property taxes paid for housing units in 2022:
This zip code:
1.7% ($9,805)
New York:
1.5% ($6,180)
Median real estate property taxes paid for housing units with mortgages in 2022: $9,858 (1.7%) Median real estate property taxes paid for housing units with no mortgage in 2022: $9,755 (1.6%)
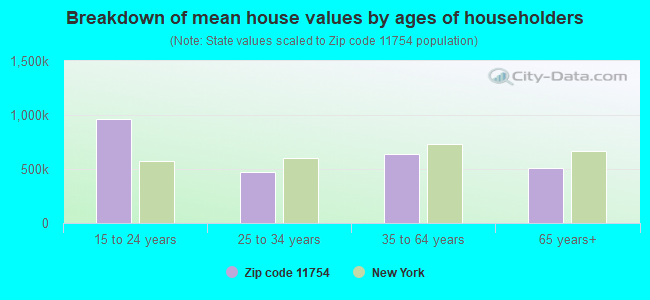
Estimated median house/condo value in 2022: $590,019
11754:
$590,019
New York:
$400,400
According to our research of New York and other state lists, there were 2 registered sex offenders living in 11754 zip code as of April 27, 2024. The ratio of all residents to sex offenders in zip code 11754 is 9,310 to 1. The ratio of registered sex offenders to all residents in this zip code is much lower than the state average.
Median resident age:
This zip code:
42.7 years
New York median age:
40.0 years
Average household size:
This zip code:
2.6 people
New York:
2.5 people
Averages for the 2020 tax year for zip code 11754, filed in 2021:
Average Adjusted Gross Income (AGI) in 2020: $102,298 (Individual Income Tax Returns)
Here:
$102,298
State:
$90,930
Salary/wage: $88,545 (reported on 80.0% of returns)
Here:
$88,545
State:
$72,104
(% of AGI for various income ranges: 1114.2% for AGIs below $25k, 3538.6% for AGIs $25k-50k, 6620.5% for AGIs $50k-75k, 9528.2% for AGIs $75k-100k, 18730.9% for AGIs $100k-200k, 63349.5% for AGIs over 200k)
Taxable interest for individuals: $1,472 (reported on 53.6% of returns)
This zip code:
$1,472
New York:
$3,075
(% of AGI for various income ranges: 32.8% for AGIs below $25k, 44.3% for AGIs $25k-50k, 101.5% for AGIs $50k-75k, 111.5% for AGIs $75k-100k, 195.3% for AGIs $100k-200k, 609.5% for AGIs over 200k)
Ordinary dividends: $5,197 (reported on 34.0% of returns)
Here:
$5,197
State:
$11,095
(% of AGI for various income ranges: 56.9% for AGIs below $25k, 68.9% for AGIs $25k-50k, 157.8% for AGIs $50k-75k, 182.0% for AGIs $75k-100k, 346.2% for AGIs $100k-200k, 2006.6% for AGIs over 200k)
Net capital gain/loss in AGI: +$8,205 (reported on 29.9% of returns)
Here:
+$8,205
State:
+$44,925
(% of AGI for various income ranges: 29.2% for AGIs below $25k, 52.1% for AGIs $25k-50k, 96.6% for AGIs $50k-75k, 174.3% for AGIs $75k-100k, 397.9% for AGIs $100k-200k, 3662.0% for AGIs over 200k)
Profit/loss from business: +$13,381 (reported on 12.6% of returns)
Here:
+$13,381
State:
+$14,940
(% of AGI for various income ranges: 85.9% for AGIs below $25k, 123.5% for AGIs $25k-50k, 191.4% for AGIs $50k-75k, 155.4% for AGIs $75k-100k, 410.0% for AGIs $100k-200k, 1376.8% for AGIs over 200k)
Taxable individual retirement arrangement distribution: $19,809 (reported on 11.8% of returns)
11754:
$19,809
New York:
$19,609
(% of AGI for various income ranges: 96.7% for AGIs below $25k, 155.5% for AGIs $25k-50k, 324.4% for AGIs $50k-75k, 488.3% for AGIs $75k-100k, 625.0% for AGIs $100k-200k, 1330.5% for AGIs over 200k)
Self-employed (Keogh) retirement plans: $22,000 (reported on 0.9% of returns)
11754:
$22,000
New York:
$32,497
(% of AGI for various income ranges: 51.6% for AGIs $100k-200k, 291.6% for AGIs over 200k)
Total itemized deductions: $27,669 (reported on 19.6% of returns)
Here:
$27,669
State:
$39,326
(% of AGI for various income ranges: 148.1% for AGIs below $25k, 226.2% for AGIs $25k-50k, 608.8% for AGIs $50k-75k, 1013.8% for AGIs $75k-100k, 1555.3% for AGIs $100k-200k, 3813.9% for AGIs over 200k)
Charity contributions: $4,211 (reported on 17.8% of returns)
Here:
$4,211
State:
$15,420
(% of AGI for various income ranges: 5.7% for AGIs below $25k, 16.4% for AGIs $25k-50k, 56.7% for AGIs $50k-75k, 93.2% for AGIs $75k-100k, 203.8% for AGIs $100k-200k, 769.5% for AGIs over 200k)
Taxes paid: $9,284 (reported on 19.5% of returns)
11754:
$9,284
State:
$9,183
(% of AGI for various income ranges: 43.8% for AGIs below $25k, 83.2% for AGIs $25k-50k, 215.5% for AGIs $50k-75k, 361.7% for AGIs $75k-100k, 551.3% for AGIs $100k-200k, 1113.6% for AGIs over 200k)
Earned income credit: $1,717 (reported on 4.7% of returns)
Here:
$1,717
State:
$2,138
(% of AGI for various income ranges: 35.7% for AGIs below $25k, 26.8% for AGIs $25k-50k)
Percentage of individuals using paid preparers for their 2020 taxes: 95.5%
Here:
95%
State:
95%
(% for various income ranges: 94.9% for AGIs below $25k, 94.5% for AGIs $25k-50k, 95.5% for AGIs $50k-75k, 95.2% for AGIs $75k-100k, 95.9% for AGIs $100k-200k, 97.4% for AGIs over 200k)
Averages for the 2012 tax year for zip code 11754, filed in 2013:
Average Adjusted Gross Income (AGI) in 2012: $84,065 (Individual Income Tax Returns)
Here:
$84,065
State:
$77,088
Salary/wage: $76,466 (reported on 82.0% of returns)
Here:
$76,466
State:
$60,593
(% of AGI for various income ranges: 65.6% for AGIs below $25k, 71.8% for AGIs $25k-50k, 70.7% for AGIs $50k-75k, 69.5% for AGIs $75k-100k, 77.4% for AGIs $100k-200k, 76.0% for AGIs over 200k)
Taxable interest for individuals: $1,208 (reported on 58.7% of returns)
This zip code:
$1,208
New York:
$3,125
(% of AGI for various income ranges: 2.1% for AGIs below $25k, 1.2% for AGIs $25k-50k, 1.2% for AGIs $50k-75k, 1.0% for AGIs $75k-100k, 0.6% for AGIs $100k-200k, 0.7% for AGIs over 200k)
Ordinary dividends: $3,252 (reported on 33.0% of returns)
Here:
$3,252
State:
$10,299
(% of AGI for various income ranges: 2.8% for AGIs below $25k, 1.7% for AGIs $25k-50k, 1.4% for AGIs $50k-75k, 1.4% for AGIs $75k-100k, 1.0% for AGIs $100k-200k, 1.3% for AGIs over 200k)
Net capital gain/loss in AGI: +$4,770 (reported on 26.5% of returns)
Here:
+$4,770
State:
+$42,474
(% of AGI for various income ranges: 0.4% for AGIs $75k-100k, 0.7% for AGIs $100k-200k, 4.3% for AGIs over 200k)
Profit/loss from business: +$14,266 (reported on 13.3% of returns)
Here:
+$14,266
State:
+$16,168
(% of AGI for various income ranges: 6.2% for AGIs below $25k, 3.6% for AGIs $25k-50k, 1.8% for AGIs $50k-75k, 2.0% for AGIs $75k-100k, 1.9% for AGIs $100k-200k, 2.2% for AGIs over 200k)
Taxable individual retirement arrangement distribution: $15,279 (reported on 13.7% of returns)
11754:
$15,279
New York:
$17,621
(% of AGI for various income ranges: 5.2% for AGIs below $25k, 3.5% for AGIs $25k-50k, 3.4% for AGIs $50k-75k, 3.4% for AGIs $75k-100k, 2.5% for AGIs $100k-200k, 1.3% for AGIs over 200k)
Self-employment retirement plans: $19,062 (reported on 0.9% of returns)
11754:
$19,062
New York:
$27,330
Total itemized deductions: $28,863 (23% of AGI, reported on 55.9% of returns)
Here:
$28,863
State:
$34,985
Here:
23.0% of AGI
State:
21.3% of AGI
(% of AGI for various income ranges: 17.7% for AGIs below $25k, 18.4% for AGIs $25k-50k, 20.4% for AGIs $50k-75k, 21.8% for AGIs $75k-100k, 21.2% for AGIs $100k-200k, 15.4% for AGIs over 200k)
Charity contributions: $2,523 (reported on 52.0% of returns)
Here:
$2,523
State:
$5,572
(% of AGI for various income ranges: 0.9% for AGIs below $25k, 1.5% for AGIs $25k-50k, 1.7% for AGIs $50k-75k, 1.8% for AGIs $75k-100k, 1.7% for AGIs $100k-200k, 1.3% for AGIs over 200k)
Taxes paid: $15,092 (reported on 55.9% of returns)
11754:
$15,092
State:
$18,656
(% of AGI for various income ranges: 7.0% for AGIs below $25k, 7.7% for AGIs $25k-50k, 9.2% for AGIs $50k-75k, 10.3% for AGIs $75k-100k, 11.0% for AGIs $100k-200k, 9.9% for AGIs over 200k)
Earned income credit: $1,721 (reported on 5.7% of returns)
Here:
$1,721
State:
$2,230
(% of AGI for various income ranges: 2.1% for AGIs below $25k, 0.5% for AGIs $25k-50k)
Percentage of individuals using paid preparers for their 2012 taxes: 69.5%
Here:
69%
State:
66%
(% for various income ranges: 59.9% for AGIs below $25k, 68.7% for AGIs $25k-50k, 68.3% for AGIs $50k-75k, 76.5% for AGIs $75k-100k, 76.7% for AGIs $100k-200k, 76.6% for AGIs over 200k)
Averages for the 2004 tax year for zip code 11754, filed in 2005:
Average Adjusted Gross Income (AGI) in 2004: $68,037 (Individual Income Tax Returns)
Here:
$68,037
State:
$59,519
Salary/wage: $63,893 (reported on 82.8% of returns)
Here:
$63,893
State:
$50,673
(% of AGI for various income ranges: 158.2% for AGIs below $10k, 64.6% for AGIs $10k-25k, 75.7% for AGIs $25k-50k, 74.3% for AGIs $50k-75k, 80.6% for AGIs $75k-100k, 78.2% for AGIs over 100k)
Taxable interest for individuals: $1,325 (reported on 70.5% of returns)
This zip code:
$1,325
New York:
$2,377
(% of AGI for various income ranges: 11.2% for AGIs below $10k, 3.7% for AGIs $10k-25k, 1.9% for AGIs $25k-50k, 1.5% for AGIs $50k-75k, 1.4% for AGIs $75k-100k, 1.0% for AGIs over 100k)
Taxable dividends: $2,014 (reported on 39.8% of returns)
Here:
$2,014
State:
$5,394
(% of AGI for various income ranges: 11.2% for AGIs below $10k, 2.7% for AGIs $10k-25k, 1.1% for AGIs $25k-50k, 1.2% for AGIs $50k-75k, 0.9% for AGIs $75k-100k, 1.1% for AGIs over 100k)
Net capital gain/loss: +$5,714 (reported on 32.3% of returns)
Here:
+$5,714
State:
+$23,581
(% of AGI for various income ranges: -7.4% for AGIs below $10k, -0.1% for AGIs $10k-25k, -0.0% for AGIs $25k-50k, 0.3% for AGIs $50k-75k, 0.2% for AGIs $75k-100k, 4.9% for AGIs over 100k)
Profit/loss from business: +$13,602 (reported on 12.5% of returns)
Here:
+$13,602
State:
+$13,809
(% of AGI for various income ranges: 9.1% for AGIs below $10k, 5.1% for AGIs $10k-25k, 3.1% for AGIs $25k-50k, 2.2% for AGIs $50k-75k, 1.7% for AGIs $75k-100k, 2.4% for AGIs over 100k)
IRA payment deduction: $3,329 (reported on 3.8% of returns)
11754:
$3,329
New York:
$3,115
(% of AGI for various income ranges: 0.5% for AGIs $10k-25k, 0.3% for AGIs $25k-50k, 0.2% for AGIs $50k-75k, 0.3% for AGIs $75k-100k, 0.1% for AGIs over 100k)
Self-employed pension: $13,614 (reported on 1.0% of returns)
Here:
$13,614
New York:
$19,016
(% of AGI for various income ranges: 0.1% for AGIs $50k-75k, 0.1% for AGIs $75k-100k, 0.3% for AGIs over 100k)
Total itemized deductions: $24,154 (24% of AGI, reported on 57.7% of returns)
Here:
$24,154
State:
$25,864
Here:
24.0% of AGI
State:
21.9% of AGI
(% of AGI for various income ranges: 29.5% for AGIs below $10k, 17.3% for AGIs $10k-25k, 21.2% for AGIs $25k-50k, 23.9% for AGIs $50k-75k, 24.1% for AGIs $75k-100k, 18.6% for AGIs over 100k)
Charity contributions deductions: $2,603 (3% of AGI, reported on 55.4% of returns)
Here:
$2,603
State:
$4,439
Here:
2.5% of AGI
State:
3.6% of AGI
(% of AGI for various income ranges: 1.4% for AGIs below $10k, 1.4% for AGIs $10k-25k, 2.1% for AGIs $25k-50k, 2.4% for AGIs $50k-75k, 2.6% for AGIs $75k-100k, 2.0% for AGIs over 100k)
Total tax: $10,487 (reported on 82.6% of returns)
11754:
$10,487
State:
$11,730
(% of AGI for various income ranges: 4.4% for AGIs below $10k, 4.5% for AGIs $10k-25k, 7.5% for AGIs $25k-50k, 8.5% for AGIs $50k-75k, 9.1% for AGIs $75k-100k, 16.5% for AGIs over 100k)
Earned income credit: $1,345 (reported on 4.8% of returns)
Here:
$1,345
State:
$1,757
Percentage of individuals using paid preparers for their 2004 taxes: 69.0%
Here:
69%
State:
67%
(% for various income ranges: 58.4% for AGIs below $10k, 63.3% for AGIs $10k-25k, 68.0% for AGIs $25k-50k, 72.7% for AGIs $50k-75k, 75.1% for AGIs $75k-100k, 75.2% for AGIs over 100k)
Likely homosexual households (counted as self-reported same-sex unmarried-partner households)
Lesbian couples: 0.1% of all households
Gay men: 0.1% of all households
Household received Food Stamps/SNAP in the past 12 months: 140 Household did not receive Food Stamps/SNAP in the past 12 months: 6,684
Women who had a birth in the past 12 months: 176 (131 now married, 44 unmarried) Women who did not have a birth in the past 12 months: 3,830 (1,651 now married, 2,166 unmarried)
Housing units in zip code 11754 with a mortgage: 3,496 (269 second mortgage, 10 home equity loan, 228 both second mortgage and home equity loan) Houses without a mortgage: 95
Median monthly owner costs for units with a mortgage: $3,164 Median monthly owner costs for units without a mortgage: $1,454
Residents with income below the poverty level in 2022:
This zip code:
2.6%
Whole state:
14.3%
Residents with income below 50% of the poverty level in 2022:
This zip code:
0.4%
Whole state:
6.8%
Median number of rooms in houses and condos:
Here:
7.1
State:
6.3
Median number of rooms in apartments:
Here:
3.3
State:
3.8
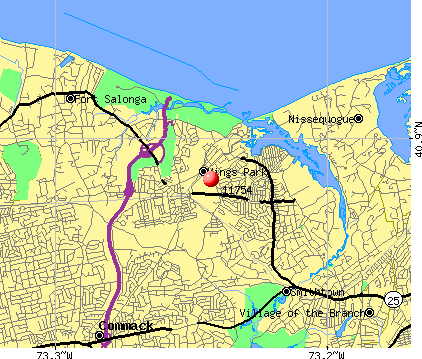
Notable locations in this zip code not listed on our city pages
Notable locations in zip code 11754: Kings Park Station (A), Saint Johnland Childrens Home (B), Smithtown Library Kings Park Branch (C), Kings Park Adult Home (D), Saint Johnland Nursing Center (E), Kings Park Volunteer Fire Department (F). Display/hide their locations on the map
3,049 married couples with children.
416 single-parent households (120 men, 296 women).
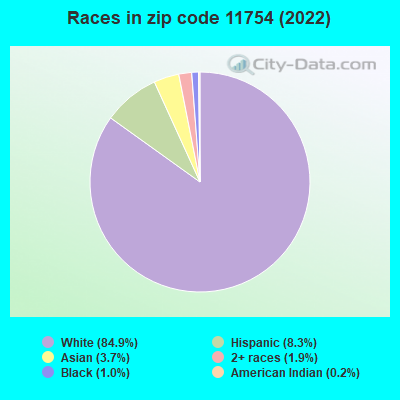
91.2% of residents of 11754 zip code speak English at home.
3.1% of residents speak Spanish at home (66% very well, 21% well, 12% not well, 1% not at all).
4.2% of residents speak other Indo-European language at home (69% very well, 21% well, 4% not well, 6% not at all).
1.5% of residents speak Asian or Pacific Island language at home (58% very well, 14% well, 28% not well).
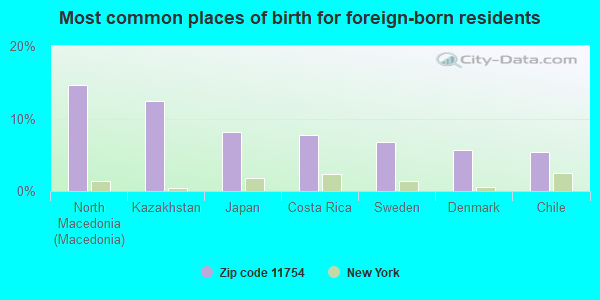
Foreign born population: 1,359 (7.5%) (69.0% of them are naturalized citizens)
This zip code:
7.5%
Whole state:
22.7%
15%North Macedonia (Macedonia)
12%Kazakhstan
8%Japan
8%Costa Rica
7%Sweden
6%Denmark
5%Chile
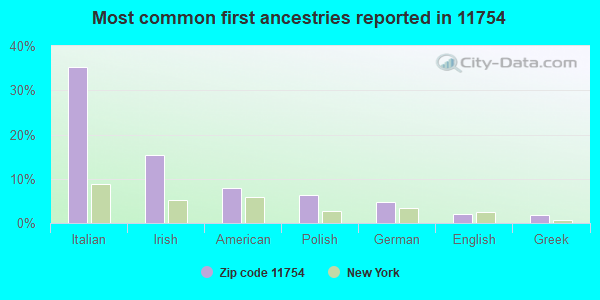
35%Italian
15%Irish
8%American
6%Polish
5%German
2%English
2%Greek
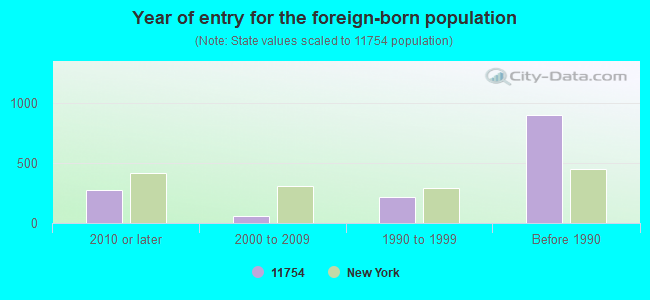
Year of entry for the foreign-born population
2772010 or later
602000 to 2009
2201990 to 1999
897Before 1990
Facilities with environmental interests located in this zip code:
CHICK S CLEANERS (52 MAIN ST in KINGS PARK, NY)
AIR MINOR (AIRS/AFS) STATE MASTER (New York facility tracking) - AIR PROGRAM Conditionally Exempt Small Quantity Generators, less than 100 kg/month of hazardous waste (Resource Conservation and Recovery Act (tracking hazardous waste)) - notification Business SIC classification: DRYCLEANING PLANTS, EXCEPT RUG CLEANING Business NAICS classification: DRYCLEANING AND LAUNDRY SERVICES (EXCEPT COIN-OPERATED). Organizations: BART & JOANN GALLETTA (CONTACT/OWNER)
Alternative names: CHICKS CLEANERS
GETTY#58054 (490 PULASKI ROAD in KINGS PARK, NY)
STATE MASTER (New York facility tracking) - AIR PROGRAM, HAZARDOUS WASTE PROGRAM Small Quantity Generators, between 100 kg and 1000 kg of hazardous waste/month (Resource Conservation and Recovery Act (tracking hazardous waste)) - notification Business SIC classification: GASOLINE SERVICE STATIONS Organizations: GETTY PETROLEUM MARKETING INC, PETER DEJANA (CONTACT/OWNER)
, DEJANA TRUCK & UTILITY EQUIPMENT (LEGALLY RESPONSIBLE PARTY)
Alternative names: DEJANA TRUCK & UTILITY EQUIP, DEJANA TRUCK & UTILITY EQUIPMENT
GROUPO S&L ASSOC (145 MAIN ST in KINGS PARK, NY)
(Resource Conservation and Recovery Act (tracking hazardous waste)) Organizations: DONALD DELDUCA (CONTACT/OWNER)
CLEANWELL CLEANERS (625 E MAIN ST in KINGS PARK, NY)
AIR MINOR (AIRS/AFS) Small Quantity Generators, between 100 kg and 1000 kg of hazardous waste/month (Resource Conservation and Recovery Act (tracking hazardous waste)) Business SIC classification: DRYCLEANING PLANTS, EXCEPT RUG CLEANING
GOLD JONATHAN DDS (277 INDIAN HEAD RD in KINGS PARK, NY)
(Resource Conservation and Recovery Act (tracking hazardous waste))
A & G MATERIALS (168 TOWNLINE ROAD in KINGS PARK, NY)
SUPERFUND (Superfund database)
BESTERCY JAMES V DDS (93 MAIN ST in KINGS PARK, NY)
Conditionally Exempt Small Quantity Generators, less than 100 kg/month of hazardous waste (Resource Conservation and Recovery Act (tracking hazardous waste))
Housing units lacking complete plumbing facilities: 0.5% Housing units lacking complete kitchen facilities: 0.5%
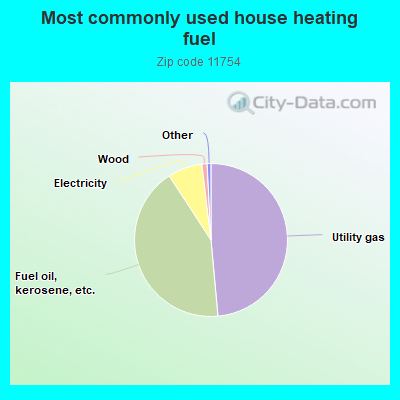
48.6%Utility gas
42.3%Fuel oil, kerosene, etc.
7.3%Electricity
1.1%Wood
Population in 1990: 19,036.
Place of birth for U.S.-born residents:
This state: 15,317
Northeast: 431
Midwest: 221
South: 452
West: 179
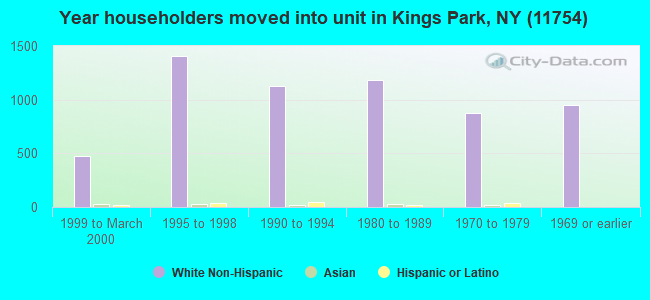
73% of the 11754 zip code residents lived in the same house 5 years ago. Out of people who lived in different houses, 66% lived in this county. Out of people who lived in different counties, 50% lived in New York.
92% of the 11754 zip code residents lived in the same house 1 year ago. Out of people who lived in different houses, 75% moved from this county. Out of people who lived in different houses, 11% moved from different county within same state. Out of people who lived in different houses, 5% moved from different state. Out of people who lived in different houses, 7% moved from abroad.
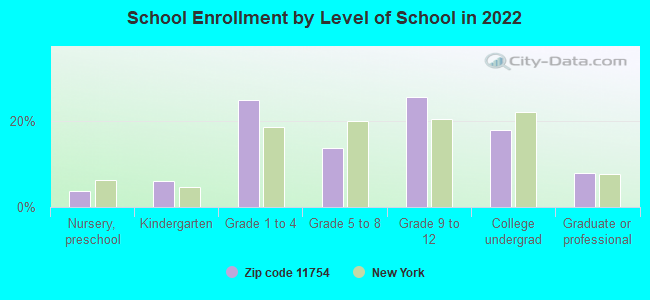
Private vs. public school enrollment:
Students in private schools in grades 1 to 8 (elementary and middle school): 39
Here:
2.7%
New York:
15.6%
Students in private schools in grades 9 to 12 (high school): 51
Here:
5.2%
New York:
15.0%
Students in private undergraduate colleges: 246
Here:
35.3%
New York:
39.2%
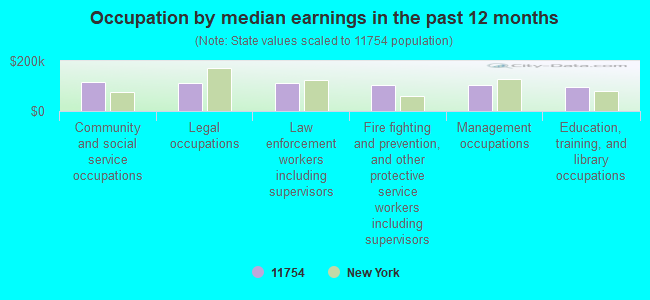
Occupation by median earnings in the past 12 months ($)
115,429Community and social service occupations
110,344Legal occupations
110,122Law enforcement workers including supervisors
102,896Fire fighting and prevention, and other protective service workers including supervisors
102,709Management occupations
97,763Education, training, and library occupations
Companies with federal contracts located in this zip code (KINGS PARK, NY):
NORTHPORT INSTRUMENTS CORP (83 LAKEVIEW DRIVE; small business) : $558,015 in 5 contractsfrom 2000 to 2001
Contracts for Aircraft Air Conditioning, Heating, and Pressurizing Equipment, Valves, Nonpowered, Miscellaneous Communication Equipment by Defense Logistics Agency Signed by year:2000: $254,780; 2001: $303,235; 2002: $0; 2003: $0; 2004: $0; 2005: $0; 2006: $0.
Biggest contracts:
$225,700 with Defense Logistics Agency for Aircraft Air Conditioning, Heating, and Pressurizing Equipment. Signed on 2001-03-01. Completion date: 2002-01-02.
$205,180, same as above.Signed on 2000-10-23. Completion date: 2002-01-14.
$49,600 with Defense Logistics Agency for Valves, Nonpowered. Signed on 2000-11-22. Completion date: 2001-09-26.
$40,680, same as above.Signed on 2001-05-31. Completion date: 2002-04-03.
CONNELLY, K CORP (16 HAWTHORNE RD; small business)
$249,849 with Defense Logistics Agency for Hose, Pipe, Tube, Lubrication, and Railing Fittings. Signed on 2006-02-17. Completion date: 2006-07-07.
IMPACT ENVIRONMENTAL CONSULTIN (1 VILLAGE PLAZA; small business) : $112,646 in 3 contractsin 2001
$61,856 with Army for Leaking Underground Storage Tank Support Services. Signed on 2001-03-02. Completion date: 2001-04-02.
$32,297 with Army for Hazardous Substance Removal, Cleanup, and Disposal Services and Operational Support. Signed on 2001-05-30. Completion date: 2001-06-30.
$18,493 with Army for Air Quality Analyses. Signed on 2001-08-21. Completion date: 2001-08-31.
CORE COMPONENTS INC (11 SPRINGBRIAR LANE; small business)
$3,059 with Navy for Electrical and Electronic assemblies, Boards, Cards, and Associated Hardware. Signed on 2006-02-14. Completion date: 2006-02-28.
Top industries in this zip code by the number of employees in 2005:
Health Care and Social Assistance: Nursing Care Facilities (250-499 employees: 1 establishment)
2002 - 2018 National Fire Incident Reporting System (NFIRS) incidents
Based on the data from the years 2002 - 2018 the average number of fire incidents per year is 14. The highest number of reported fire incidents - 43 took place in 2015, and the least - 1 in 2003. The data has a decreasing trend.
When looking into fire subcategories, the most reports belonged to: Structure Fires (42.7%), and Outside Fires (38.9%).
Fire incident types reported to NFIRS in Zip Code 11754


 Nearest zip codes: 11787, 11725, 11731, 11788, 11780, 11768.


 Based on the data from the years 2002 - 2018 the average number of fire incidents per year is 14. The highest number of reported fire incidents - 43 took place in 2015, and the least - 1 in 2003. The data has a decreasing trend.
 When looking into fire subcategories, the most reports belonged to: Structure Fires (42.7%), and Outside Fires (38.9%).