Estimated zip code population in 2022: 15,369 Zip code population in 2010: 15,524 Zip code population in 2000: 14,920
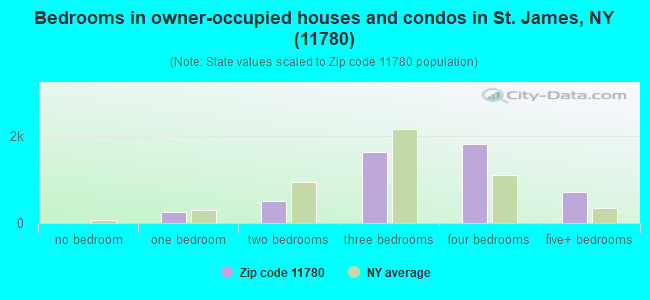
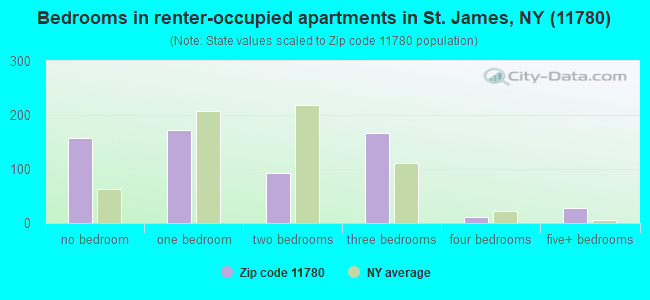
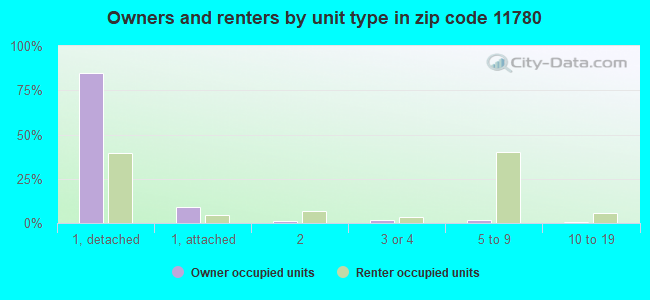
Houses and condos: 5,861 Renter-occupied apartments: 617
% of renters here:
11%
State:
46%
March 2022 cost of living index in zip code 11780: 149.8 (very high, U.S. average is 100)
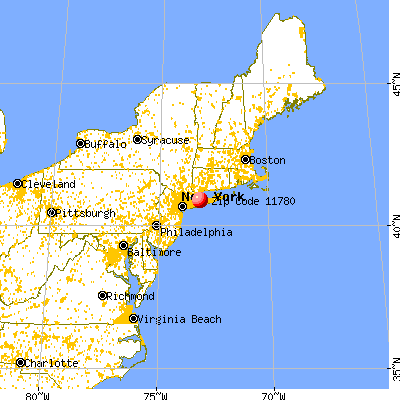
Land area: 11.5 sq. mi. Water area: 4.0 sq. mi.
Population density: 1,336 people per square mile
(low).
OSM Map
General Map
Google Map
MSN Map
OSM Map
General Map
Google Map
MSN Map
OSM Map
General Map
Google Map
MSN Map
OSM Map
General Map
Google Map
MSN Map
Please wait while loading the map...
Real estate property taxes paid for housing units in 2022:
This zip code:
1.4% ($9,805)
New York:
1.5% ($6,180)
Median real estate property taxes paid for housing units with mortgages in 2022: $9,858 (1.4%) Median real estate property taxes paid for housing units with no mortgage in 2022: $9,755 (1.5%)
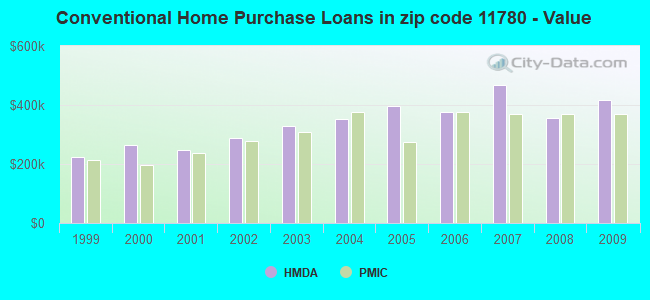
Estimated median house/condo value in 2022: $687,904
11780:
$687,904
New York:
$400,400
According to our research of New York and other state lists, there were 4 registered sex offenders living in 11780 zip code as of April 27, 2024. The ratio of all residents to sex offenders in zip code 11780 is 3,958 to 1. The ratio of registered sex offenders to all residents in this zip code is much lower than the state average.
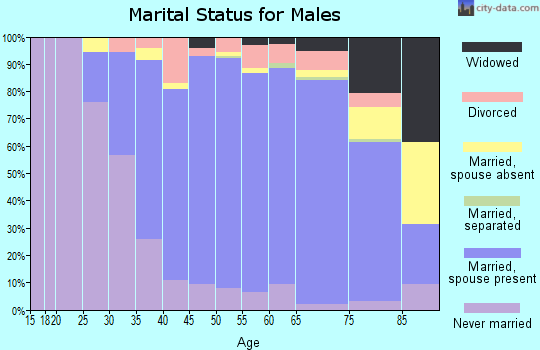
Median resident age:
This zip code:
47.1 years
New York median age:
40.0 years
Average household size:
This zip code:
2.7 people
New York:
2.5 people
Averages for the 2020 tax year for zip code 11780, filed in 2021:
Average Adjusted Gross Income (AGI) in 2020: $237,230 (Individual Income Tax Returns)
Here:
$237,230
State:
$90,930
Salary/wage: $160,972 (reported on 77.5% of returns)
Here:
$160,972
State:
$72,104
(% of AGI for various income ranges: 1224.2% for AGIs below $25k, 3413.0% for AGIs $25k-50k, 6226.6% for AGIs $50k-75k, 9163.3% for AGIs $75k-100k, 19256.3% for AGIs $100k-200k, 163723.8% for AGIs over 200k)
Taxable interest for individuals: $6,027 (reported on 57.8% of returns)
This zip code:
$6,027
New York:
$3,075
(% of AGI for various income ranges: 46.4% for AGIs below $25k, 54.0% for AGIs $25k-50k, 108.9% for AGIs $50k-75k, 154.3% for AGIs $75k-100k, 262.3% for AGIs $100k-200k, 5356.9% for AGIs over 200k)
Ordinary dividends: $19,441 (reported on 38.6% of returns)
Here:
$19,441
State:
$11,095
(% of AGI for various income ranges: 79.4% for AGIs below $25k, 102.0% for AGIs $25k-50k, 213.3% for AGIs $50k-75k, 325.5% for AGIs $75k-100k, 625.2% for AGIs $100k-200k, 11529.3% for AGIs over 200k)
Net capital gain/loss in AGI: +$32,354 (reported on 36.2% of returns)
Here:
+$32,354
State:
+$44,925
(% of AGI for various income ranges: 39.6% for AGIs below $25k, 105.7% for AGIs $25k-50k, 228.3% for AGIs $50k-75k, 287.3% for AGIs $75k-100k, 778.0% for AGIs $100k-200k, 19056.7% for AGIs over 200k)
Profit/loss from business: +$28,545 (reported on 15.4% of returns)
Here:
+$28,545
State:
+$14,940
(% of AGI for various income ranges: 122.4% for AGIs below $25k, 179.3% for AGIs $25k-50k, 130.8% for AGIs $50k-75k, 174.1% for AGIs $75k-100k, 613.6% for AGIs $100k-200k, 5856.4% for AGIs over 200k)
Taxable individual retirement arrangement distribution: $21,245 (reported on 13.1% of returns)
11780:
$21,245
New York:
$19,609
(% of AGI for various income ranges: 98.5% for AGIs below $25k, 171.1% for AGIs $25k-50k, 309.7% for AGIs $50k-75k, 474.1% for AGIs $75k-100k, 760.6% for AGIs $100k-200k, 2106.7% for AGIs over 200k)
Self-employed (Keogh) retirement plans: $28,380 (reported on 1.8% of returns)
11780:
$28,380
New York:
$32,497
(% of AGI for various income ranges: 44.9% for AGIs $100k-200k, 859.1% for AGIs over 200k)
Total itemized deductions: $40,725 (reported on 23.1% of returns)
Here:
$40,725
State:
$39,326
(% of AGI for various income ranges: 199.4% for AGIs below $25k, 314.6% for AGIs $25k-50k, 450.3% for AGIs $50k-75k, 883.9% for AGIs $75k-100k, 2059.7% for AGIs $100k-200k, 10618.0% for AGIs over 200k)
Charity contributions: $14,408 (reported on 21.4% of returns)
Here:
$14,408
State:
$15,420
(% of AGI for various income ranges: 9.8% for AGIs below $25k, 23.0% for AGIs $25k-50k, 39.1% for AGIs $50k-75k, 100.6% for AGIs $75k-100k, 302.0% for AGIs $100k-200k, 4850.4% for AGIs over 200k)
Taxes paid: $9,477 (reported on 23.1% of returns)
11780:
$9,477
State:
$9,183
(% of AGI for various income ranges: 62.0% for AGIs below $25k, 97.8% for AGIs $25k-50k, 150.5% for AGIs $50k-75k, 306.5% for AGIs $75k-100k, 677.8% for AGIs $100k-200k, 1828.0% for AGIs over 200k)
Earned income credit: $1,672 (reported on 4.4% of returns)
Here:
$1,672
State:
$2,138
(% of AGI for various income ranges: 32.3% for AGIs below $25k, 29.4% for AGIs $25k-50k)
Percentage of individuals using paid preparers for their 2020 taxes: 95.2%
Here:
95%
State:
95%
(% for various income ranges: 93.0% for AGIs below $25k, 95.2% for AGIs $25k-50k, 95.8% for AGIs $50k-75k, 96.2% for AGIs $75k-100k, 96.0% for AGIs $100k-200k, 96.1% for AGIs over 200k)
Averages for the 2012 tax year for zip code 11780, filed in 2013:
Average Adjusted Gross Income (AGI) in 2012: $213,024 (Individual Income Tax Returns)
Here:
$213,024
State:
$77,088
Salary/wage: $158,675 (reported on 79.7% of returns)
Here:
$158,675
State:
$60,593
(% of AGI for various income ranges: 68.3% for AGIs below $25k, 67.5% for AGIs $25k-50k, 65.4% for AGIs $50k-75k, 64.4% for AGIs $75k-100k, 72.8% for AGIs $100k-200k, 55.7% for AGIs over 200k)
Taxable interest for individuals: $4,388 (reported on 62.1% of returns)
This zip code:
$4,388
New York:
$3,125
(% of AGI for various income ranges: 2.8% for AGIs below $25k, 1.4% for AGIs $25k-50k, 1.8% for AGIs $50k-75k, 1.2% for AGIs $75k-100k, 1.1% for AGIs $100k-200k, 1.3% for AGIs over 200k)
Ordinary dividends: $14,924 (reported on 39.5% of returns)
Here:
$14,924
State:
$10,299
(% of AGI for various income ranges: 5.1% for AGIs below $25k, 2.8% for AGIs $25k-50k, 2.5% for AGIs $50k-75k, 2.2% for AGIs $75k-100k, 1.5% for AGIs $100k-200k, 3.0% for AGIs over 200k)
Net capital gain/loss in AGI: +$93,573 (reported on 33.2% of returns)
Here:
+$93,573
State:
+$42,474
(% of AGI for various income ranges: 0.4% for AGIs $50k-75k, 0.5% for AGIs $75k-100k, 0.8% for AGIs $100k-200k, 19.4% for AGIs over 200k)
Profit/loss from business: +$27,755 (reported on 15.4% of returns)
Here:
+$27,755
State:
+$16,168
(% of AGI for various income ranges: 5.9% for AGIs below $25k, 3.0% for AGIs $25k-50k, 2.5% for AGIs $50k-75k, 2.9% for AGIs $75k-100k, 3.0% for AGIs $100k-200k, 1.6% for AGIs over 200k)
Taxable individual retirement arrangement distribution: $21,568 (reported on 16.0% of returns)
11780:
$21,568
New York:
$17,621
(% of AGI for various income ranges: 4.8% for AGIs below $25k, 4.4% for AGIs $25k-50k, 4.3% for AGIs $50k-75k, 4.2% for AGIs $75k-100k, 3.1% for AGIs $100k-200k, 0.9% for AGIs over 200k)
Self-employment retirement plans: $28,362 (reported on 2.1% of returns)
11780:
$28,362
New York:
$27,330
(% of AGI for various income ranges: 1.3% for AGIs below $25k, 0.2% for AGIs $100k-200k, 0.3% for AGIs over 200k)
Total itemized deductions: $61,533 (18% of AGI, reported on 58.1% of returns)
Here:
$61,533
State:
$34,985
Here:
17.7% of AGI
State:
21.3% of AGI
(% of AGI for various income ranges: 20.9% for AGIs below $25k, 20.9% for AGIs $25k-50k, 21.3% for AGIs $50k-75k, 25.1% for AGIs $75k-100k, 24.1% for AGIs $100k-200k, 14.5% for AGIs over 200k)
Charity contributions: $9,020 (reported on 54.1% of returns)
Here:
$9,020
State:
$5,572
(% of AGI for various income ranges: 1.1% for AGIs below $25k, 1.5% for AGIs $25k-50k, 1.8% for AGIs $50k-75k, 2.0% for AGIs $75k-100k, 1.8% for AGIs $100k-200k, 2.5% for AGIs over 200k)
Taxes paid: $39,029 (reported on 58.0% of returns)
11780:
$39,029
State:
$18,656
(% of AGI for various income ranges: 8.6% for AGIs below $25k, 9.2% for AGIs $25k-50k, 10.5% for AGIs $50k-75k, 12.6% for AGIs $75k-100k, 12.8% for AGIs $100k-200k, 10.2% for AGIs over 200k)
Earned income credit: $1,668 (reported on 5.1% of returns)
Here:
$1,668
State:
$2,230
(% of AGI for various income ranges: 2.0% for AGIs below $25k, 0.4% for AGIs $25k-50k)
Percentage of individuals using paid preparers for their 2012 taxes: 74.9%
Here:
75%
State:
66%
(% for various income ranges: 67.9% for AGIs below $25k, 71.6% for AGIs $25k-50k, 70.2% for AGIs $50k-75k, 78.6% for AGIs $75k-100k, 80.5% for AGIs $100k-200k, 85.0% for AGIs over 200k)
Averages for the 2004 tax year for zip code 11780, filed in 2005:
Average Adjusted Gross Income (AGI) in 2004: $121,083 (Individual Income Tax Returns)
Here:
$121,083
State:
$59,519
Salary/wage: $97,957 (reported on 79.2% of returns)
Here:
$97,957
State:
$50,673
(% of AGI for various income ranges: 160.4% for AGIs below $10k, 59.5% for AGIs $10k-25k, 66.6% for AGIs $25k-50k, 70.1% for AGIs $50k-75k, 72.1% for AGIs $75k-100k, 62.5% for AGIs over 100k)
Taxable interest for individuals: $3,168 (reported on 79.6% of returns)
This zip code:
$3,168
New York:
$2,377
(% of AGI for various income ranges: 36.0% for AGIs below $10k, 5.9% for AGIs $10k-25k, 3.0% for AGIs $25k-50k, 2.5% for AGIs $50k-75k, 2.0% for AGIs $75k-100k, 1.9% for AGIs over 100k)
Taxable dividends: $4,668 (reported on 49.2% of returns)
Here:
$4,668
State:
$5,394
(% of AGI for various income ranges: 54.1% for AGIs below $10k, 4.2% for AGIs $10k-25k, 2.3% for AGIs $25k-50k, 2.3% for AGIs $50k-75k, 1.5% for AGIs $75k-100k, 1.8% for AGIs over 100k)
Net capital gain/loss: +$20,528 (reported on 42.1% of returns)
Here:
+$20,528
State:
+$23,581
(% of AGI for various income ranges: -100.0% for AGIs below $10k, -1.7% for AGIs $10k-25k, 0.6% for AGIs $25k-50k, 1.2% for AGIs $50k-75k, 0.6% for AGIs $75k-100k, 9.3% for AGIs over 100k)
Profit/loss from business: +$30,772 (reported on 17.5% of returns)
Here:
+$30,772
State:
+$13,809
(% of AGI for various income ranges: 62.2% for AGIs below $10k, 6.9% for AGIs $10k-25k, 5.4% for AGIs $25k-50k, 3.4% for AGIs $50k-75k, 3.6% for AGIs $75k-100k, 4.5% for AGIs over 100k)
IRA payment deduction: $3,709 (reported on 4.7% of returns)
11780:
$3,709
New York:
$3,115
(% of AGI for various income ranges: 0.3% for AGIs $10k-25k, 0.4% for AGIs $25k-50k, 0.2% for AGIs $50k-75k, 0.3% for AGIs $75k-100k, 0.1% for AGIs over 100k)
Self-employed pension: $19,210 (reported on 2.9% of returns)
Here:
$19,210
New York:
$19,016
(% of AGI for various income ranges: 0.1% for AGIs $25k-50k, 0.2% for AGIs $50k-75k, 0.1% for AGIs $75k-100k, 0.6% for AGIs over 100k)
Total itemized deductions: $34,592 (21% of AGI, reported on 68.8% of returns)
Here:
$34,592
State:
$25,864
Here:
21.3% of AGI
State:
21.9% of AGI
(% of AGI for various income ranges: 26.1% for AGIs $10k-25k, 22.5% for AGIs $25k-50k, 26.8% for AGIs $50k-75k, 26.5% for AGIs $75k-100k, 17.8% for AGIs over 100k)
Charity contributions deductions: $4,011 (2% of AGI, reported on 66.1% of returns)
Here:
$4,011
State:
$4,439
Here:
2.4% of AGI
State:
3.6% of AGI
(% of AGI for various income ranges: 1.7% for AGIs $10k-25k, 2.1% for AGIs $25k-50k, 2.4% for AGIs $50k-75k, 2.7% for AGIs $75k-100k, 2.1% for AGIs over 100k)
Total tax: $24,159 (reported on 89.2% of returns)
11780:
$24,159
State:
$11,730
(% of AGI for various income ranges: 9.0% for AGIs below $10k, 4.6% for AGIs $10k-25k, 7.8% for AGIs $25k-50k, 8.6% for AGIs $50k-75k, 9.3% for AGIs $75k-100k, 20.8% for AGIs over 100k)
Earned income credit: $1,488 (reported on 2.8% of returns)
Here:
$1,488
State:
$1,757
Percentage of individuals using paid preparers for their 2004 taxes: 75.8%
Here:
76%
State:
67%
(% for various income ranges: 70.2% for AGIs below $10k, 70.4% for AGIs $10k-25k, 70.2% for AGIs $25k-50k, 74.0% for AGIs $50k-75k, 78.2% for AGIs $75k-100k, 82.2% for AGIs over 100k)
Likely homosexual households (counted as self-reported same-sex unmarried-partner households)
Lesbian couples: 0.0% of all households
Gay men: 0.5% of all households
Household received Food Stamps/SNAP in the past 12 months: 173 Household did not receive Food Stamps/SNAP in the past 12 months: 5,325
Women who had a birth in the past 12 months: 161 (145 now married, 13 unmarried) Women who did not have a birth in the past 12 months: 2,977 (1,323 now married, 1,642 unmarried)
Housing units in zip code 11780 with a mortgage: 2,727 (437 second mortgage, 6 home equity loan, 410 both second mortgage and home equity loan) Houses without a mortgage: 215
Median monthly owner costs for units with a mortgage: $3,860 Median monthly owner costs for units without a mortgage: $1,487
Residents with income below the poverty level in 2022:
This zip code:
2.3%
Whole state:
14.3%
Residents with income below 50% of the poverty level in 2022:
This zip code:
0.4%
Whole state:
6.8%
Median number of rooms in houses and condos:
Here:
7.4
State:
6.3
Median number of rooms in apartments:
Here:
3.4
State:
3.8
Notable locations in this zip code not listed on our city pages
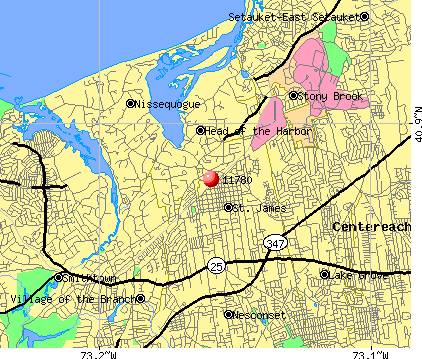
Notable locations in zip code 11780: Smithtown Bay Yacht Club (A), Nissequogue Golf Course (B), Nissequogue Point Beach Club (C), Saint James Station (D), Woodcrest (E), Saint James Healthcare Center (F), Saint James Fire Department (G). Display/hide their locations on the map
Churches in zip code 11780 include: Grace Church (A), Saint James Lutheran Church (B), Saint James Episcopal Church (C). Display/hide their locations on the map
Parks in zip code 11780 include: Gaynor Park (1), Little Africa Town Park (2), Long Beach Town Park (3), Olson Memorial Town Park (4). Display/hide their locations on the map
In group quarters: 465 (-1 institutionalized population)
Size of family households: 1,867 2-persons, 841 3-persons, 889 4-persons, 390 5-persons, 132 6-persons, 39 7-or-more-persons
Size of nonfamily households: 1,202 1-person, 176 2-persons, 3 3-persons
2,372 married couples with children.
461 single-parent households (187 men, 274 women).
90.4% of residents of 11780 zip code speak English at home.
5.2% of residents speak Spanish at home (73% very well, 17% well, 9% not well).
2.2% of residents speak other Indo-European language at home (89% very well, 8% well, 2% not well).
2.0% of residents speak Asian or Pacific Island language at home (74% very well, 18% well, 1% not well, 7% not at all).
0.3% of residents speak other language at home (81% very well, 19% not well).
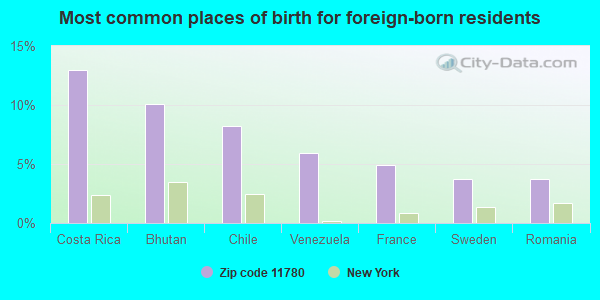
Foreign born population: 1,196 (7.8%) (67.0% of them are naturalized citizens)
This zip code:
7.8%
Whole state:
22.7%
13%Costa Rica
10%Bhutan
8%Chile
6%Venezuela
5%France
4%Sweden
4%Romania
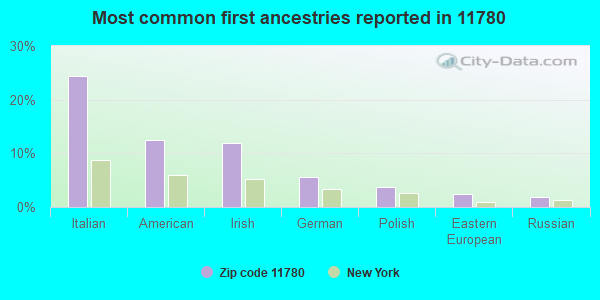
24%Italian
12%American
12%Irish
6%German
4%Polish
2%Eastern European
2%Russian
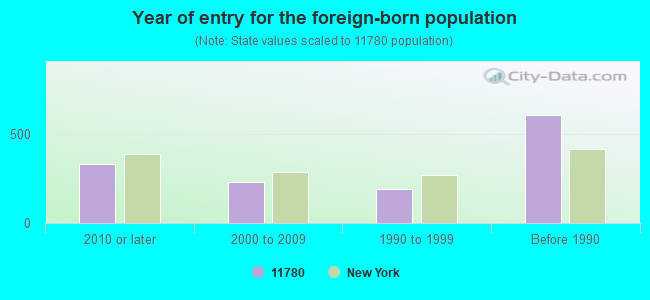
Year of entry for the foreign-born population
3312010 or later
2342000 to 2009
1891990 to 1999
609Before 1990
Facilities with environmental interests located in this zip code:
AMERICAN CUBE CORP. (FLOWERFIELD #7 MILLS POND RD in ST. JAMES, NY)
(Resource Conservation and Recovery Act (tracking hazardous waste))
ASTRO MOVING & STORAGE CO INC (30 JEFFERSON AVE in ST JAMES, NY)
(Resource Conservation and Recovery Act (tracking hazardous waste))
GETTY SERVICE STATION - ST JAMES (255 LAKE AVE in SAINT JAMES, NY)
(Resource Conservation and Recovery Act (tracking hazardous waste)) Alternative names: GETTY PETROLEUM CORP
GILLESPIE JANICE L DDS (559 LAKE AVE in ST JAMES, NY)
(Resource Conservation and Recovery Act (tracking hazardous waste))
GYRODYNE CO OF AMERICA INC (MILLS POND RD in ST JAMES, NY)
(Resource Conservation and Recovery Act (tracking hazardous waste))
HERSHKOWITZ DAVID DDS (555 LAKE AVE in ST JAMES, NY)
(Resource Conservation and Recovery Act (tracking hazardous waste))
BEUKERS PROMOTIONS INC (FLOWERFIELD BLDG #17 in ST JAMES, NY)
(Resource Conservation and Recovery Act (tracking hazardous waste))
COLORFLAGE (655 MIDDLE COUNTRY RD in ST JAMES, NY)
(Resource Conservation and Recovery Act (tracking hazardous waste))
COLORWORKS (15 KETCHAM AVE in ST JAMES, NY)
(Resource Conservation and Recovery Act (tracking hazardous waste))
CODE NOTCH LAB WORKS INC (10 E JEFFERSON AVE UNIT E in ST JAMES, NY)
Small Quantity Generators, between 100 kg and 1000 kg of hazardous waste/month (Resource Conservation and Recovery Act (tracking hazardous waste)) - notification Organizations: JOSHUA MCCLURE (CONTACT/OWNER)
4 SAASONS CESSPOOL (400 RT 25A in ST JAMES, NY)
ENFORCEMENT/COMPLIANCE ACTIVITY (Integrated Compliance Information System)
GRAPHICS DU JOUR (359 LAKE AVE in ST JAMES, NY)
Conditionally Exempt Small Quantity Generators, less than 100 kg/month of hazardous waste (Resource Conservation and Recovery Act (tracking hazardous waste))
Housing units lacking complete plumbing facilities: 0.3% Housing units lacking complete kitchen facilities: 0.3%
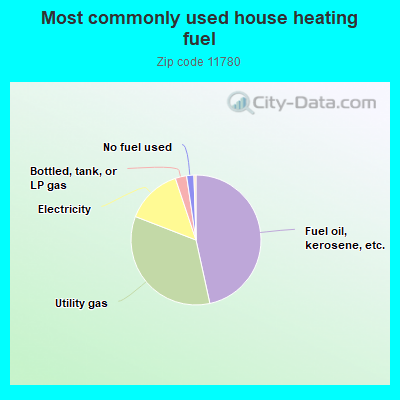
46.3%Fuel oil, kerosene, etc.
34.1%Utility gas
13.9%Electricity
2.8%Bottled, tank, or LP gas
1.8%No fuel used
0.5%Other fuel
Population in 1990: 14,211. Population change in the 1990s: +709 (+5.0%).
Place of birth for U.S.-born residents:
This state: 12,846
Northeast: 496
Midwest: 244
South: 268
West: 93
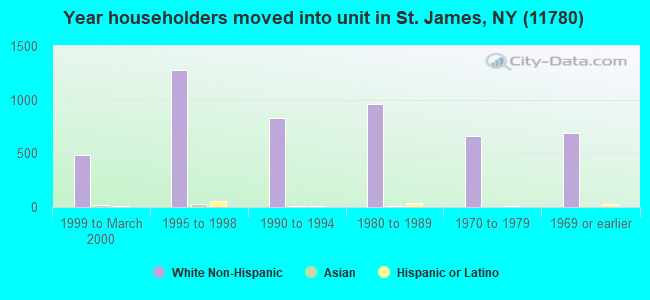
65% of the 11780 zip code residents lived in the same house 5 years ago. Out of people who lived in different houses, 70% lived in this county. Out of people who lived in different counties, 50% lived in New York.
91% of the 11780 zip code residents lived in the same house 1 year ago. Out of people who lived in different houses, 78% moved from this county. Out of people who lived in different houses, 15% moved from different county within same state. Out of people who lived in different houses, 1% moved from different state. Out of people who lived in different houses, 4% moved from abroad.
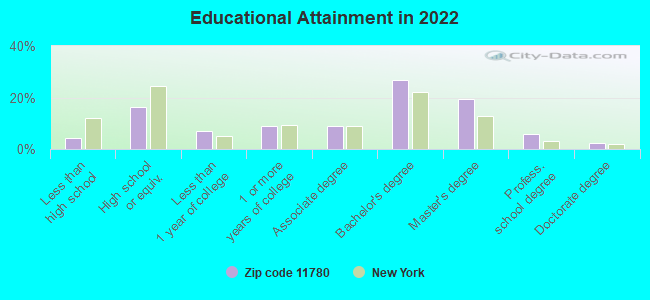
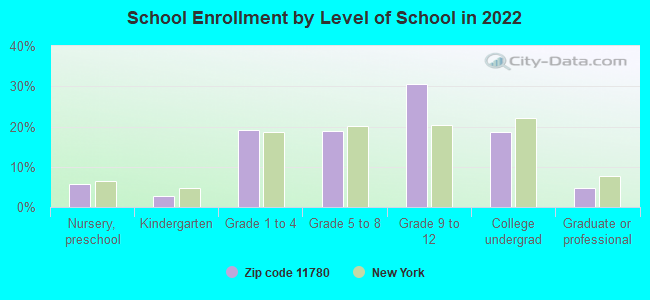
Private vs. public school enrollment:
Students in private schools in grades 1 to 8 (elementary and middle school): 90
Here:
6.5%
New York:
15.6%
Students in private schools in grades 9 to 12 (high school): 67
Here:
6.0%
New York:
15.0%
Students in private undergraduate colleges: 138
Here:
20.3%
New York:
39.2%
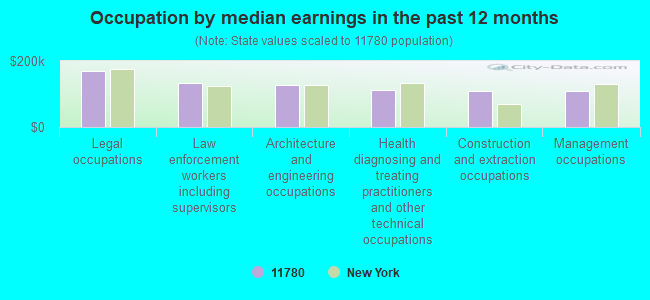
Occupation by median earnings in the past 12 months ($)
170,762Legal occupations
132,287Law enforcement workers including supervisors
126,306Architecture and engineering occupations
111,434Health diagnosing and treating practitioners and other technical occupations
110,258Construction and extraction occupations
109,300Management occupations
Companies with federal contracts located in this zip code (SAINT JAMES, NY):
CUSTOM DESIGN & MANUFACTURING (BUILDING 1 STE 39; small business) : $1,823,840 in 37 contractsfrom 2000 to 2006
Contracts for Airframe Structural Components, Aircraft Ground Servicing Equipment, Aircraft Hydraulic, Vacuum, and De-icing System Components by Defense Logistics Agency, Navy Signed by year:2000: $787,200; 2001: $98,250; 2002: $154,075; 2003: $92,150; 2004: $306,752; 2005: $224,538; 2006: $160,875.
Biggest contracts:
$292,400 with Defense Logistics Agency for Airframe Structural Components. Signed on 2000-09-07. Completion date: 2001-04-05.
$151,200, same as above.Signed on 2000-01-28. Completion date: 2000-08-25.
$98,250, same as above.Signed on 2001-10-31. Completion date: 2001-12-30.
$98,000, same as above.Signed on 2000-04-28. Completion date: 2000-10-25.
RAYANO COMMUNICATIONS NETWORK (15 GALEHURST LANE; small business) : $148,561 in 6 contractsfrom 2001 to 2005
Contracts for Scientific and Management Education by Army Signed by year:2000: $0; 2001: $25,000; 2002: $10,000; 2003: $40,000; 2004: -$8,343; 2005: $81,904; 2006: $0.
Biggest contracts:
$81,904 with Army for Scientific and Management Education. Signed on 2005-01-13. Completion date: 2004-09-30.
$25,000, same as above.Signed on 2003-09-23. Completion date: 2004-09-30.
$25,000, same as above.Signed on 2001-11-15. Completion date: 2003-09-30.
$15,000, same as above.Signed on 2003-03-25. Completion date: 2003-09-30.
QUANTUM RESONANCE (1 BRACKENWOOD PATH; small business)
$69,644 with Army for Defense Missile and Space Systems -- Advanced Development (R&D). Signed on 2000-01-05. Completion date: 2000-07-30.
PAM CAR & TRUCK RENTAL COMPANY (463 MIDDLE COUNTRY RD; small business) : $15,557 in 6 contractsfrom 2003 to 2004
Contracts for Miscellaneous Items, Lease or Rental of Equipment -- Ground Effect Vehicles, Motor Vehicles, Trailers, and Cycles by Army Signed by year:2000: $0; 2001: $0; 2002: $0; 2003: $3,396; 2004: $12,161; 2005: $0; 2006: $0.
Biggest contracts:
$3,396 with Army for Miscellaneous Items. Signed on 2004-04-16. Completion date: 2004-04-14.
$3,396 with Army for Lease or Rental of Equipment -- Ground Effect Vehicles, Motor Vehicles, Trailers, and Cycles. Signed on 2004-09-11. Completion date: 2004-11-28.
$3,396, same as above.Signed on 2003-12-18. Completion date: 2004-02-14.
$3,396 with Army for Miscellaneous Items. Signed on 2004-02-17. Completion date: 2004-04-14.
CONTINENTAL MATHEMATICS LEAGUE (273 CAMBON AVE)
$185 with Army for Tuition, Registration, and Membership Fees. Taking place in AL. Signed on 2001-11-06. Completion date: 2002-05-03.
Top industries in this zip code by the number of employees in 2005:
Health Care and Social Assistance: Nursing Care Facilities (250-499 employees: 2 establishments)
2002 - 2018 National Fire Incident Reporting System (NFIRS) incidents
Based on the data from the years 2002 - 2018 the average number of fire incidents per year is 25. The highest number of reported fire incidents - 64 took place in 2016, and the least - 0 in 2005. The data has a constant trend.
When looking into fire subcategories, the most incidents belonged to: Structure Fires (52.2%), and Outside Fires (36.1%).
Fire incident types reported to NFIRS in Zip Code 11780


 Nearest zip codes: 11790, 11794, 11787, 11733, 11767, 11755.


 Based on the data from the years 2002 - 2018 the average number of fire incidents per year is 25. The highest number of reported fire incidents - 64 took place in 2016, and the least - 0 in 2005. The data has a constant trend.
 When looking into fire subcategories, the most incidents belonged to: Structure Fires (52.2%), and Outside Fires (36.1%).