Estimated zip code population in 2022: 18,976 Zip code population in 2010: 18,511 Zip code population in 2000: 18,374
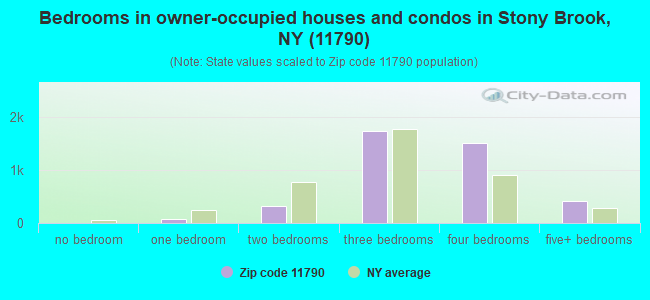
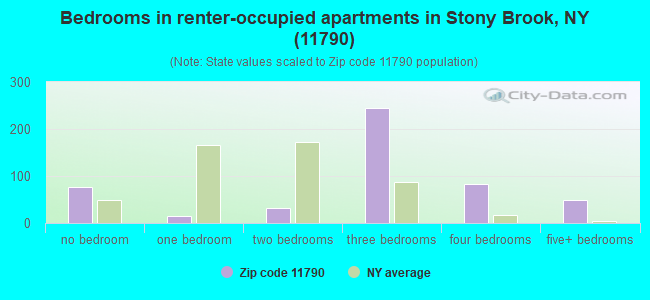
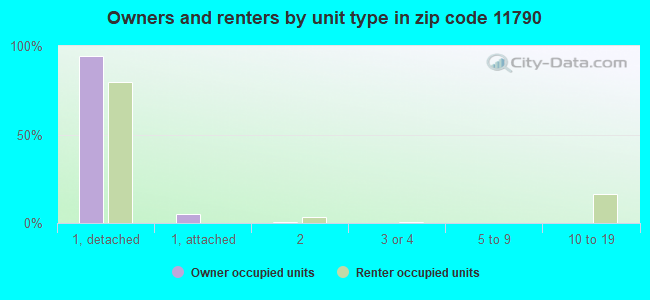
Houses and condos: 4,938 Renter-occupied apartments: 499
% of renters here:
11%
State:
46%
March 2022 cost of living index in zip code 11790: 151.6 (very high, U.S. average is 100)
Land area: 7.2 sq. mi. Water area: 0.2 sq. mi.
Population density: 2,652 people per square mile
(average).
OSM Map
General Map
Google Map
MSN Map
OSM Map
General Map
Google Map
MSN Map
OSM Map
General Map
Google Map
MSN Map
OSM Map
General Map
Google Map
MSN Map
Please wait while loading the map...
Real estate property taxes paid for housing units in 2022:
This zip code:
1.6% ($9,805)
New York:
1.5% ($6,180)
Median real estate property taxes paid for housing units with mortgages in 2022: $9,858 (1.6%) Median real estate property taxes paid for housing units with no mortgage in 2022: $9,755 (1.7%)
Estimated median house/condo value in 2022: $604,301
11790:
$604,301
New York:
$400,400
According to our research of New York and other state lists, there were 2 registered sex offenders living in 11790 zip code as of April 27, 2024. The ratio of all residents to sex offenders in zip code 11790 is 9,314 to 1. The ratio of registered sex offenders to all residents in this zip code is much lower than the state average.
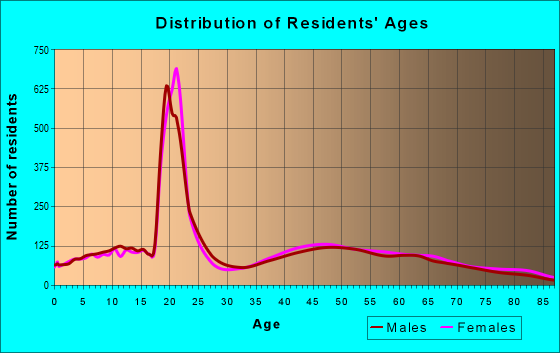
Median resident age:
This zip code:
23.7 years
New York median age:
40.0 years
Average household size:
This zip code:
2.6 people
New York:
2.5 people
Averages for the 2020 tax year for zip code 11790, filed in 2021:
Average Adjusted Gross Income (AGI) in 2020: $144,410 (Individual Income Tax Returns)
Here:
$144,410
State:
$90,930
Salary/wage: $115,234 (reported on 78.7% of returns)
Here:
$115,234
State:
$72,104
(% of AGI for various income ranges: 1234.4% for AGIs below $25k, 3602.3% for AGIs $25k-50k, 6140.8% for AGIs $50k-75k, 9083.0% for AGIs $75k-100k, 18968.5% for AGIs $100k-200k, 94364.4% for AGIs over 200k)
Taxable interest for individuals: $2,236 (reported on 56.2% of returns)
This zip code:
$2,236
New York:
$3,075
(% of AGI for various income ranges: 39.3% for AGIs below $25k, 50.3% for AGIs $25k-50k, 156.2% for AGIs $50k-75k, 167.6% for AGIs $75k-100k, 178.1% for AGIs $100k-200k, 1311.8% for AGIs over 200k)
Ordinary dividends: $8,806 (reported on 38.3% of returns)
Here:
$8,806
State:
$11,095
(% of AGI for various income ranges: 75.5% for AGIs below $25k, 101.8% for AGIs $25k-50k, 196.0% for AGIs $50k-75k, 386.8% for AGIs $75k-100k, 464.9% for AGIs $100k-200k, 4036.9% for AGIs over 200k)
Net capital gain/loss in AGI: +$16,460 (reported on 34.3% of returns)
Here:
+$16,460
State:
+$44,925
(% of AGI for various income ranges: 20.3% for AGIs below $25k, 57.3% for AGIs $25k-50k, 201.0% for AGIs $50k-75k, 260.3% for AGIs $75k-100k, 708.4% for AGIs $100k-200k, 7934.4% for AGIs over 200k)
Profit/loss from business: +$18,331 (reported on 16.6% of returns)
Here:
+$18,331
State:
+$14,940
(% of AGI for various income ranges: 117.0% for AGIs below $25k, 152.1% for AGIs $25k-50k, 263.8% for AGIs $50k-75k, 345.1% for AGIs $75k-100k, 610.6% for AGIs $100k-200k, 2861.5% for AGIs over 200k)
Taxable individual retirement arrangement distribution: $21,892 (reported on 12.8% of returns)
11790:
$21,892
New York:
$19,609
(% of AGI for various income ranges: 86.4% for AGIs below $25k, 218.8% for AGIs $25k-50k, 323.6% for AGIs $50k-75k, 541.4% for AGIs $75k-100k, 839.9% for AGIs $100k-200k, 1580.3% for AGIs over 200k)
Self-employed (Keogh) retirement plans: $20,325 (reported on 1.1% of returns)
11790:
$20,325
New York:
$32,497
(% of AGI for various income ranges: 52.5% for AGIs $100k-200k, 297.2% for AGIs over 200k)
Total itemized deductions: $31,263 (reported on 21.0% of returns)
Here:
$31,263
State:
$39,326
(% of AGI for various income ranges: 143.0% for AGIs below $25k, 355.2% for AGIs $25k-50k, 674.8% for AGIs $50k-75k, 1246.8% for AGIs $75k-100k, 1632.0% for AGIs $100k-200k, 5067.4% for AGIs over 200k)
Charity contributions: $6,738 (reported on 18.9% of returns)
Here:
$6,738
State:
$15,420
(% of AGI for various income ranges: 6.3% for AGIs below $25k, 21.6% for AGIs $25k-50k, 49.2% for AGIs $50k-75k, 130.3% for AGIs $75k-100k, 217.3% for AGIs $100k-200k, 1558.7% for AGIs over 200k)
Taxes paid: $9,300 (reported on 21.0% of returns)
11790:
$9,300
State:
$9,183
(% of AGI for various income ranges: 47.3% for AGIs below $25k, 98.2% for AGIs $25k-50k, 224.6% for AGIs $50k-75k, 404.1% for AGIs $75k-100k, 573.7% for AGIs $100k-200k, 1245.9% for AGIs over 200k)
Earned income credit: $1,409 (reported on 4.7% of returns)
Here:
$1,409
State:
$2,138
(% of AGI for various income ranges: 30.5% for AGIs below $25k, 22.7% for AGIs $25k-50k)
Percentage of individuals using paid preparers for their 2020 taxes: 95.6%
Here:
96%
State:
95%
(% for various income ranges: 93.6% for AGIs below $25k, 96.1% for AGIs $25k-50k, 96.0% for AGIs $50k-75k, 95.3% for AGIs $75k-100k, 95.9% for AGIs $100k-200k, 97.5% for AGIs over 200k)
Averages for the 2012 tax year for zip code 11790, filed in 2013:
Average Adjusted Gross Income (AGI) in 2012: $108,885 (Individual Income Tax Returns)
Here:
$108,885
State:
$77,088
Salary/wage: $92,952 (reported on 80.5% of returns)
Here:
$92,952
State:
$60,593
(% of AGI for various income ranges: 73.7% for AGIs below $25k, 68.8% for AGIs $25k-50k, 63.7% for AGIs $50k-75k, 62.4% for AGIs $75k-100k, 73.6% for AGIs $100k-200k, 66.4% for AGIs over 200k)
Taxable interest for individuals: $1,589 (reported on 63.2% of returns)
This zip code:
$1,589
New York:
$3,125
(% of AGI for various income ranges: 3.1% for AGIs below $25k, 1.6% for AGIs $25k-50k, 1.4% for AGIs $50k-75k, 1.3% for AGIs $75k-100k, 0.7% for AGIs $100k-200k, 0.8% for AGIs over 200k)
Ordinary dividends: $5,423 (reported on 39.0% of returns)
Here:
$5,423
State:
$10,299
(% of AGI for various income ranges: 4.5% for AGIs below $25k, 2.7% for AGIs $25k-50k, 2.0% for AGIs $50k-75k, 1.9% for AGIs $75k-100k, 1.5% for AGIs $100k-200k, 2.1% for AGIs over 200k)
Net capital gain/loss in AGI: +$20,409 (reported on 32.3% of returns)
Here:
+$20,409
State:
+$42,474
(% of AGI for various income ranges: 0.4% for AGIs $50k-75k, 0.6% for AGIs $100k-200k, 13.0% for AGIs over 200k)
Profit/loss from business: +$19,572 (reported on 16.7% of returns)
Here:
+$19,572
State:
+$16,168
(% of AGI for various income ranges: 4.9% for AGIs below $25k, 4.7% for AGIs $25k-50k, 3.2% for AGIs $50k-75k, 2.8% for AGIs $75k-100k, 3.2% for AGIs $100k-200k, 2.5% for AGIs over 200k)
Taxable individual retirement arrangement distribution: $20,196 (reported on 15.8% of returns)
11790:
$20,196
New York:
$17,621
(% of AGI for various income ranges: 5.0% for AGIs below $25k, 4.5% for AGIs $25k-50k, 4.8% for AGIs $50k-75k, 3.6% for AGIs $75k-100k, 3.3% for AGIs $100k-200k, 2.0% for AGIs over 200k)
Self-employment retirement plans: $16,182 (reported on 1.6% of returns)
11790:
$16,182
New York:
$27,330
Total itemized deductions: $35,122 (22% of AGI, reported on 60.1% of returns)
Here:
$35,122
State:
$34,985
Here:
21.6% of AGI
State:
21.3% of AGI
(% of AGI for various income ranges: 26.8% for AGIs below $25k, 20.6% for AGIs $25k-50k, 22.1% for AGIs $50k-75k, 23.2% for AGIs $75k-100k, 21.8% for AGIs $100k-200k, 16.0% for AGIs over 200k)
Charity contributions: $3,697 (reported on 55.2% of returns)
Here:
$3,697
State:
$5,572
(% of AGI for various income ranges: 1.2% for AGIs below $25k, 1.5% for AGIs $25k-50k, 1.7% for AGIs $50k-75k, 1.8% for AGIs $75k-100k, 1.9% for AGIs $100k-200k, 2.0% for AGIs over 200k)
Taxes paid: $19,738 (reported on 59.8% of returns)
11790:
$19,738
State:
$18,656
(% of AGI for various income ranges: 9.8% for AGIs below $25k, 9.4% for AGIs $25k-50k, 10.3% for AGIs $50k-75k, 11.8% for AGIs $75k-100k, 11.8% for AGIs $100k-200k, 10.2% for AGIs over 200k)
Earned income credit: $1,310 (reported on 4.5% of returns)
Here:
$1,310
State:
$2,230
(% of AGI for various income ranges: 1.4% for AGIs below $25k, 0.3% for AGIs $25k-50k)
Percentage of individuals using paid preparers for their 2012 taxes: 67.0%
Here:
67%
State:
66%
(% for various income ranges: 56.5% for AGIs below $25k, 63.4% for AGIs $25k-50k, 67.1% for AGIs $50k-75k, 75.0% for AGIs $75k-100k, 72.0% for AGIs $100k-200k, 78.5% for AGIs over 200k)
Averages for the 2004 tax year for zip code 11790, filed in 2005:
Average Adjusted Gross Income (AGI) in 2004: $80,443 (Individual Income Tax Returns)
Here:
$80,443
State:
$59,519
Salary/wage: $70,614 (reported on 78.7% of returns)
Here:
$70,614
State:
$50,673
(% of AGI for various income ranges: 134.2% for AGIs below $10k, 72.9% for AGIs $10k-25k, 70.6% for AGIs $25k-50k, 69.3% for AGIs $50k-75k, 74.2% for AGIs $75k-100k, 67.4% for AGIs over 100k)
Taxable interest for individuals: $2,012 (reported on 70.7% of returns)
This zip code:
$2,012
New York:
$2,377
(% of AGI for various income ranges: 10.4% for AGIs below $10k, 3.7% for AGIs $10k-25k, 2.9% for AGIs $25k-50k, 2.1% for AGIs $50k-75k, 1.7% for AGIs $75k-100k, 1.5% for AGIs over 100k)
Taxable dividends: $3,787 (reported on 41.2% of returns)
Here:
$3,787
State:
$5,394
(% of AGI for various income ranges: 9.9% for AGIs below $10k, 2.8% for AGIs $10k-25k, 2.3% for AGIs $25k-50k, 2.0% for AGIs $50k-75k, 1.9% for AGIs $75k-100k, 1.8% for AGIs over 100k)
Net capital gain/loss: +$9,727 (reported on 35.3% of returns)
Here:
+$9,727
State:
+$23,581
(% of AGI for various income ranges: -7.5% for AGIs below $10k, -0.4% for AGIs $10k-25k, -0.4% for AGIs $25k-50k, 0.7% for AGIs $50k-75k, 0.6% for AGIs $75k-100k, 6.0% for AGIs over 100k)
Profit/loss from business: +$21,722 (reported on 15.8% of returns)
Here:
+$21,722
State:
+$13,809
(% of AGI for various income ranges: 2.4% for AGIs below $10k, 4.3% for AGIs $10k-25k, 4.9% for AGIs $25k-50k, 2.8% for AGIs $50k-75k, 3.3% for AGIs $75k-100k, 4.5% for AGIs over 100k)
IRA payment deduction: $3,628 (reported on 3.8% of returns)
11790:
$3,628
New York:
$3,115
(% of AGI for various income ranges: 0.5% for AGIs below $10k, 0.3% for AGIs $10k-25k, 0.5% for AGIs $25k-50k, 0.3% for AGIs $50k-75k, 0.2% for AGIs $75k-100k, 0.1% for AGIs over 100k)
Self-employed pension: $14,883 (reported on 2.0% of returns)
Here:
$14,883
New York:
$19,016
(% of AGI for various income ranges: 0.2% for AGIs $25k-50k, 0.1% for AGIs $50k-75k, 0.3% for AGIs $75k-100k, 0.5% for AGIs over 100k)
Total itemized deductions: $25,456 (21% of AGI, reported on 60.3% of returns)
Here:
$25,456
State:
$25,864
Here:
21.1% of AGI
State:
21.9% of AGI
(% of AGI for various income ranges: 25.4% for AGIs below $10k, 18.8% for AGIs $10k-25k, 22.9% for AGIs $25k-50k, 25.3% for AGIs $50k-75k, 25.9% for AGIs $75k-100k, 16.9% for AGIs over 100k)
Charity contributions deductions: $3,405 (3% of AGI, reported on 52.3% of returns)
Here:
$3,405
State:
$4,439
Here:
2.5% of AGI
State:
3.6% of AGI
(% of AGI for various income ranges: 0.8% for AGIs below $10k, 1.8% for AGIs $10k-25k, 2.2% for AGIs $25k-50k, 2.4% for AGIs $50k-75k, 2.5% for AGIs $75k-100k, 2.2% for AGIs over 100k)
Total tax: $16,034 (reported on 76.4% of returns)
11790:
$16,034
State:
$11,730
(% of AGI for various income ranges: 3.2% for AGIs below $10k, 4.6% for AGIs $10k-25k, 7.5% for AGIs $25k-50k, 8.8% for AGIs $50k-75k, 9.6% for AGIs $75k-100k, 18.1% for AGIs over 100k)
Earned income credit: $1,085 (reported on 3.7% of returns)
Here:
$1,085
State:
$1,757
Percentage of individuals using paid preparers for their 2004 taxes: 64.2%
Here:
64%
State:
67%
(% for various income ranges: 50.9% for AGIs below $10k, 51.5% for AGIs $10k-25k, 66.0% for AGIs $25k-50k, 73.0% for AGIs $50k-75k, 73.1% for AGIs $75k-100k, 75.2% for AGIs over 100k)
Likely homosexual households (counted as self-reported same-sex unmarried-partner households)
Lesbian couples: 0.0% of all households
Gay men: 0.3% of all households
Household received Food Stamps/SNAP in the past 12 months: 96 Household did not receive Food Stamps/SNAP in the past 12 months: 4,415
Women who had a birth in the past 12 months: 144 (122 now married, 21 unmarried) Women who did not have a birth in the past 12 months: 5,617 (1,204 now married, 4,453 unmarried)
Housing units in zip code 11790 with a mortgage: 2,385 (259 second mortgage, 43 home equity loan, 218 both second mortgage and home equity loan) Houses without a mortgage: 68
Median monthly owner costs for units with a mortgage: $3,499 Median monthly owner costs for units without a mortgage: $1,487
Residents with income below the poverty level in 2022:
This zip code:
5.2%
Whole state:
14.3%
Residents with income below 50% of the poverty level in 2022:
This zip code:
0.9%
Whole state:
6.8%
Median number of rooms in houses and condos:
Here:
7.1
State:
6.3
Median number of rooms in apartments:
Here:
5.9
State:
3.8
Notable locations in this zip code not listed on our city pages
Notable locations in zip code 11790: Stony Brook Station (A), Stony Brook Yacht Club (B), Saint Georges Country Club (C), Old Field Club (D), Long Island Museum of American Art, History and Carriages (E), Stony Brook Fire Department (F). Display/hide their locations on the map
Churches in zip code 11790 include: All Souls Episcopal Church (A), Stony Brook Community Methodist Church (B), Christ Community Church (C). Display/hide their locations on the map
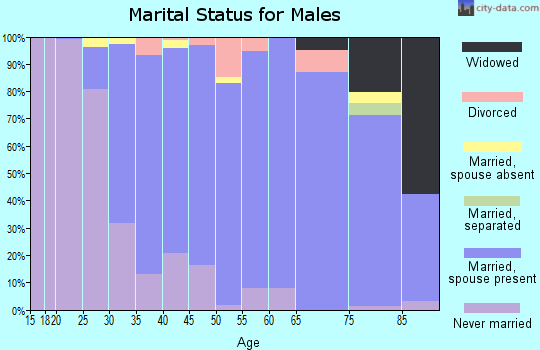
1,983 married couples with children.
258 single-parent households (37 men, 221 women).
66.9% of residents of 11790 zip code speak English at home.
5.2% of residents speak Spanish at home (83% very well, 8% well, 9% not well).
9.3% of residents speak other Indo-European language at home (87% very well, 11% well, 2% not well).
16.5% of residents speak Asian or Pacific Island language at home (65% very well, 30% well, 4% not well, 1% not at all).
1.9% of residents speak other language at home (95% very well, 5% well).
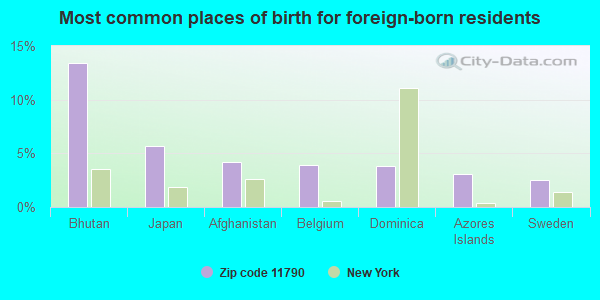
Foreign born population: 3,588 (18.9%) (47.6% of them are naturalized citizens)
Facilities with environmental interests located in this zip code:
ALBERT FOX DDS (1212 RTE 25A in STONY BROOK, NY)
(Resource Conservation and Recovery Act (tracking hazardous waste))
GETTY SERVICE STATION (999 RTE 25A in STONY BROOK, NY)
(Resource Conservation and Recovery Act (tracking hazardous waste))
HANH NGHIEM DDS (2500-45 NESCONSET HWY in STONY BROOK, NY)
(Resource Conservation and Recovery Act (tracking hazardous waste))
HESS STATION #32330 (2451 NESCONSET HWY in STONY BROOK, NY)
AIR MINOR (AIRS/AFS) Business SIC classification: GASOLINE SERVICE STATIONS
ISLAND COLOR (11 STONY BROOK AVE in STONY BROOK, NY)
(Resource Conservation and Recovery Act (tracking hazardous waste))
AMERADA HESS STATION 32330 (2451 NESCONSET HWY in STONY BROOK, NY)
Conditionally Exempt Small Quantity Generators, less than 100 kg/month of hazardous waste (Resource Conservation and Recovery Act (tracking hazardous waste)) - notification Organizations: AMERADA HESS CORP (CONTACT/OWNER)
CHERNOFF IRA MD (2500 RTE 347 BLDG 20 in STONY BROOK, NY)
Small Quantity Generators, between 100 kg and 1000 kg of hazardous waste/month (Resource Conservation and Recovery Act (tracking hazardous waste)) - notification Organizations: S B M P II 2 REALTY LLC (CONTACT/OWNER)
Housing units lacking complete kitchen facilities: 0.2%
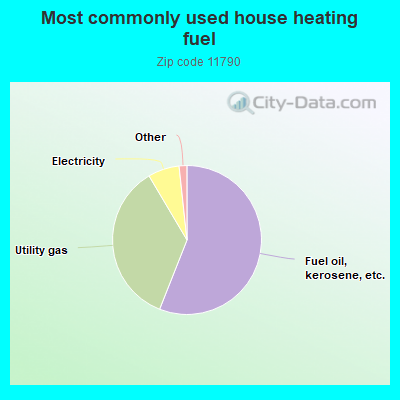
56.0%Fuel oil, kerosene, etc.
35.5%Utility gas
6.8%Electricity
0.9%Bottled, tank, or LP gas
0.7%Solar energy
Population in 1990: 13,767. Population change in the 1990s: +4,607 (+33.5%).
Place of birth for U.S.-born residents:
This state: 12,922
Northeast: 1,183
Midwest: 394
South: 420
West: 186
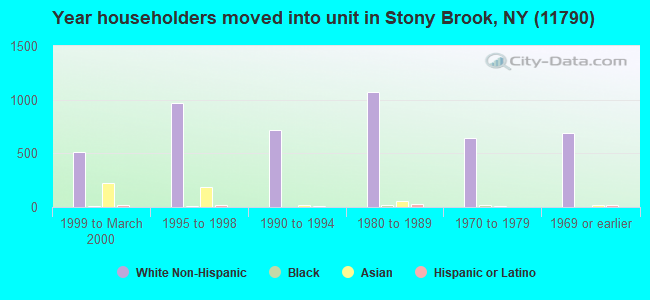
59% of the 11790 zip code residents lived in the same house 5 years ago. Out of people who lived in different houses, 42% lived in this county. Out of people who lived in different counties, 50% lived in New York.
92% of the 11790 zip code residents lived in the same house 1 year ago. Out of people who lived in different houses, 42% moved from this county. Out of people who lived in different houses, 19% moved from different county within same state. Out of people who lived in different houses, 20% moved from different state. Out of people who lived in different houses, 21% moved from abroad.
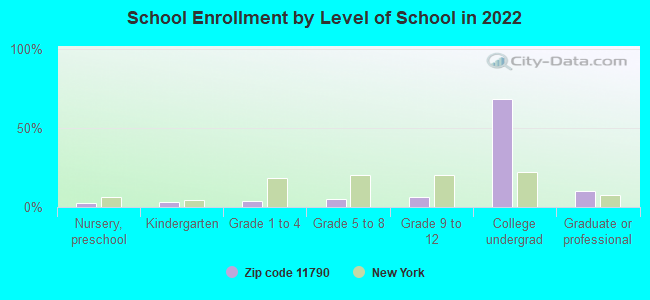
Private vs. public school enrollment:
Students in private schools in grades 1 to 8 (elementary and middle school): 18
Here:
2.2%
New York:
15.6%
Students in private schools in grades 9 to 12 (high school): 83
Here:
13.5%
New York:
15.0%
Students in private undergraduate colleges: 371
Here:
5.7%
New York:
39.2%
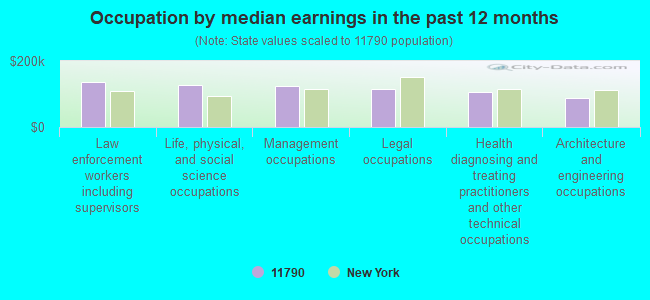
Occupation by median earnings in the past 12 months ($)
135,115Law enforcement workers including supervisors
128,060Life, physical, and social science occupations
124,960Management occupations
114,460Legal occupations
104,933Health diagnosing and treating practitioners and other technical occupations
89,137Architecture and engineering occupations
Companies with federal contracts located in this zip code:
THAEROCOMP TECHNICAL CORPORATI (132 SYCAMORE CIRCLE in STONY BROOK, NY; small business) : $2,662,372 in 15 contractsfrom 2002 to 2006
Contracts for Other Defense -- Management and Support (R&D), Defense Aircraft -- Basic Research (R&D), Other Defense -- Applied Research and Exploratory Development (R&D), Defense Aircraft -- Management and Support (R&D), and moreby Air Force, Navy Signed by year:2000: $0; 2001: $0; 2002: $97,353; 2003: $943,173; 2004: $848,494; 2005: $423,352; 2006: $350,000.
Biggest contracts:
$747,491 with Air Force for Other Defense -- Management and Support (R&D). Signed on 2003-05-22. Completion date: 2005-05-15.
$375,000 with Air Force for Defense Aircraft -- Basic Research (R&D). Signed on 2004-06-24. Completion date: 2006-10-31.
$274,760, same as above.Signed on 2004-11-15. Completion date: 2006-10-31.
$239,000 with Air Force for Other Defense -- Applied Research and Exploratory Development (R&D). Signed on 2006-04-06. Completion date: 2007-09-24.
MESOSCRIBE TECHNOLOGIES (LONG ISLAND HIGH TECHNOLOG in STONY BROOK, NY; small business) : $2,132,666 in 14 contractsfrom 2003 to 2006
Contracts for Other Defense -- Applied Research and Exploratory Development (R&D), Defense Electronics and Communication Equipment -- Basic Research (R&D), Physical Sciences -- Management and Support (R&D), Defense Aircraft -- Basic Research (R&D), and moreby Army, Navy, Air Force, NASA, and others Signed by year:2000: $0; 2001: $0; 2002: $0; 2003: $98,979; 2004: $811,530; 2005: $952,209; 2006: $269,948.
Biggest contracts:
$377,260 with Army for Other Defense -- Applied Research and Exploratory Development (R&D). Signed on 2005-07-14. Completion date: 2006-11-15.
$374,995, same as above.Signed on 2005-08-09. Completion date: 2007-11-10.
$372,486, same as above.Signed on 2004-08-19. Completion date: 2006-11-15.
$100,232 with Navy for Defense Electronics and Communication Equipment -- Basic Research (R&D). Taking place in DC. Signed on 2004-03-31. Completion date: 2007-03-30.
VIATRONIX INC (25 E LOOP RD STE 204 in STONY BROOK, NY; small business) : $377,983 in 13 contractsfrom 2002 to 2006
Contracts for Drugs and Biologicals, Medical and Surgical Instruments, Equipment, and Supplies, Radiology Services, ADP Software, and moreby Navy, Army, Office of Policy, Management and Budget/Chief Financial Officer Signed by year:2000: $0; 2001: $0; 2002: $160,998; 2003: $0; 2004: $64,359; 2005: $124,626; 2006: $28,000.
Biggest contracts:
$80,499 with Navy for Drugs and Biologicals. Signed on 2002-09-12. Completion date: 2002-10-11.
$80,499 with Navy for Medical and Surgical Instruments, Equipment, and Supplies. Signed on 2002-07-18. Completion date: 2002-07-23.
$68,502 with Army for Radiology Services. Signed on 2005-09-23. Completion date: 2005-09-30.
$42,108 with Navy for Medical and Surgical Instruments, Equipment, and Supplies. Signed on 2004-05-17. Completion date: 2004-06-01.
RESEARCH FOUNDATION OF STATE U (LAB OFFICE BLDG NCOLLS RD in STONY BROOK, NY)
$54,128 with Navy for Other Defense -- Basic Research (R&D). Signed on 2000-02-04. Completion date: 2000-09-29.
STONY BROOK CONSULTING (8 COLLEGE DRIVE in STONY BROOK, NY; small business)
$10,000 with Army for Specifications Development Services. Signed on 2005-03-22. Completion date: 2006-04-14.
JAMES GLIMM (260 CHRISTIAN AVENUE in STONY BROOK, NY; small business)
$8,941 with Army for Other Professional Services. Taking place in MD. Signed on 2001-11-26. Completion date: 2002-01-31.
LUXWELL CORP. (25 EAST LOOP ROAD in STONYBROOK, NY; small business)
-$428,300 with Air Force for Oscillators and Piezoelectric Crystals. Signed on 2000-08-31. Completion date: 2000-08-31.
Top industries in this zip code by the number of employees in 2005:
Professional, Scientific, and Technical Services: Research and Development in the Physical, Engineering, and Life Sciences (over 1000 employees: 1 establishment, 20-49 employees: 1 establishment, 10-19 employees: 2 establishments, 5-9 employees: 1 establishment, 1-4 employees: 9 establishments)
Health Care and Social Assistance: Offices of Physicians (except Mental Health Specialists) (50-99: 3, 20-49: 8, 10-19: 15, 5-9: 16, 1-4: 20)
2002 - 2018 National Fire Incident Reporting System (NFIRS) incidents
According to the data from the years 2002 - 2018 the average number of fire incidents per year is 13. The highest number of reported fires - 27 took place in 2015, and the least - 0 in 2005. The data has a declining trend.
When looking into fire subcategories, the most reports belonged to: Structure Fires (46.5%), and Outside Fires (36.9%).
Fire incident types reported to NFIRS in Zip Code 11790
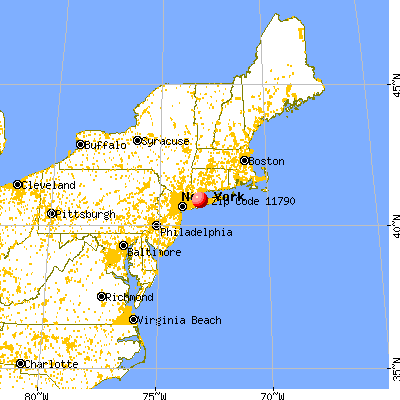


 Nearest zip codes: 11794, 11733, 11780, 11755, 11720, 11767.


 According to the data from the years 2002 - 2018 the average number of fire incidents per year is 13. The highest number of reported fires - 27 took place in 2015, and the least - 0 in 2005. The data has a declining trend.
 When looking into fire subcategories, the most reports belonged to: Structure Fires (46.5%), and Outside Fires (36.9%).