Estimated zip code population in 2022: 28,729 Zip code population in 2010: 29,189 Zip code population in 2000: 28,105
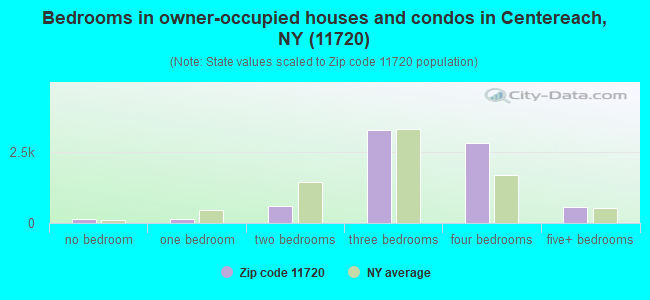
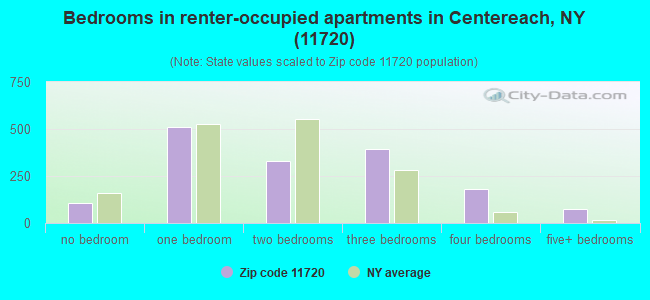
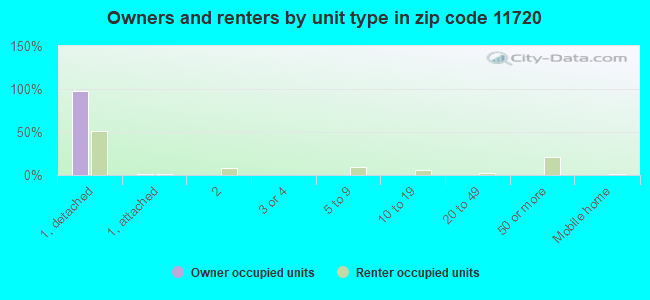
Houses and condos: 9,617 Renter-occupied apartments: 1,609
% of renters here:
18%
State:
46%
March 2022 cost of living index in zip code 11720: 148.9 (very high, U.S. average is 100)
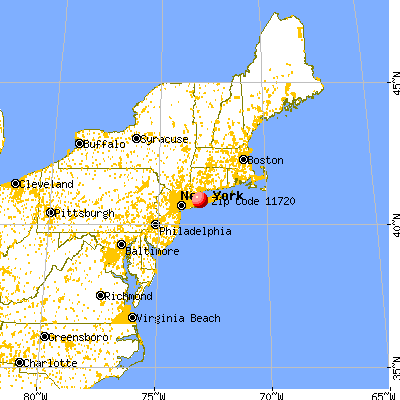
Land area: 8.2 sq. mi. Water area: 0.0 sq. mi.
Population density: 3,518 people per square mile
(average).
OSM Map
General Map
Google Map
MSN Map
OSM Map
General Map
Google Map
MSN Map
OSM Map
General Map
Google Map
MSN Map
OSM Map
General Map
Google Map
MSN Map
Please wait while loading the map...
Real estate property taxes paid for housing units in 2022:
This zip code:
2.1% ($9,805)
New York:
1.5% ($6,180)
Median real estate property taxes paid for housing units with mortgages in 2022: $9,858 (2.1%) Median real estate property taxes paid for housing units with no mortgage in 2022: $9,755 (2.1%)
Estimated median house/condo value in 2022: $457,109
11720:
$457,109
New York:
$400,400
According to our research of New York and other state lists, there were 10 registered sex offenders living in 11720 zip code as of April 27, 2024. The ratio of all residents to sex offenders in zip code 11720 is 2,924 to 1. The ratio of registered sex offenders to all residents in this zip code is much lower than the state average.
Median resident age:
This zip code:
38.8 years
New York median age:
40.0 years
Average household size:
This zip code:
3.1 people
New York:
2.5 people
Averages for the 2020 tax year for zip code 11720, filed in 2021:
Average Adjusted Gross Income (AGI) in 2020: $78,039 (Individual Income Tax Returns)
Here:
$78,039
State:
$90,930
Salary/wage: $70,165 (reported on 83.6% of returns)
Here:
$70,165
State:
$72,104
(% of AGI for various income ranges: 1215.4% for AGIs below $25k, 3518.0% for AGIs $25k-50k, 6456.3% for AGIs $50k-75k, 9411.4% for AGIs $75k-100k, 18299.6% for AGIs $100k-200k, 66605.8% for AGIs over 200k)
Taxable interest for individuals: $989 (reported on 44.7% of returns)
This zip code:
$989
New York:
$3,075
(% of AGI for various income ranges: 14.9% for AGIs below $25k, 26.2% for AGIs $25k-50k, 44.8% for AGIs $50k-75k, 84.4% for AGIs $75k-100k, 116.0% for AGIs $100k-200k, 558.5% for AGIs over 200k)
Ordinary dividends: $4,054 (reported on 21.5% of returns)
Here:
$4,054
State:
$11,095
(% of AGI for various income ranges: 23.4% for AGIs below $25k, 35.3% for AGIs $25k-50k, 77.6% for AGIs $50k-75k, 148.4% for AGIs $75k-100k, 211.3% for AGIs $100k-200k, 1478.2% for AGIs over 200k)
Net capital gain/loss in AGI: +$7,690 (reported on 19.5% of returns)
Here:
+$7,690
State:
+$44,925
(% of AGI for various income ranges: 8.3% for AGIs below $25k, 23.7% for AGIs $25k-50k, 61.7% for AGIs $50k-75k, 149.8% for AGIs $75k-100k, 341.0% for AGIs $100k-200k, 3933.9% for AGIs over 200k)
Profit/loss from business: +$10,264 (reported on 13.0% of returns)
Here:
+$10,264
State:
+$14,940
(% of AGI for various income ranges: 113.7% for AGIs below $25k, 108.4% for AGIs $25k-50k, 106.4% for AGIs $50k-75k, 130.2% for AGIs $75k-100k, 282.9% for AGIs $100k-200k, 1898.8% for AGIs over 200k)
Taxable individual retirement arrangement distribution: $18,032 (reported on 8.2% of returns)
11720:
$18,032
New York:
$19,609
(% of AGI for various income ranges: 41.2% for AGIs below $25k, 75.6% for AGIs $25k-50k, 166.4% for AGIs $50k-75k, 266.8% for AGIs $75k-100k, 473.8% for AGIs $100k-200k, 1527.3% for AGIs over 200k)
Self-employed (Keogh) retirement plans: $21,900 (reported on 0.3% of returns)
11720:
$21,900
New York:
$32,497
(% of AGI for various income ranges: 28.9% for AGIs $75k-100k, 228.5% for AGIs over 200k)
Total itemized deductions: $27,938 (reported on 15.9% of returns)
Here:
$27,938
State:
$39,326
(% of AGI for various income ranges: 98.1% for AGIs below $25k, 232.9% for AGIs $25k-50k, 580.7% for AGIs $50k-75k, 1037.8% for AGIs $75k-100k, 1363.0% for AGIs $100k-200k, 3752.4% for AGIs over 200k)
Charity contributions: $4,106 (reported on 13.6% of returns)
Here:
$4,106
State:
$15,420
(% of AGI for various income ranges: 4.0% for AGIs below $25k, 14.6% for AGIs $25k-50k, 54.3% for AGIs $50k-75k, 98.6% for AGIs $75k-100k, 188.1% for AGIs $100k-200k, 751.2% for AGIs over 200k)
Taxes paid: $8,805 (reported on 15.8% of returns)
11720:
$8,805
State:
$9,183
(% of AGI for various income ranges: 31.8% for AGIs below $25k, 77.3% for AGIs $25k-50k, 197.1% for AGIs $50k-75k, 341.5% for AGIs $75k-100k, 424.8% for AGIs $100k-200k, 1026.7% for AGIs over 200k)
Earned income credit: $1,877 (reported on 8.8% of returns)
Here:
$1,877
State:
$2,138
(% of AGI for various income ranges: 56.0% for AGIs below $25k, 42.6% for AGIs $25k-50k, 0.7% for AGIs $50k-75k)
Percentage of individuals using paid preparers for their 2020 taxes: 95.0%
Here:
95%
State:
95%
(% for various income ranges: 92.9% for AGIs below $25k, 95.6% for AGIs $25k-50k, 95.1% for AGIs $50k-75k, 94.8% for AGIs $75k-100k, 96.3% for AGIs $100k-200k, 97.8% for AGIs over 200k)
Averages for the 2012 tax year for zip code 11720, filed in 2013:
Average Adjusted Gross Income (AGI) in 2012: $66,409 (Individual Income Tax Returns)
Here:
$66,409
State:
$77,088
Salary/wage: $60,748 (reported on 86.0% of returns)
Here:
$60,748
State:
$60,593
(% of AGI for various income ranges: 75.4% for AGIs below $25k, 78.9% for AGIs $25k-50k, 76.0% for AGIs $50k-75k, 78.1% for AGIs $75k-100k, 82.8% for AGIs $100k-200k, 72.6% for AGIs over 200k)
Taxable interest for individuals: $825 (reported on 49.3% of returns)
This zip code:
$825
New York:
$3,125
(% of AGI for various income ranges: 1.2% for AGIs below $25k, 0.6% for AGIs $25k-50k, 0.8% for AGIs $50k-75k, 0.7% for AGIs $75k-100k, 0.4% for AGIs $100k-200k, 0.6% for AGIs over 200k)
Ordinary dividends: $2,906 (reported on 22.3% of returns)
Here:
$2,906
State:
$10,299
(% of AGI for various income ranges: 1.3% for AGIs below $25k, 1.1% for AGIs $25k-50k, 1.0% for AGIs $50k-75k, 1.0% for AGIs $75k-100k, 0.7% for AGIs $100k-200k, 1.3% for AGIs over 200k)
Net capital gain/loss in AGI: +$5,908 (reported on 14.8% of returns)
Here:
+$5,908
State:
+$42,474
(% of AGI for various income ranges: 0.4% for AGIs $100k-200k, 7.3% for AGIs over 200k)
Profit/loss from business: +$9,565 (reported on 11.3% of returns)
Here:
+$9,565
State:
+$16,168
(% of AGI for various income ranges: 6.2% for AGIs below $25k, 2.7% for AGIs $25k-50k, 1.7% for AGIs $50k-75k, 1.1% for AGIs $75k-100k, 1.1% for AGIs $100k-200k, 1.0% for AGIs over 200k)
Taxable individual retirement arrangement distribution: $15,244 (reported on 9.5% of returns)
11720:
$15,244
New York:
$17,621
(% of AGI for various income ranges: 2.8% for AGIs below $25k, 1.8% for AGIs $25k-50k, 2.5% for AGIs $50k-75k, 2.2% for AGIs $75k-100k, 2.1% for AGIs $100k-200k, 2.1% for AGIs over 200k)
Self-employment retirement plans: $17,725 (reported on 0.3% of returns)
11720:
$17,725
New York:
$27,330
Total itemized deductions: $26,964 (26% of AGI, reported on 50.7% of returns)
Here:
$26,964
State:
$34,985
Here:
25.8% of AGI
State:
21.3% of AGI
(% of AGI for various income ranges: 15.3% for AGIs below $25k, 18.2% for AGIs $25k-50k, 22.1% for AGIs $50k-75k, 24.2% for AGIs $75k-100k, 22.0% for AGIs $100k-200k, 16.3% for AGIs over 200k)
Charity contributions: $2,341 (reported on 45.6% of returns)
Here:
$2,341
State:
$5,572
(% of AGI for various income ranges: 0.8% for AGIs below $25k, 1.2% for AGIs $25k-50k, 1.7% for AGIs $50k-75k, 1.9% for AGIs $75k-100k, 1.8% for AGIs $100k-200k, 1.4% for AGIs over 200k)
Taxes paid: $12,818 (reported on 50.6% of returns)
11720:
$12,818
State:
$18,656
(% of AGI for various income ranges: 5.7% for AGIs below $25k, 7.0% for AGIs $25k-50k, 9.1% for AGIs $50k-75k, 10.7% for AGIs $75k-100k, 10.8% for AGIs $100k-200k, 10.3% for AGIs over 200k)
Earned income credit: $1,912 (reported on 9.8% of returns)
Here:
$1,912
State:
$2,230
(% of AGI for various income ranges: 3.7% for AGIs below $25k, 0.7% for AGIs $25k-50k)
Percentage of individuals using paid preparers for their 2012 taxes: 68.3%
Here:
68%
State:
66%
(% for various income ranges: 61.4% for AGIs below $25k, 65.2% for AGIs $25k-50k, 72.1% for AGIs $50k-75k, 73.4% for AGIs $75k-100k, 75.7% for AGIs $100k-200k, 76.1% for AGIs over 200k)
Averages for the 2004 tax year for zip code 11720, filed in 2005:
Average Adjusted Gross Income (AGI) in 2004: $54,711 (Individual Income Tax Returns)
Here:
$54,711
State:
$59,519
Salary/wage: $51,770 (reported on 88.1% of returns)
Here:
$51,770
State:
$50,673
(% of AGI for various income ranges: 132.2% for AGIs below $10k, 76.6% for AGIs $10k-25k, 82.7% for AGIs $25k-50k, 82.6% for AGIs $50k-75k, 85.9% for AGIs $75k-100k, 82.4% for AGIs over 100k)
Taxable interest for individuals: $921 (reported on 63.8% of returns)
This zip code:
$921
New York:
$2,377
(% of AGI for various income ranges: 5.4% for AGIs below $10k, 2.3% for AGIs $10k-25k, 1.3% for AGIs $25k-50k, 1.1% for AGIs $50k-75k, 0.9% for AGIs $75k-100k, 0.8% for AGIs over 100k)
Taxable dividends: $1,769 (reported on 26.6% of returns)
Here:
$1,769
State:
$5,394
(% of AGI for various income ranges: 3.6% for AGIs below $10k, 1.3% for AGIs $10k-25k, 0.9% for AGIs $25k-50k, 0.9% for AGIs $50k-75k, 0.7% for AGIs $75k-100k, 0.8% for AGIs over 100k)
Net capital gain/loss: +$4,051 (reported on 20.7% of returns)
Here:
+$4,051
State:
+$23,581
(% of AGI for various income ranges: -0.9% for AGIs below $10k, -0.3% for AGIs $10k-25k, -0.1% for AGIs $25k-50k, 0.2% for AGIs $50k-75k, 0.4% for AGIs $75k-100k, 3.6% for AGIs over 100k)
Profit/loss from business: +$9,753 (reported on 11.8% of returns)
Here:
+$9,753
State:
+$13,809
(% of AGI for various income ranges: 9.0% for AGIs below $10k, 5.2% for AGIs $10k-25k, 2.7% for AGIs $25k-50k, 1.8% for AGIs $50k-75k, 1.2% for AGIs $75k-100k, 1.8% for AGIs over 100k)
IRA payment deduction: $3,324 (reported on 3.0% of returns)
11720:
$3,324
New York:
$3,115
(% of AGI for various income ranges: 0.3% for AGIs $10k-25k, 0.3% for AGIs $25k-50k, 0.2% for AGIs $50k-75k, 0.2% for AGIs $75k-100k, 0.1% for AGIs over 100k)
Self-employed pension: $9,949 (reported on 0.4% of returns)
Here:
$9,949
New York:
$19,016
Total itemized deductions: $22,426 (27% of AGI, reported on 53.4% of returns)
Here:
$22,426
State:
$25,864
Here:
27.0% of AGI
State:
21.9% of AGI
(% of AGI for various income ranges: 21.1% for AGIs below $10k, 15.9% for AGIs $10k-25k, 20.5% for AGIs $25k-50k, 24.8% for AGIs $50k-75k, 24.9% for AGIs $75k-100k, 20.4% for AGIs over 100k)
Charity contributions deductions: $2,466 (3% of AGI, reported on 50.2% of returns)
Here:
$2,466
State:
$4,439
Here:
2.9% of AGI
State:
3.6% of AGI
(% of AGI for various income ranges: 0.8% for AGIs below $10k, 1.1% for AGIs $10k-25k, 1.9% for AGIs $25k-50k, 2.4% for AGIs $50k-75k, 2.6% for AGIs $75k-100k, 2.4% for AGIs over 100k)
Total tax: $7,064 (reported on 80.6% of returns)
11720:
$7,064
State:
$11,730
(% of AGI for various income ranges: 3.3% for AGIs below $10k, 4.4% for AGIs $10k-25k, 7.1% for AGIs $25k-50k, 7.8% for AGIs $50k-75k, 8.6% for AGIs $75k-100k, 14.7% for AGIs over 100k)
Earned income credit: $1,373 (reported on 8.3% of returns)
Here:
$1,373
State:
$1,757
Percentage of individuals using paid preparers for their 2004 taxes: 67.2%
Here:
67%
State:
67%
(% for various income ranges: 56.9% for AGIs below $10k, 62.5% for AGIs $10k-25k, 66.9% for AGIs $25k-50k, 72.6% for AGIs $50k-75k, 72.8% for AGIs $75k-100k, 73.8% for AGIs over 100k)
Likely homosexual households (counted as self-reported same-sex unmarried-partner households)
Lesbian couples: 0.3% of all households
Gay men: 0.0% of all households
Household received Food Stamps/SNAP in the past 12 months: 531 Household did not receive Food Stamps/SNAP in the past 12 months: 8,512
Women who had a birth in the past 12 months: 174 (100 now married, 75 unmarried) Women who did not have a birth in the past 12 months: 6,695 (2,750 now married, 3,930 unmarried)
Housing units in zip code 11720 with a mortgage: 4,742 (520 second mortgage, 45 home equity loan, 394 both second mortgage and home equity loan) Houses without a mortgage: 156
Median monthly owner costs for units with a mortgage: $2,762 Median monthly owner costs for units without a mortgage: $1,384
Residents with income below the poverty level in 2022:
This zip code:
5.7%
Whole state:
14.3%
Residents with income below 50% of the poverty level in 2022:
This zip code:
2.3%
Whole state:
6.8%
Median number of rooms in houses and condos:
Here:
6.9
State:
6.3
Median number of rooms in apartments:
Here:
4.4
State:
3.8
Notable locations in this zip code not listed on our city pages
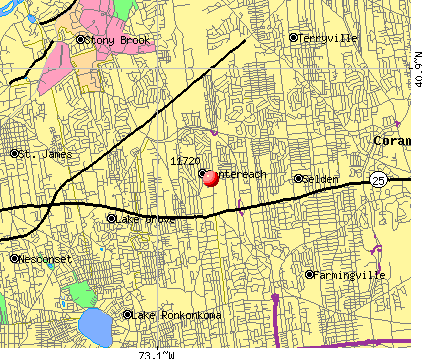
Notable locations in zip code 11720: Middle Country Public Library Centereach (A), Atria South Setauket (B), The Vincent Bove Center at Jefferson Ferry Assisted Living Facility (C), Centereach Fire District (D). Display/hide their locations on the map
Churches in zip code 11720 include: Centereach Church (A), Our Saviour Lutheran Church (B), Assumption Church (C), Faith Community Church of God (D), Centereach Bible Church (E). Display/hide their locations on the map
4,717 married couples with children.
1,120 single-parent households (311 men, 809 women).
81.3% of residents of 11720 zip code speak English at home.
8.0% of residents speak Spanish at home (61% very well, 22% well, 17% not well).
3.9% of residents speak other Indo-European language at home (62% very well, 30% well, 7% not well, 1% not at all).
4.6% of residents speak Asian or Pacific Island language at home (63% very well, 21% well, 11% not well, 5% not at all).
1.8% of residents speak other language at home (83% very well, 11% well, 6% not well).
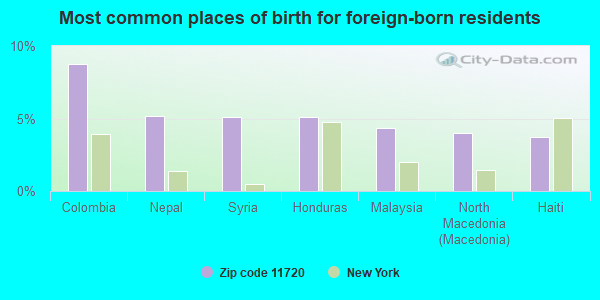
Foreign born population: 4,286 (14.9%) (63.3% of them are naturalized citizens)
This zip code:
14.9%
Whole state:
22.7%
9%Colombia
5%Nepal
5%Syria
5%Honduras
4%Malaysia
4%North Macedonia (Macedonia)
4%Haiti
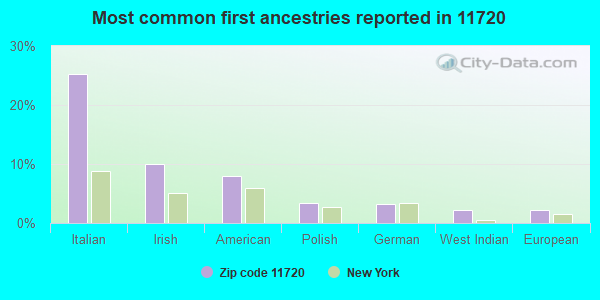
25%Italian
10%Irish
8%American
3%Polish
3%German
2%West Indian
2%European
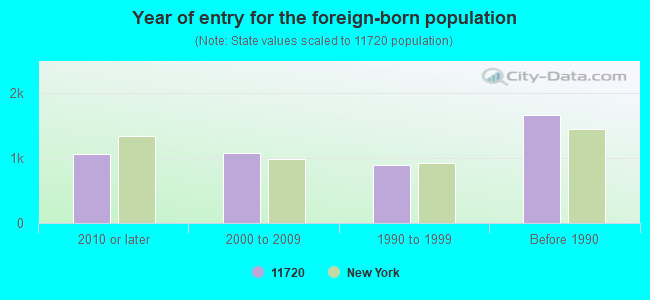
Year of entry for the foreign-born population
1,0642010 or later
1,0802000 to 2009
8961990 to 1999
1,658Before 1990
Major facilities with environmental interests located in this zip code:
HESS STATION #32484 (522 SMITHTOWN BY-PASS in SMITHTOWN, NY)
AIR MINOR (AIRS/AFS) STATE MASTER (New York facility tracking) - AIR PROGRAM Business SIC classification: GASOLINE SERVICE STATIONS Organizations: HESS CORPORATION, AMERADA HESS CORP (LEGALLY RESPONSIBLE PARTY)
CONTINENTAL CAR CARE PROPERTY (1442 MIDDLE COUNTRY RD in CENTEREACH, NY)
STATE MASTER (New York facility tracking) - AIR PROGRAM (Resource Conservation and Recovery Act (tracking hazardous waste)) Alternative names: CONTINENTAL CAR CARE LTD
HOLBROOK ROAD SCHOOL ( in CENTEREACH, NY)
(Geographic Names Information System) (National Center for Education Statistics) - STATE ID-580211060003 Organizations: MIDDLE COUNTRY CSD (SCHOOL DISTRICT)
HALBENS TIRE CITY (105 MARK TREE RD in CENTEREACH, NY)
HAZARDOUS WASTE BIENNIAL REPORTER (Resource Conservation and Recovery Act (tracking hazardous waste)) Large Quantity Generators, more that 1000 kg of hazardous waste/month (Resource Conservation and Recovery Act (tracking hazardous waste)) - notification Organizations: ANJO HOLDLING CORP (CONTACT/OWNER)
IRWIN JOSEPH (1662 MIDDLE COUNTRY RD in CENTEREACH, NY)
HAZARDOUS WASTE BIENNIAL REPORTER (Resource Conservation and Recovery Act (tracking hazardous waste)) (Resource Conservation and Recovery Act (tracking hazardous waste)) Alternative names: SKYLINE LAUNDRY
J & R PHOTO (1723 MIDDLE COUNTRY RD in CENTEREACH, NY)
(Resource Conservation and Recovery Act (tracking hazardous waste)) Organizations: JOSEPH RIZZI (CONTACT/OWNER)
AAMCO TRANSMISSIONS (1759 MIDDLE COUNTRY ROAD in CENTEREACH, NY)
(Resource Conservation and Recovery Act (tracking hazardous waste))
ANGELAS QUALITY DRY CLEANER (2130 MIDDLE COUNTRY RD in CENTEREACH, NY)
(Resource Conservation and Recovery Act (tracking hazardous waste))
GETTY SERVICE STATION (3117 NESCONSET HWY in SOUTH SETAUKET, NY)
(Resource Conservation and Recovery Act (tracking hazardous waste))
GROBENS AUTO BODY (23 HORSEBLOCK RD in CENTEREACH, NY)
Small Quantity Generators, between 100 kg and 1000 kg of hazardous waste/month (Resource Conservation and Recovery Act (tracking hazardous waste)) Business NAICS classification: GENERAL AUTOMOTIVE REPAIR. Organizations: DANNY CARELLA (CONTACT/OWNER)
HOME DEPOT USA INC HD1265 (255 POND PATH in SOUTH SETAUKET, NY)
Small Quantity Generators, between 100 kg and 1000 kg of hazardous waste/month (Resource Conservation and Recovery Act (tracking hazardous waste)) Alternative names: HOME DEPOT THE 1265
HUSTA SERVICE CORP EXXON #9867 (2309 MIDDLE COUNTRY RD in CENTEREACH, NY)
AIR MINOR (AIRS/AFS) Business SIC classification: GASOLINE SERVICE STATIONS
CRESTWOOD AUTO BODY (2 SELDEN BLVD in CENTEREACH, NY)
(Resource Conservation and Recovery Act (tracking hazardous waste))
Housing units lacking complete plumbing facilities: 0.9% Housing units lacking complete kitchen facilities: 1.5%
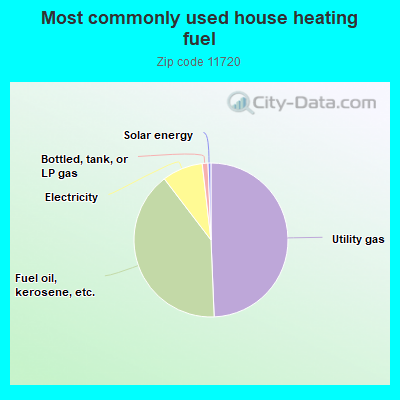
49.0%Utility gas
40.0%Fuel oil, kerosene, etc.
8.5%Electricity
1.2%Bottled, tank, or LP gas
0.6%Solar energy
Population in 1990: 27,519. Population change in the 1990s: +586 (+2.1%).
Place of birth for U.S.-born residents:
This state: 22,039
Northeast: 931
Midwest: 229
South: 475
West: 240
70% of the 11720 zip code residents lived in the same house 5 years ago. Out of people who lived in different houses, 70% lived in this county. Out of people who lived in different counties, 50% lived in New York.
92% of the 11720 zip code residents lived in the same house 1 year ago. Out of people who lived in different houses, 59% moved from this county. Out of people who lived in different houses, 19% moved from different county within same state. Out of people who lived in different houses, 17% moved from different state. Out of people who lived in different houses, 4% moved from abroad.
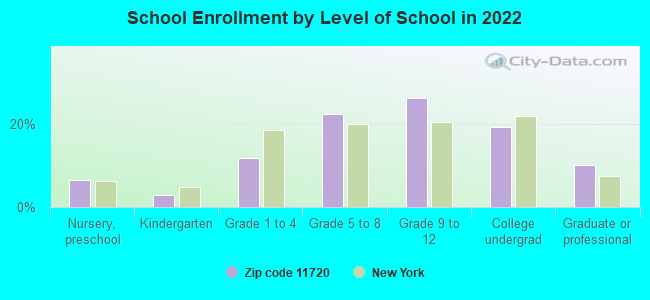
Private vs. public school enrollment:
Students in private schools in grades 1 to 8 (elementary and middle school): 108
Here:
4.0%
New York:
15.6%
Students in private schools in grades 9 to 12 (high school): 24
Here:
1.2%
New York:
15.0%
Students in private undergraduate colleges: 283
Here:
18.7%
New York:
39.2%
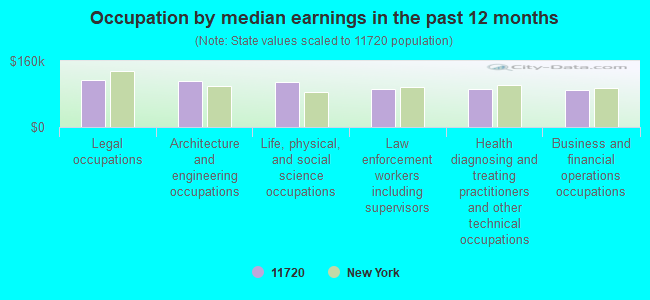
Occupation by median earnings in the past 12 months ($)
113,979Legal occupations
112,192Architecture and engineering occupations
109,683Life, physical, and social science occupations
93,069Law enforcement workers including supervisors
91,656Health diagnosing and treating practitioners and other technical occupations
90,676Business and financial operations occupations
Companies with federal contracts located in this zip code:
RETHER NETWORKS, INC (99 MARK TREE RD, STE-301 in CENTEREACH, NY; small business) : $519,906 in 5 contractsfrom 2002 to 2006
Contracts for Other Research and Development -- Basic Research (R&D), Defense Missile and Space Systems -- Advanced Development (R&D), Defense Electronics and Communication Equipment -- Management and Support (R&D), Defense Missile and Space Systems -- Basic Research (R&D) by Navy, Army, Air Force, Missile Defense Agency, and others Signed by year:2000: $0; 2001: $0; 2002: $219,927; 2003: $99,995; 2004: $0; 2005: $99,996; 2006: $99,988.
Biggest contracts:
$149,927 with Navy for Other Research and Development -- Basic Research (R&D). Signed on 2002-12-04. Completion date: 2003-09-30.
$99,996 with Army for Defense Missile and Space Systems -- Advanced Development (R&D). Signed on 2005-02-15. Completion date: 2005-02-14.
$99,995 with Air Force for Defense Electronics and Communication Equipment -- Management and Support (R&D). Signed on 2003-07-28. Completion date: 2004-01-30.
$99,988 with Missile Defense Agency for Defense Missile and Space Systems -- Basic Research (R&D). Signed on 2006-04-21. Completion date: 2006-10-20.
BLOUNT CONTRACTING, INC (56 PLEASANT AVE in CENTEREACH, NY; small business) : $240,791 in 12 contractsfrom 2004 to 2005
Contracts for Maintenance, Repair or Alteration of Real Property -- Miscellaneous Buildings, Maintenance, Repair or Alteration of Real Property -- Family Housing Facilities by Navy Signed by year:2000: $0; 2001: $0; 2002: $0; 2003: $0; 2004: $82,980; 2005: $157,811; 2006: $0.
Biggest contracts:
$24,650 with Navy for Maintenance, Repair or Alteration of Real Property -- Miscellaneous Buildings. Signed on 2004-04-15. Completion date: 2004-04-30.
$24,570 with Navy for Maintenance, Repair or Alteration of Real Property -- Family Housing Facilities. Signed on 2004-09-16. Completion date: 2004-10-30.
$24,549 with Navy for Maintenance, Repair or Alteration of Real Property -- Miscellaneous Buildings. Signed on 2005-08-05. Completion date: 2005-08-31.
$24,340, same as above.Signed on 2005-04-12. Completion date: 2005-04-25.
TELNET LABS, INC (406 TREE RD in CENTEREACH, NY; small business)
$24,455 with Army for Telephone and Telegraph Equipment. Signed on 2004-09-03. Completion date: 2004-09-15.
Top industries in this zip code by the number of employees in 2005:
2002 - 2018 National Fire Incident Reporting System (NFIRS) incidents
According to the data from the years 2002 - 2018 the average number of fire incidents per year is 18. The highest number of reported fire incidents - 43 took place in 2015, and the least - 0 in 2005. The data has a rising trend.
When looking into fire subcategories, the most reports belonged to: Structure Fires (61.7%), and Outside Fires (28.7%).
Fire incident types reported to NFIRS in Zip Code 11720


 Nearest zip codes: 11755, 11784, 11738, 11776, 11790, 11794.


 According to the data from the years 2002 - 2018 the average number of fire incidents per year is 18. The highest number of reported fire incidents - 43 took place in 2015, and the least - 0 in 2005. The data has a rising trend.
 When looking into fire subcategories, the most reports belonged to: Structure Fires (61.7%), and Outside Fires (28.7%).