Estimated zip code population in 2022: 4,253 Zip code population in 2010: 3,326 Zip code population in 2000: 3,851
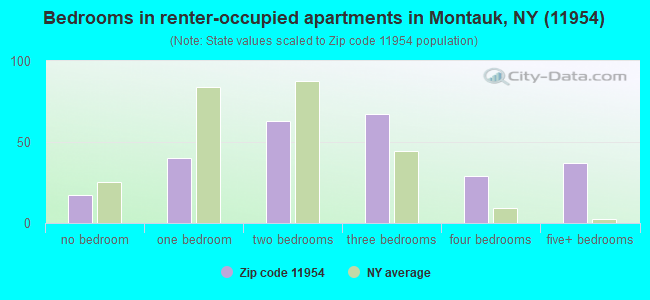
Houses and condos: 4,521 Renter-occupied apartments: 258
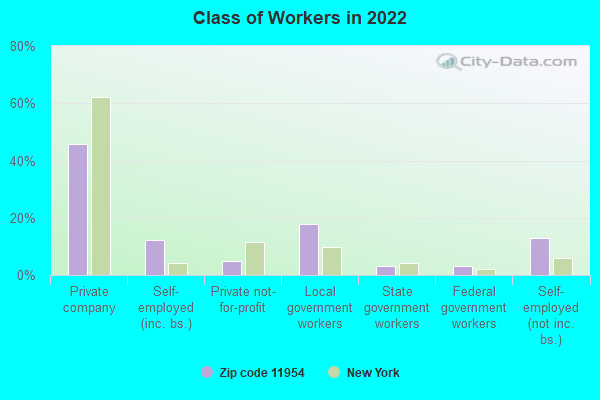
% of renters here:
16%
State:
46%
March 2022 cost of living index in zip code 11954: 156.5 (very high, U.S. average is 100)
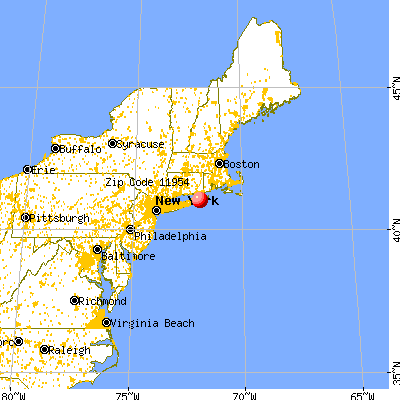
Land area: 18.5 sq. mi. Water area: 17.3 sq. mi.
Population density: 230 people per square mile
(very low).
OSM Map
General Map
Google Map
MSN Map
OSM Map
General Map
Google Map
MSN Map
OSM Map
General Map
Google Map
MSN Map
OSM Map
General Map
Google Map
MSN Map
Please wait while loading the map...
Real estate property taxes paid for housing units in 2022:
This zip code:
0.6% ($6,385)
New York:
1.5% ($6,180)
Median real estate property taxes paid for housing units with mortgages in 2022: $6,364 (0.5%) Median real estate property taxes paid for housing units with no mortgage in 2022: $6,385 (0.6%)
Business Search- 14 Million verified businesses
Males: 2,270
(53.4%)
Females: 1,983
(46.6%)
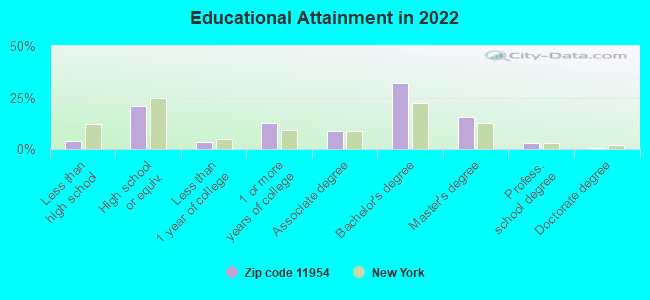
For population 25 years and over in 11954:
High school or higher: 96.1%
Bachelor's degree or higher: 50.9%
Graduate or professional degree: 18.9%
Unemployed: 4.6%
Mean travel time to work (commute): 26.6 minutes
For population 15 years and over in 11954:
Never married: 34.8%
Now married: 52.0%
Separated: 0.9%
Widowed: 4.5%
Divorced: 7.9%
Zip code 11954 compared to state average:
Median household income above state average.
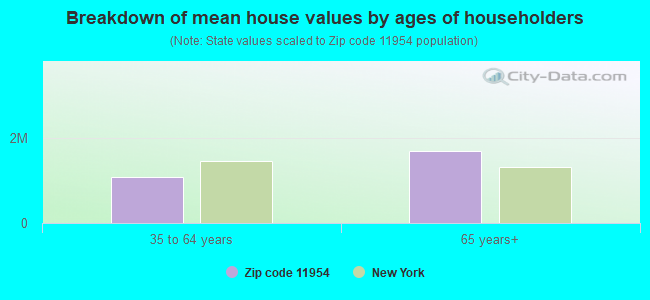
Median house value significantly above state average.
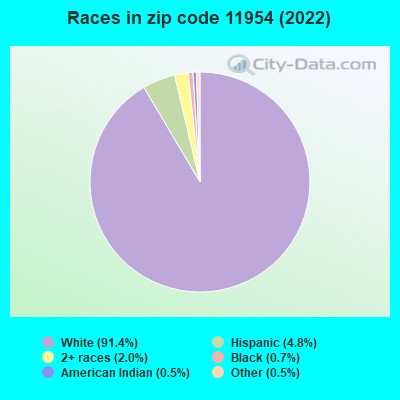
Black race population percentage significantly below state average.
Hispanic race population percentage significantly below state average.
Median age significantly above state average.
Foreign-born population percentage significantly below state average.
Renting percentage significantly below state average.
Length of stay since moving in above state average.
House age below state average.
Number of college students significantly below state average.
Estimated median house/condo value in 2022: $1,117,180
11954:
$1,117,180
New York:
$400,400
According to our research of New York and other state lists, there were 3 registered sex offenders living in 11954 zip code as of April 27, 2024. The ratio of all residents to sex offenders in zip code 11954 is 1,187 to 1. The ratio of registered sex offenders to all residents in this zip code is lower than the state average.
Median resident age:
This zip code:
50.3 years
New York median age:
40.0 years
Average household size:
This zip code:
2.6 people
New York:
2.5 people
Averages for the 2020 tax year for zip code 11954, filed in 2021:
Average Adjusted Gross Income (AGI) in 2020: $229,034 (Individual Income Tax Returns)
Here:
$229,034
State:
$90,930
Salary/wage: $114,533 (reported on 73.3% of returns)
Here:
$114,533
State:
$72,104
(% of AGI for various income ranges: 1312.1% for AGIs below $25k, 3546.0% for AGIs $25k-50k, 6634.3% for AGIs $50k-75k, 10187.3% for AGIs $75k-100k, 20011.2% for AGIs $100k-200k, 250363.3% for AGIs over 200k)
Taxable interest for individuals: $4,927 (reported on 40.3% of returns)
This zip code:
$4,927
New York:
$3,075
(% of AGI for various income ranges: 51.8% for AGIs below $25k, 62.3% for AGIs $25k-50k, 122.6% for AGIs $50k-75k, 226.4% for AGIs $75k-100k, 513.1% for AGIs $100k-200k, 5996.7% for AGIs over 200k)
Ordinary dividends: $12,560 (reported on 31.9% of returns)
Here:
$12,560
State:
$11,095
(% of AGI for various income ranges: 113.6% for AGIs below $25k, 121.4% for AGIs $25k-50k, 184.3% for AGIs $50k-75k, 787.3% for AGIs $75k-100k, 1284.4% for AGIs $100k-200k, 11028.3% for AGIs over 200k)
Net capital gain/loss in AGI: +$81,343 (reported on 30.0% of returns)
Here:
+$81,343
State:
+$44,925
(% of AGI for various income ranges: 30.5% for AGIs below $25k, 99.5% for AGIs $25k-50k, 139.6% for AGIs $50k-75k, 484.5% for AGIs $75k-100k, 1255.6% for AGIs $100k-200k, 105485.0% for AGIs over 200k)
Profit/loss from business: +$29,673 (reported on 22.7% of returns)
Here:
+$29,673
State:
+$14,940
(% of AGI for various income ranges: 446.7% for AGIs below $25k, 396.3% for AGIs $25k-50k, 669.6% for AGIs $50k-75k, 980.9% for AGIs $75k-100k, 1770.0% for AGIs $100k-200k, 15833.3% for AGIs over 200k)
Taxable individual retirement arrangement distribution: $26,044 (reported on 9.9% of returns)
11954:
$26,044
New York:
$19,609
(% of AGI for various income ranges: 71.3% for AGIs below $25k, 82.6% for AGIs $25k-50k, 227.8% for AGIs $50k-75k, 640.0% for AGIs $75k-100k, 1518.8% for AGIs $100k-200k, 4568.3% for AGIs over 200k)
Self-employed (Keogh) retirement plans: $27,150 (reported on 1.5% of returns)
11954:
$27,150
New York:
$32,497
(% of AGI for various income ranges: 1810.0% for AGIs over 200k)
Total itemized deductions: $36,581 (reported on 19.0% of returns)
Here:
$36,581
State:
$39,326
(% of AGI for various income ranges: 181.0% for AGIs below $25k, 244.0% for AGIs $25k-50k, 592.2% for AGIs $50k-75k, 1614.5% for AGIs $75k-100k, 2526.9% for AGIs $100k-200k, 16810.0% for AGIs over 200k)
Charity contributions: $8,059 (reported on 16.1% of returns)
Here:
$8,059
State:
$15,420
(% of AGI for various income ranges: 34.9% for AGIs $25k-50k, 60.9% for AGIs $50k-75k, 134.5% for AGIs $75k-100k, 254.4% for AGIs $100k-200k, 4501.7% for AGIs over 200k)
Taxes paid: $9,148 (reported on 19.0% of returns)
11954:
$9,148
State:
$9,183
(% of AGI for various income ranges: 48.7% for AGIs below $25k, 79.3% for AGIs $25k-50k, 148.3% for AGIs $50k-75k, 381.8% for AGIs $75k-100k, 804.4% for AGIs $100k-200k, 3630.0% for AGIs over 200k)
Earned income credit: $1,581 (reported on 9.5% of returns)
Here:
$1,581
State:
$2,138
(% of AGI for various income ranges: 64.1% for AGIs below $25k, 37.4% for AGIs $25k-50k)
Percentage of individuals using paid preparers for their 2020 taxes: 92.7%
Here:
93%
State:
95%
(% for various income ranges: 87.8% for AGIs below $25k, 92.2% for AGIs $25k-50k, 94.9% for AGIs $50k-75k, 95.2% for AGIs $75k-100k, 97.6% for AGIs $100k-200k, 94.1% for AGIs over 200k)
Averages for the 2012 tax year for zip code 11954, filed in 2013:
Average Adjusted Gross Income (AGI) in 2012: $73,023 (Individual Income Tax Returns)
Here:
$73,023
State:
$77,088
Salary/wage: $44,445 (reported on 75.7% of returns)
Here:
$44,445
State:
$60,593
(% of AGI for various income ranges: 68.5% for AGIs below $25k, 71.4% for AGIs $25k-50k, 58.2% for AGIs $50k-75k, 53.7% for AGIs $75k-100k, 49.1% for AGIs $100k-200k, 29.7% for AGIs over 200k)
Taxable interest for individuals: $2,856 (reported on 40.1% of returns)
This zip code:
$2,856
New York:
$3,125
(% of AGI for various income ranges: 1.8% for AGIs below $25k, 0.7% for AGIs $25k-50k, 1.9% for AGIs $50k-75k, 1.0% for AGIs $75k-100k, 1.9% for AGIs $100k-200k, 1.6% for AGIs over 200k)
Ordinary dividends: $8,357 (reported on 27.6% of returns)
Here:
$8,357
State:
$10,299
(% of AGI for various income ranges: 2.6% for AGIs below $25k, 1.8% for AGIs $25k-50k, 2.7% for AGIs $50k-75k, 2.9% for AGIs $75k-100k, 3.7% for AGIs $100k-200k, 3.5% for AGIs over 200k)
Net capital gain/loss in AGI: +$39,666 (reported on 25.0% of returns)
Here:
+$39,666
State:
+$42,474
(% of AGI for various income ranges: 2.6% for AGIs $100k-200k, 30.8% for AGIs over 200k)
Profit/loss from business: +$24,557 (reported on 23.2% of returns)
Here:
+$24,557
State:
+$16,168
(% of AGI for various income ranges: 12.5% for AGIs below $25k, 9.0% for AGIs $25k-50k, 8.4% for AGIs $50k-75k, 6.4% for AGIs $75k-100k, 6.5% for AGIs $100k-200k, 7.4% for AGIs over 200k)
Taxable individual retirement arrangement distribution: $19,461 (reported on 12.1% of returns)
11954:
$19,461
New York:
$17,621
(% of AGI for various income ranges: 2.3% for AGIs below $25k, 2.0% for AGIs $25k-50k, 3.1% for AGIs $50k-75k, 3.8% for AGIs $75k-100k, 5.6% for AGIs $100k-200k, 2.5% for AGIs over 200k)
Self-employment retirement plans: $23,675 (reported on 1.5% of returns)
11954:
$23,675
New York:
$27,330
Total itemized deductions: $30,991 (22% of AGI, reported on 39.3% of returns)
Here:
$30,991
State:
$34,985
Here:
21.7% of AGI
State:
21.3% of AGI
(% of AGI for various income ranges: 16.6% for AGIs below $25k, 17.3% for AGIs $25k-50k, 19.5% for AGIs $50k-75k, 19.8% for AGIs $75k-100k, 22.5% for AGIs $100k-200k, 12.5% for AGIs over 200k)
Charity contributions: $2,886 (reported on 34.2% of returns)
Here:
$2,886
State:
$5,572
(% of AGI for various income ranges: 0.7% for AGIs below $25k, 1.3% for AGIs $25k-50k, 1.8% for AGIs $50k-75k, 1.6% for AGIs $75k-100k, 1.9% for AGIs $100k-200k, 1.1% for AGIs over 200k)
Taxes paid: $14,319 (reported on 39.3% of returns)
11954:
$14,319
State:
$18,656
(% of AGI for various income ranges: 4.9% for AGIs below $25k, 4.8% for AGIs $25k-50k, 7.0% for AGIs $50k-75k, 7.9% for AGIs $75k-100k, 9.7% for AGIs $100k-200k, 8.1% for AGIs over 200k)
Earned income credit: $1,917 (reported on 15.1% of returns)
Here:
$1,917
State:
$2,230
(% of AGI for various income ranges: 4.7% for AGIs below $25k, 0.6% for AGIs $25k-50k)
Percentage of individuals using paid preparers for their 2012 taxes: 72.4%
Here:
72%
State:
66%
(% for various income ranges: 66.4% for AGIs below $25k, 65.7% for AGIs $25k-50k, 75.0% for AGIs $50k-75k, 78.9% for AGIs $75k-100k, 90.0% for AGIs $100k-200k, 100.0% for AGIs over 200k)
Averages for the 2004 tax year for zip code 11954, filed in 2005:
Average Adjusted Gross Income (AGI) in 2004: $51,405 (Individual Income Tax Returns)
Here:
$51,405
State:
$59,519
Salary/wage: $36,932 (reported on 74.6% of returns)
Here:
$36,932
State:
$50,673
(% of AGI for various income ranges: 115.4% for AGIs below $10k, 71.3% for AGIs $10k-25k, 68.3% for AGIs $25k-50k, 58.2% for AGIs $50k-75k, 53.1% for AGIs $75k-100k, 42.5% for AGIs over 100k)
Taxable interest for individuals: $2,783 (reported on 51.1% of returns)
This zip code:
$2,783
New York:
$2,377
(% of AGI for various income ranges: 9.1% for AGIs below $10k, 2.2% for AGIs $10k-25k, 2.0% for AGIs $25k-50k, 3.1% for AGIs $50k-75k, 2.7% for AGIs $75k-100k, 2.9% for AGIs over 100k)
Taxable dividends: $4,294 (reported on 32.6% of returns)
Here:
$4,294
State:
$5,394
(% of AGI for various income ranges: 10.8% for AGIs below $10k, 2.1% for AGIs $10k-25k, 2.1% for AGIs $25k-50k, 2.6% for AGIs $50k-75k, 2.9% for AGIs $75k-100k, 2.8% for AGIs over 100k)
Net capital gain/loss: +$20,030 (reported on 28.0% of returns)
Here:
+$20,030
State:
+$23,581
(% of AGI for various income ranges: -7.9% for AGIs below $10k, -0.2% for AGIs $10k-25k, 0.3% for AGIs $25k-50k, 1.9% for AGIs $50k-75k, 1.7% for AGIs $75k-100k, 21.7% for AGIs over 100k)
Profit/loss from business: +$19,202 (reported on 22.3% of returns)
Here:
+$19,202
State:
+$13,809
(% of AGI for various income ranges: 18.3% for AGIs below $10k, 12.5% for AGIs $10k-25k, 10.8% for AGIs $25k-50k, 6.9% for AGIs $50k-75k, 5.2% for AGIs $75k-100k, 7.6% for AGIs over 100k)
IRA payment deduction: $3,704 (reported on 5.1% of returns)
11954:
$3,704
New York:
$3,115
(% of AGI for various income ranges: 0.6% for AGIs $10k-25k, 0.5% for AGIs $25k-50k, 0.7% for AGIs $50k-75k, 0.6% for AGIs $75k-100k, 0.2% for AGIs over 100k)
Self-employed pension: $21,290 (reported on 1.2% of returns)
Here:
$21,290
New York:
$19,016
Total itemized deductions: $23,663 (25% of AGI, reported on 42.3% of returns)
Here:
$23,663
State:
$25,864
Here:
25.1% of AGI
State:
21.9% of AGI
(% of AGI for various income ranges: 25.4% for AGIs below $10k, 16.6% for AGIs $10k-25k, 21.6% for AGIs $25k-50k, 23.2% for AGIs $50k-75k, 21.6% for AGIs $75k-100k, 17.6% for AGIs over 100k)
Charity contributions deductions: $3,497 (4% of AGI, reported on 38.7% of returns)
Here:
$3,497
State:
$4,439
Here:
3.5% of AGI
State:
3.6% of AGI
(% of AGI for various income ranges: 1.7% for AGIs below $10k, 1.5% for AGIs $10k-25k, 2.0% for AGIs $25k-50k, 2.3% for AGIs $50k-75k, 2.9% for AGIs $75k-100k, 3.1% for AGIs over 100k)
Total tax: $9,021 (reported on 77.6% of returns)
11954:
$9,021
State:
$11,730
(% of AGI for various income ranges: 5.0% for AGIs below $10k, 5.4% for AGIs $10k-25k, 7.6% for AGIs $25k-50k, 9.9% for AGIs $50k-75k, 10.9% for AGIs $75k-100k, 19.0% for AGIs over 100k)
Earned income credit: $1,127 (reported on 14.9% of returns)
Here:
$1,127
State:
$1,757
Percentage of individuals using paid preparers for their 2004 taxes: 73.1%
Here:
73%
State:
67%
(% for various income ranges: 63.9% for AGIs below $10k, 68.2% for AGIs $10k-25k, 70.9% for AGIs $25k-50k, 85.0% for AGIs $50k-75k, 82.7% for AGIs $75k-100k, 90.5% for AGIs over 100k)
Household received Food Stamps/SNAP in the past 12 months: 95 Household did not receive Food Stamps/SNAP in the past 12 months: 1,500
Women who had a birth in the past 12 months: 70 (57 now married, 12 unmarried) Women who did not have a birth in the past 12 months: 640 (197 now married, 444 unmarried)
Housing units in zip code 11954 with a mortgage: 610 (97 second mortgage, 96 both second mortgage and home equity loan) Median monthly owner costs for units with a mortgage: $3,547 Median monthly owner costs for units without a mortgage: $1,150
Residents with income below the poverty level in 2022:
This zip code:
3.0%
Whole state:
14.3%
Residents with income below 50% of the poverty level in 2022:
This zip code:
1.5%
Whole state:
6.8%
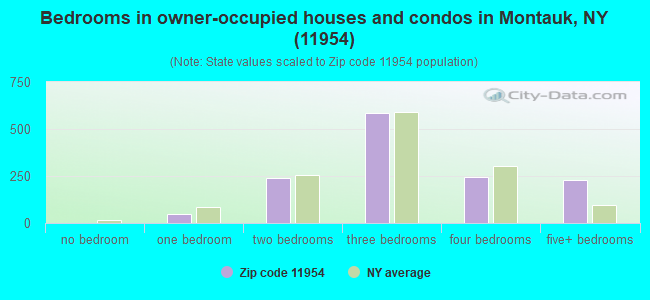
Median number of rooms in houses and condos:
Here:
5.7
State:
6.3
Median number of rooms in apartments:
Here:
4.7
State:
3.8
Notable locations in this zip code not listed on our city pages
Notable locations in zip code 11954: Easthampton Gun Club (A), Amagansett Gun Club (B), Quincetree Landing (C), Montauk Yacht Club Light (D), Montauk Yacht Club (E), Montauk Gun Club (F), Montauk Downs State Park Golf Course (G), Montauk Tennis Auditorium (H), Montauk Manor (I), Montauk Library (J), Montauk Fire Department (K), Montauk Point Lighthouse (L). Display/hide their locations on the map
Lakes: Little Reed Pond (A), Money Pond (B), Lake Montauk (C), Oyster Pond (D), Big Reed Pond (E), Fort Pond (F), Fresh Pond (G). Display/hide their locations on the map
Parks in zip code 11954 include: Hither Hills State Park (1), Camp Hero State Park (2), Hither Woods Preserve (3), Lee Koppelman Nature Preserve (4), Montauk County Park (5), Montauk Downs State Park (6), Montauk Point State Park (7). Display/hide their locations on the map
In group quarters: 128 (-1 institutionalized population)
Size of family households: 522 2-persons, 259 3-persons, 186 4-persons, 21 5-persons, 79 6-persons, 24 7-or-more-persons
Size of nonfamily households: 428 1-person, 89 2-persons
483 married couples with children.
147 single-parent households (82 men, 65 women).
91.2% of residents of 11954 zip code speak English at home.
3.3% of residents speak Spanish at home (61% very well, 31% well, 8% not well).
5.2% of residents speak other Indo-European language at home (50% very well, 50% well).
0.4% of residents speak Asian or Pacific Island language at home (100% well).
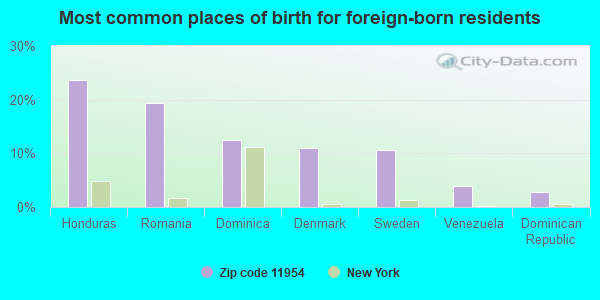
Foreign born population: 329 (7.8%) (62.8% of them are naturalized citizens)
This zip code:
7.8%
Whole state:
22.7%
24%Honduras
19%Romania
12%Dominica
11%Denmark
11%Sweden
4%Venezuela
3%Dominican Republic
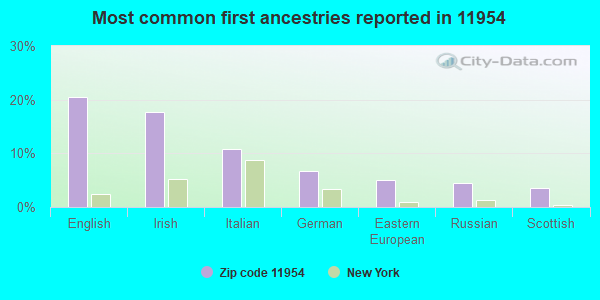
21%English
18%Irish
11%Italian
7%German
5%Eastern European
4%Russian
3%Scottish
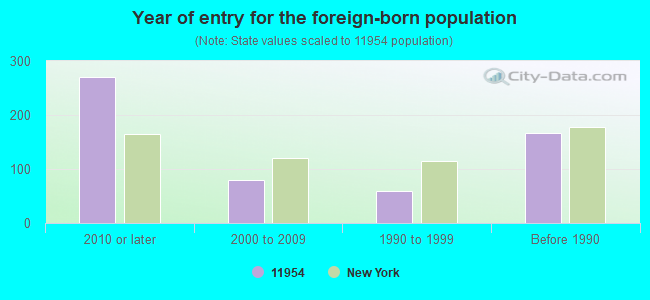
Year of entry for the foreign-born population
2712010 or later
792000 to 2009
591990 to 1999
166Before 1990
Facilities with environmental interests located in this zip code:
GETTY SERVICE STATION (MONTAUK HWY & S EMERY ST in MONTAUK, NY)
(Resource Conservation and Recovery Act (tracking hazardous waste))
GONE FISHING MARINE SUPPLY CORP (467 E LAKE DR in MONTAUK, NY)
Small Quantity Generators, between 100 kg and 1000 kg of hazardous waste/month (Resource Conservation and Recovery Act (tracking hazardous waste)) Organizations: GONE FISHING MARINA (CONTACT/OPERATOR)
, SENNEFELDER PROPERTIES INC (CONTACT/OWNER)
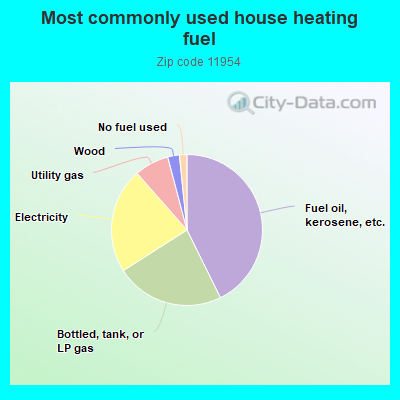
42.8%Fuel oil, kerosene, etc.
23.3%Bottled, tank, or LP gas
22.6%Electricity
7.4%Utility gas
2.5%Wood
1.6%No fuel used
Population in 1990: 3,008. Population change in the 1990s: +843 (+28.0%).
Place of birth for U.S.-born residents:
This state: 2,607
Northeast: 490
Midwest: 108
South: 305
West: 189
64% of the 11954 zip code residents lived in the same house 5 years ago. Out of people who lived in different houses, 71% lived in this county. Out of people who lived in different counties, 50% lived in New York.
95% of the 11954 zip code residents lived in the same house 1 year ago. Out of people who lived in different houses, 61% moved from this county. Out of people who lived in different houses, 36% moved from different county within same state.
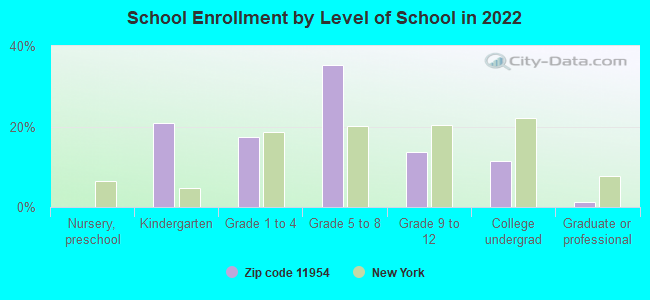
Private vs. public school enrollment:
Students in private schools in grades 1 to 8 (elementary and middle school): 43
Here:
14.6%
New York:
15.6%
Students in private schools in grades 9 to 12 (high school): 27
Here:
35.8%
New York:
15.0%
Students in private undergraduate colleges: 43
Here:
66.0%
New York:
39.2%
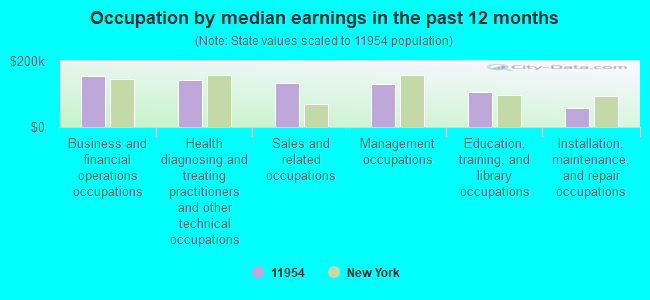
Occupation by median earnings in the past 12 months ($)
153,426Business and financial operations occupations
143,666Health diagnosing and treating practitioners and other technical occupations
134,250Sales and related occupations
129,353Management occupations
104,994Education, training, and library occupations
56,192Installation, maintenance, and repair occupations
Companies with federal contracts located in this zip code:
DEEP HOLLOW RANCH (OLD MONTAUK HWY in MONTAUK, NY; small business)
$3,840 with Army for Military Personnel Recruitment. Signed on 2003-09-09. Completion date: 2003-09-17.
Top industries in this zip code by the number of employees in 2005:
Administrative and Support and Waste Management and Remediation Services: Landscaping Services (20-49: 1, 10-19: 2, 5-9: 2, 1-4: 5)
Other Services (except Public Administration): Other Similar Organizations (except Business, Professional, Labor, and Political Organizations) (20-49: 1, 5-9: 1, 1-4: 6)
Arts, Entertainment, and Recreation: Marinas (10-19: 2, 1-4: 4)
Administrative and Support and Waste Management and Remediation Services: Solid Waste Collection (20-49: 1)
Finance and Insurance: Commercial Banking (5-9: 3, 1-4: 1)
Construction: Plumbing, Heating, and Air-Conditioning Contractors (10-19: 1, 1-4: 4)
People in group quarters in 2010:
50 people in workers' group living quarters and job corps centers
6 people in military barracks and dormitories (nondisciplinary)
People in group quarters in 2000:
11 people in military barracks, etc.
Fatal accident statistics in 2013:
Fatal accident count: 1
Vehicles involved in fatal accidents: 1
Fatal accidents caused by drunken drivers: 0
Fatalities: 1
Persons involved in fatal accidents: 1
Pedestrians involved in fatal accidents: 2
Fatal accident statistics in 2012:
Fatal accident count: 1
Vehicles involved in fatal accidents: 2
Fatal accidents caused by drunken drivers: 0
Fatalities: 1
Persons involved in fatal accidents: 3
Pedestrians involved in fatal accidents: 0
Home Mortgage Disclosure Act Aggregated Statistics For Year 2009 (Based on 2 full tracts)
A) FHA, FSA/RHS & VA Home Purchase Loans
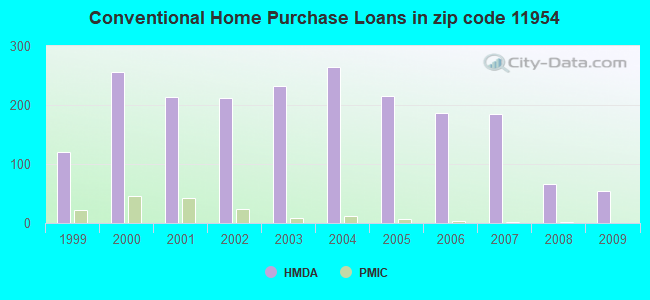
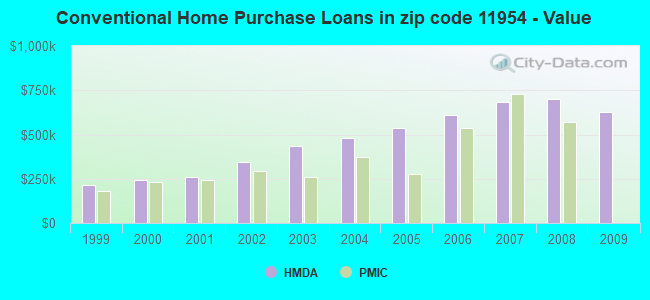
B) Conventional Home Purchase Loans
C) Refinancings
D) Home Improvement Loans
E) Loans on Dwellings For 5+ Families
F) Non-occupant Loans on < 5 Family Dwellings (A B C & D)
G) Loans On Manufactured Home Dwelling (A B C & D)
Number
Average Value
Number
Average Value
Number
Average Value
Number
Average Value
Number
Average Value
Number
Average Value
Number
Average Value
LOANS ORIGINATED
2
$537,000
54
$625,222
216
$416,324
12
$239,167
4
$1,750,000
138
$440,768
0
$0
APPLICATIONS APPROVED, NOT ACCEPTED
0
$0
10
$480,200
34
$433,706
2
$20,000
0
$0
24
$522,500
0
$0
APPLICATIONS DENIED
0
$0
22
$453,182
120
$404,650
6
$150,000
0
$0
72
$445,583
4
$115,000
APPLICATIONS WITHDRAWN
2
$424,000
8
$578,000
48
$393,542
4
$532,500
0
$0
26
$484,846
0
$0
FILES CLOSED FOR INCOMPLETENESS
0
$0
4
$862,500
32
$290,812
8
$711,250
0
$0
20
$375,700
0
$0
Aggregated Statistics For Year 2008 (Based on 2 full tracts)
A) FHA, FSA/RHS & VA Home Purchase Loans
B) Conventional Home Purchase Loans
C) Refinancings
D) Home Improvement Loans
F) Non-occupant Loans on < 5 Family Dwellings (A B C & D)
G) Loans On Manufactured Home Dwelling (A B C & D)
Number
Average Value
Number
Average Value
Number
Average Value
Number
Average Value
Number
Average Value
Number
Average Value
LOANS ORIGINATED
0
$0
66
$697,818
128
$471,188
20
$304,400
112
$541,071
0
$0
APPLICATIONS APPROVED, NOT ACCEPTED
0
$0
30
$745,600
28
$210,214
2
$50,000
24
$642,833
2
$35,000
APPLICATIONS DENIED
2
$743,000
36
$920,556
88
$509,886
12
$306,667
68
$627,588
0
$0
APPLICATIONS WITHDRAWN
2
$391,000
12
$650,000
18
$1,058,333
0
$0
12
$1,712,333
0
$0
FILES CLOSED FOR INCOMPLETENESS
0
$0
2
$2,180,000
12
$752,833
0
$0
8
$1,125,500
0
$0
Aggregated Statistics For Year 2007 (Based on 2 full tracts)
B) Conventional Home Purchase Loans
C) Refinancings
D) Home Improvement Loans
F) Non-occupant Loans on < 5 Family Dwellings (A B C & D)
G) Loans On Manufactured Home Dwelling (A B C & D)
Number
Average Value
Number
Average Value
Number
Average Value
Number
Average Value
Number
Average Value
LOANS ORIGINATED
184
$686,413
214
$487,028
30
$325,733
198
$685,323
0
$0
APPLICATIONS APPROVED, NOT ACCEPTED
46
$588,435
52
$431,654
2
$260,000
56
$561,964
2
$150,000
APPLICATIONS DENIED
70
$470,657
104
$475,019
12
$386,167
80
$450,500
0
$0
APPLICATIONS WITHDRAWN
16
$553,875
48
$730,750
8
$159,250
26
$994,615
0
$0
FILES CLOSED FOR INCOMPLETENESS
10
$562,000
20
$323,800
2
$529,000
10
$575,000
0
$0
Aggregated Statistics For Year 2006 (Based on 2 full tracts)
B) Conventional Home Purchase Loans
C) Refinancings
D) Home Improvement Loans
F) Non-occupant Loans on < 5 Family Dwellings (A B C & D)
Number
Average Value
Number
Average Value
Number
Average Value
Number
Average Value
LOANS ORIGINATED
186
$612,828
250
$462,952
52
$467,346
194
$640,567
APPLICATIONS APPROVED, NOT ACCEPTED
34
$488,882
44
$413,409
6
$348,000
28
$412,571
APPLICATIONS DENIED
52
$424,577
90
$570,111
12
$143,333
44
$696,318
APPLICATIONS WITHDRAWN
20
$424,700
62
$625,935
4
$364,000
16
$580,000
FILES CLOSED FOR INCOMPLETENESS
10
$491,200
48
$351,083
4
$218,500
14
$459,571
Aggregated Statistics For Year 2005 (Based on 2 full tracts)
B) Conventional Home Purchase Loans
C) Refinancings
D) Home Improvement Loans
F) Non-occupant Loans on < 5 Family Dwellings (A B C & D)
Number
Average Value
Number
Average Value
Number
Average Value
Number
Average Value
LOANS ORIGINATED
216
$536,565
292
$438,411
36
$345,944
216
$549,194
APPLICATIONS APPROVED, NOT ACCEPTED
44
$683,864
54
$379,185
6
$320,667
58
$594,310
APPLICATIONS DENIED
60
$485,167
106
$405,302
20
$240,500
70
$368,886
APPLICATIONS WITHDRAWN
38
$766,526
82
$487,976
10
$93,000
38
$921,737
FILES CLOSED FOR INCOMPLETENESS
18
$535,333
40
$292,500
0
$0
12
$519,000
Aggregated Statistics For Year 2004 (Based on 2 full tracts)
B) Conventional Home Purchase Loans
C) Refinancings
D) Home Improvement Loans
E) Loans on Dwellings For 5+ Families
F) Non-occupant Loans on < 5 Family Dwellings (A B C & D)
Number
Average Value
Number
Average Value
Number
Average Value
Number
Average Value
Number
Average Value
LOANS ORIGINATED
264
$482,742
308
$346,409
44
$234,682
2
$2,500,000
256
$431,438
APPLICATIONS APPROVED, NOT ACCEPTED
36
$378,056
84
$270,786
12
$162,667
0
$0
36
$365,611
APPLICATIONS DENIED
40
$432,600
136
$401,500
30
$132,133
0
$0
58
$383,966
APPLICATIONS WITHDRAWN
30
$640,667
82
$342,000
6
$136,333
2
$600,000
32
$673,812
FILES CLOSED FOR INCOMPLETENESS
8
$294,250
44
$317,500
8
$792,500
0
$0
8
$917,250
Aggregated Statistics For Year 2003 (Based on 2 full tracts)
B) Conventional Home Purchase Loans
C) Refinancings
D) Home Improvement Loans
E) Loans on Dwellings For 5+ Families
F) Non-occupant Loans on < 5 Family Dwellings (A B C & D)
Number
Average Value
Number
Average Value
Number
Average Value
Number
Average Value
Number
Average Value
LOANS ORIGINATED
232
$437,483
750
$264,283
16
$58,500
0
$0
414
$317,942
APPLICATIONS APPROVED, NOT ACCEPTED
54
$347,630
118
$241,746
6
$40,000
0
$0
58
$275,138
APPLICATIONS DENIED
52
$388,115
208
$367,635
14
$86,286
0
$0
68
$350,882
APPLICATIONS WITHDRAWN
20
$496,100
138
$304,638
6
$81,667
2
$2,500,000
30
$354,200
FILES CLOSED FOR INCOMPLETENESS
2
$323,000
28
$309,500
2
$40,000
0
$0
2
$403,000
Aggregated Statistics For Year 2002 (Based on 2 full tracts)
B) Conventional Home Purchase Loans
C) Refinancings
D) Home Improvement Loans
F) Non-occupant Loans on < 5 Family Dwellings (A B C & D)
Number
Average Value
Number
Average Value
Number
Average Value
Number
Average Value
LOANS ORIGINATED
212
$344,415
546
$289,707
40
$87,150
296
$338,770
APPLICATIONS APPROVED, NOT ACCEPTED
42
$305,429
112
$340,536
8
$46,750
50
$240,520
APPLICATIONS DENIED
48
$280,667
156
$485,590
22
$68,000
68
$384,588
APPLICATIONS WITHDRAWN
46
$261,696
110
$187,309
6
$121,667
38
$185,684
FILES CLOSED FOR INCOMPLETENESS
6
$470,000
52
$257,923
6
$116,000
10
$304,200
Aggregated Statistics For Year 2001 (Based on 2 full tracts)
A) FHA, FSA/RHS & VA Home Purchase Loans
B) Conventional Home Purchase Loans
C) Refinancings
D) Home Improvement Loans
F) Non-occupant Loans on < 5 Family Dwellings (A B C & D)
Number
Average Value
Number
Average Value
Number
Average Value
Number
Average Value
Number
Average Value
LOANS ORIGINATED
2
$203,000
214
$258,935
374
$290,524
34
$56,412
194
$296,320
APPLICATIONS APPROVED, NOT ACCEPTED
0
$0
38
$230,211
46
$384,174
12
$35,833
32
$203,688
APPLICATIONS DENIED
0
$0
60
$232,267
118
$231,000
18
$72,778
66
$245,545
APPLICATIONS WITHDRAWN
0
$0
12
$274,333
64
$198,531
16
$74,125
20
$278,700
FILES CLOSED FOR INCOMPLETENESS
0
$0
8
$206,000
8
$276,500
2
$100,000
6
$132,000
Aggregated Statistics For Year 2000 (Based on 2 full tracts)
B) Conventional Home Purchase Loans
C) Refinancings
D) Home Improvement Loans
F) Non-occupant Loans on < 5 Family Dwellings (A B C & D)
Number
Average Value
Number
Average Value
Number
Average Value
Number
Average Value
LOANS ORIGINATED
256
$241,820
124
$236,887
48
$35,250
144
$261,903
APPLICATIONS APPROVED, NOT ACCEPTED
16
$181,875
18
$282,667
16
$29,250
10
$355,200
APPLICATIONS DENIED
54
$276,185
36
$271,167
10
$107,400
30
$411,533
APPLICATIONS WITHDRAWN
18
$408,667
48
$225,125
2
$143,000
14
$616,286
FILES CLOSED FOR INCOMPLETENESS
6
$149,333
10
$202,000
2
$50,000
2
$240,000
Aggregated Statistics For Year 1999 (Based on 1 partial tract)
A) FHA, FSA/RHS & VA Home Purchase Loans
B) Conventional Home Purchase Loans
C) Refinancings
D) Home Improvement Loans
F) Non-occupant Loans on < 5 Family Dwellings (A B C & D)
Detailed PMIC statistics for the following Tracts:2010.04
2005 - 2018 National Fire Incident Reporting System (NFIRS) incidents
According to the data from the years 2005 - 2018 the average number of fires per year is 16. The highest number of reported fire incidents - 24 took place in 2015, and the least - 9 in 2013. The data has a decreasing trend.
When looking into fire subcategories, the most reports belonged to: Structure Fires (59.5%), and Outside Fires (29.1%).
Fire incident types reported to NFIRS in Zip Code 11954


 Nearest zip codes: 11930, 11937, 06390, 11957, 11975, 06355.
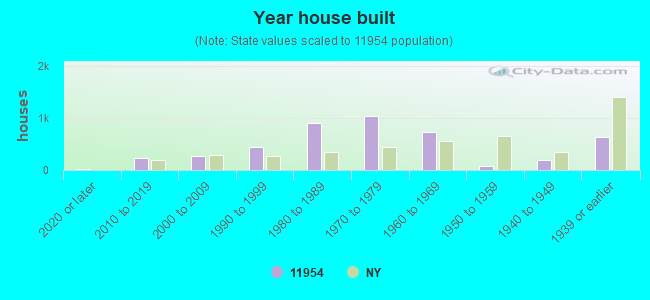


 According to the data from the years 2005 - 2018 the average number of fires per year is 16. The highest number of reported fire incidents - 24 took place in 2015, and the least - 9 in 2013. The data has a decreasing trend.
 When looking into fire subcategories, the most reports belonged to: Structure Fires (59.5%), and Outside Fires (29.1%).