Estimated zip code population in 2022: 2,005 Zip code population in 2010: 1,753 Zip code population in 2000: 2,357
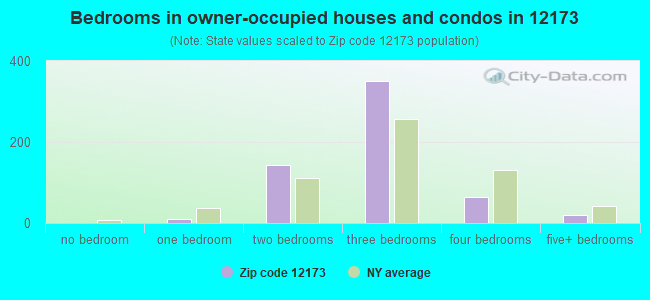
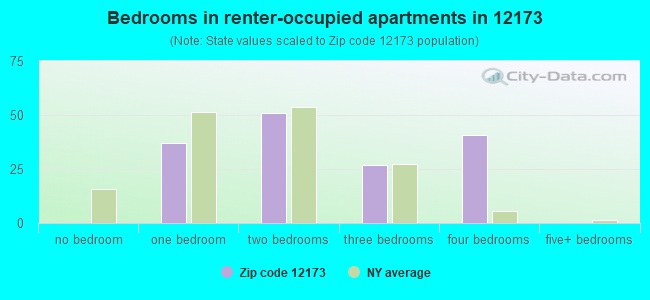
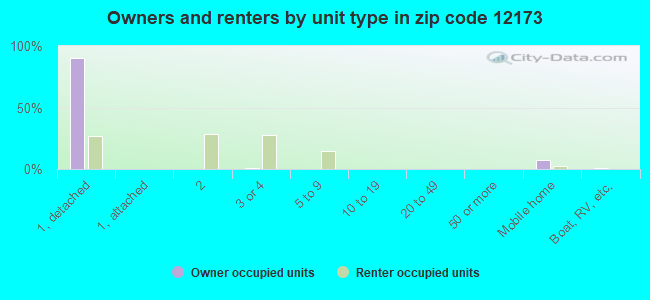
Houses and condos: 850 Renter-occupied apartments: 158
% of renters here:
21%
State:
46%
March 2022 cost of living index in zip code 12173: 95.4 (near average, U.S. average is 100)
Land area: 17.2 sq. mi. Water area: 0.0 sq. mi.
Population density: 117 people per square mile
(very low).
OSM Map
General Map
Google Map
MSN Map
OSM Map
General Map
Google Map
MSN Map
OSM Map
General Map
Google Map
MSN Map
OSM Map
General Map
Google Map
MSN Map
Please wait while loading the map...
Real estate property taxes paid for housing units in 2022:
This zip code:
2.0% ($4,061)
New York:
1.5% ($6,180)
Median real estate property taxes paid for housing units with mortgages in 2022: $4,051 (1.9%) Median real estate property taxes paid for housing units with no mortgage in 2022: $4,079 (2.3%)
Business Search- 14 Million verified businesses
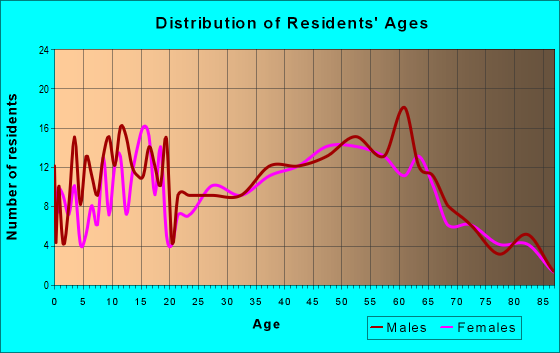
Males: 1,069
(53.3%)
Females: 936
(46.7%)
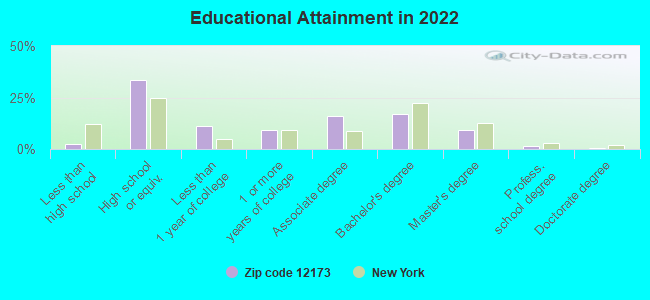
For population 25 years and over in 12173:
High school or higher: 97.4%
Bachelor's degree or higher: 27.9%
Graduate or professional degree: 11.0%
Unemployed: 4.3%
Mean travel time to work (commute): 30.3 minutes
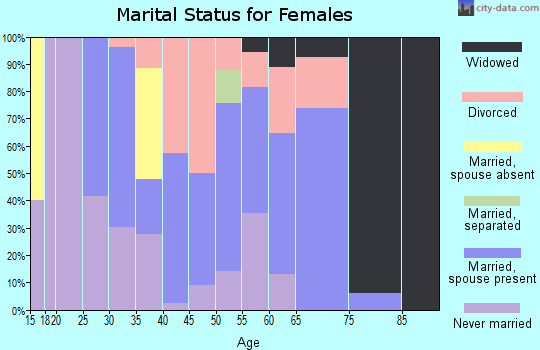
For population 15 years and over in 12173:
Never married: 32.1%
Now married: 52.6%
Separated: 3.3%
Widowed: 3.4%
Divorced: 8.6%
Zip code 12173 compared to state average:
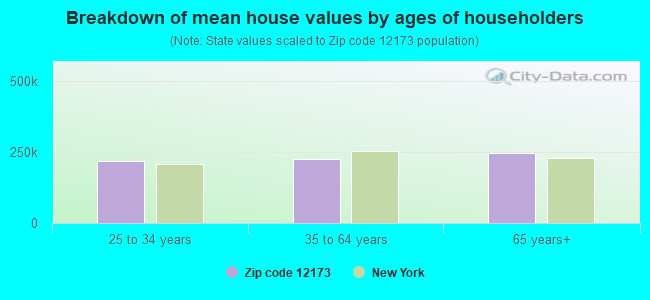
Median house value below state average.
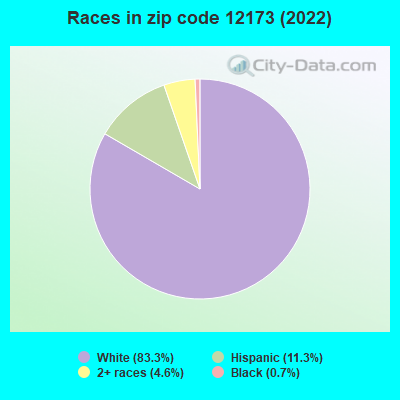
Black race population percentage significantly below state average.
Hispanic race population percentage below state average.
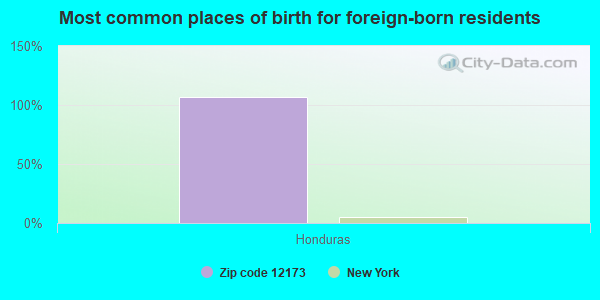
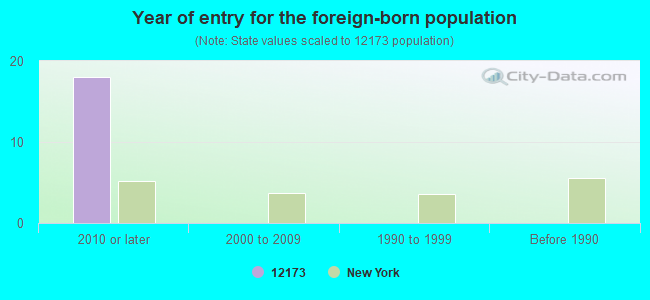
Foreign-born population percentage significantly below state average.
Renting percentage below state average.
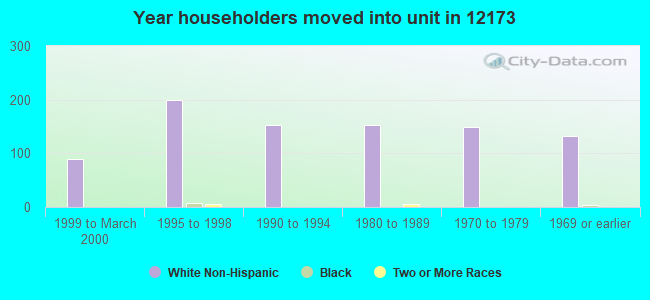
Length of stay since moving in significantly above state average.
Number of college students below state average.
Percentage of population with a bachelor's degree or higher below state average.
Averages for the 2020 tax year for zip code 12173, filed in 2021:
Average Adjusted Gross Income (AGI) in 2020: $72,098 (Individual Income Tax Returns)
Here:
$72,098
State:
$90,930
Salary/wage: $59,682 (reported on 80.7% of returns)
Here:
$59,682
State:
$72,104
(% of AGI for various income ranges: 1212.9% for AGIs below $25k, 3569.4% for AGIs $25k-50k, 6363.3% for AGIs $50k-75k, 8863.3% for AGIs $75k-100k, 15361.4% for AGIs $100k-200k)
Taxable interest for individuals: $766 (reported on 42.2% of returns)
This zip code:
$766
New York:
$3,075
(% of AGI for various income ranges: 12.1% for AGIs below $25k, 16.5% for AGIs $25k-50k, 92.2% for AGIs $50k-75k, 33.3% for AGIs $75k-100k, 105.7% for AGIs $100k-200k)
Ordinary dividends: $7,050 (reported on 19.3% of returns)
Here:
$7,050
State:
$11,095
(% of AGI for various income ranges: 17.1% for AGIs below $25k, 7.6% for AGIs $25k-50k, 173.3% for AGIs $50k-75k, 98.3% for AGIs $75k-100k, 638.6% for AGIs $100k-200k)
Net capital gain/loss in AGI: +$4,693 (reported on 16.9% of returns)
Here:
+$4,693
State:
+$44,925
(% of AGI for various income ranges: 21.4% for AGIs below $25k, 163.3% for AGIs $50k-75k, 685.7% for AGIs $100k-200k)
Profit/loss from business: +$17,831 (reported on 15.7% of returns)
Here:
+$17,831
State:
+$14,940
(% of AGI for various income ranges: 255.0% for AGIs below $25k, 481.1% for AGIs $50k-75k, 2182.9% for AGIs $100k-200k)
Taxable individual retirement arrangement distribution: $19,312 (reported on 9.6% of returns)
12173:
$19,312
New York:
$19,609
(% of AGI for various income ranges: 186.4% for AGIs below $25k, 515.6% for AGIs $50k-75k, 1171.4% for AGIs $100k-200k)
Total itemized deductions: $30,217 (reported on 7.2% of returns)
Here:
$30,217
State:
$39,326
(% of AGI for various income ranges: 705.6% for AGIs $50k-75k, 1682.9% for AGIs $100k-200k)
Charity contributions: $7,940 (reported on 6.0% of returns)
Here:
$7,940
State:
$15,420
(% of AGI for various income ranges: 35.7% for AGIs below $25k, 495.7% for AGIs $100k-200k)
Taxes paid: $9,867 (reported on 7.2% of returns)
12173:
$9,867
State:
$9,183
(% of AGI for various income ranges: 254.4% for AGIs $50k-75k, 518.6% for AGIs $100k-200k)
Earned income credit: $1,673 (reported on 13.3% of returns)
Here:
$1,673
State:
$2,138
(% of AGI for various income ranges: 86.4% for AGIs below $25k, 37.1% for AGIs $25k-50k)
Percentage of individuals using paid preparers for their 2020 taxes: 94.0%
Here:
94%
State:
95%
(% for various income ranges: 95.5% for AGIs below $25k, 95.5% for AGIs $25k-50k, 93.3% for AGIs $50k-75k, 88.9% for AGIs $75k-100k, 91.7% for AGIs $100k-200k, 100.0% for AGIs over 200k)
Averages for the 2012 tax year for zip code 12173, filed in 2013:
Average Adjusted Gross Income (AGI) in 2012: $52,396 (Individual Income Tax Returns)
Here:
$52,396
State:
$77,088
Salary/wage: $46,047 (reported on 82.7% of returns)
Here:
$46,047
State:
$60,593
(% of AGI for various income ranges: 71.0% for AGIs below $25k, 70.2% for AGIs $25k-50k, 77.7% for AGIs $50k-75k, 76.1% for AGIs $75k-100k, 69.5% for AGIs $100k-200k)
Taxable interest for individuals: $612 (reported on 44.0% of returns)
This zip code:
$612
New York:
$3,125
(% of AGI for various income ranges: 0.8% for AGIs below $25k, 0.6% for AGIs $25k-50k, 0.5% for AGIs $50k-75k, 0.5% for AGIs $75k-100k, 0.4% for AGIs $100k-200k)
Ordinary dividends: $1,728 (reported on 24.0% of returns)
Here:
$1,728
State:
$10,299
(% of AGI for various income ranges: 1.3% for AGIs below $25k, 1.1% for AGIs $25k-50k, 0.3% for AGIs $50k-75k, 0.5% for AGIs $75k-100k, 1.0% for AGIs $100k-200k)
Net capital gain/loss in AGI: +$2,280 (reported on 13.3% of returns)
Here:
+$2,280
State:
+$42,474
(% of AGI for various income ranges: 1.6% for AGIs $100k-200k)
Profit/loss from business: +$8,318 (reported on 14.7% of returns)
Here:
+$8,318
State:
+$16,168
(% of AGI for various income ranges: 4.5% for AGIs below $25k, 4.9% for AGIs $25k-50k, 2.7% for AGIs $50k-75k, 3.4% for AGIs $75k-100k)
Taxable individual retirement arrangement distribution: $12,757 (reported on 9.3% of returns)
12173:
$12,757
New York:
$17,621
Total itemized deductions: $21,663 (25% of AGI, reported on 36.0% of returns)
Here:
$21,663
State:
$34,985
Here:
24.9% of AGI
State:
21.3% of AGI
(% of AGI for various income ranges: 11.1% for AGIs below $25k, 12.1% for AGIs $25k-50k, 12.7% for AGIs $50k-75k, 15.0% for AGIs $75k-100k, 18.2% for AGIs $100k-200k)
Charity contributions: $1,962 (reported on 28.0% of returns)
Here:
$1,962
State:
$5,572
(% of AGI for various income ranges: 1.2% for AGIs $25k-50k, 1.0% for AGIs $50k-75k, 1.1% for AGIs $75k-100k, 1.2% for AGIs $100k-200k)
Taxes paid: $10,148 (reported on 36.0% of returns)
12173:
$10,148
State:
$18,656
(% of AGI for various income ranges: 4.1% for AGIs below $25k, 4.7% for AGIs $25k-50k, 5.2% for AGIs $50k-75k, 6.8% for AGIs $75k-100k, 9.8% for AGIs $100k-200k)
Earned income credit: $1,910 (reported on 13.3% of returns)
Here:
$1,910
State:
$2,230
(% of AGI for various income ranges: 4.5% for AGIs below $25k, 0.9% for AGIs $25k-50k)
Percentage of individuals using paid preparers for their 2012 taxes: 54.7%
Here:
55%
State:
66%
(% for various income ranges: 52.0% for AGIs below $25k, 55.6% for AGIs $25k-50k, 50.0% for AGIs $50k-75k, 62.5% for AGIs $75k-100k, 60.0% for AGIs $100k-200k)
Averages for the 2004 tax year for zip code 12173, filed in 2005:
Average Adjusted Gross Income (AGI) in 2004: $50,338 (Individual Income Tax Returns)
Here:
$50,338
State:
$59,519
Salary/wage: $45,781 (reported on 85.4% of returns)
Here:
$45,781
State:
$50,673
(% of AGI for various income ranges: 87.6% for AGIs below $10k, 79.7% for AGIs $10k-25k, 78.0% for AGIs $25k-50k, 83.4% for AGIs $50k-75k, 80.8% for AGIs $75k-100k, 71.8% for AGIs over 100k)
Taxable interest for individuals: $955 (reported on 58.5% of returns)
This zip code:
$955
New York:
$2,377
(% of AGI for various income ranges: 7.2% for AGIs below $10k, 2.3% for AGIs $10k-25k, 0.8% for AGIs $25k-50k, 0.5% for AGIs $50k-75k, 0.6% for AGIs $75k-100k, 1.4% for AGIs over 100k)
Taxable dividends: $1,126 (reported on 29.4% of returns)
Here:
$1,126
State:
$5,394
(% of AGI for various income ranges: 3.1% for AGIs below $10k, 1.3% for AGIs $10k-25k, 0.6% for AGIs $25k-50k, 0.4% for AGIs $50k-75k, 1.0% for AGIs $75k-100k, 0.5% for AGIs over 100k)
Net capital gain/loss: +$7,000 (reported on 15.8% of returns)
Here:
+$7,000
State:
+$23,581
(% of AGI for various income ranges: 0.0% for AGIs $10k-25k, -0.4% for AGIs $25k-50k, 0.1% for AGIs $50k-75k, 0.8% for AGIs $75k-100k, 6.1% for AGIs over 100k)
Profit/loss from business: +$9,029 (reported on 13.9% of returns)
Here:
+$9,029
State:
+$13,809
(% of AGI for various income ranges: 5.9% for AGIs $10k-25k, 4.8% for AGIs $25k-50k, 2.7% for AGIs $50k-75k, 1.7% for AGIs $75k-100k, 0.9% for AGIs over 100k)
IRA payment deduction: $2,947 (reported on 2.5% of returns)
12173:
$2,947
New York:
$3,115
Total itemized deductions: $18,092 (19% of AGI, reported on 33.2% of returns)
Here:
$18,092
State:
$25,864
Here:
18.6% of AGI
State:
21.9% of AGI
(% of AGI for various income ranges: 11.2% for AGIs $10k-25k, 8.2% for AGIs $25k-50k, 13.2% for AGIs $50k-75k, 15.2% for AGIs $75k-100k, 12.3% for AGIs over 100k)
Charity contributions deductions: $2,221 (2% of AGI, reported on 30.0% of returns)
Here:
$2,221
State:
$4,439
Here:
2.2% of AGI
State:
3.6% of AGI
(% of AGI for various income ranges: 1.6% for AGIs $10k-25k, 0.6% for AGIs $25k-50k, 1.6% for AGIs $50k-75k, 1.7% for AGIs $75k-100k, 1.3% for AGIs over 100k)
Total tax: $7,896 (reported on 79.4% of returns)
12173:
$7,896
State:
$11,730
(% of AGI for various income ranges: 2.1% for AGIs below $10k, 4.2% for AGIs $10k-25k, 7.8% for AGIs $25k-50k, 8.4% for AGIs $50k-75k, 10.4% for AGIs $75k-100k, 20.6% for AGIs over 100k)
Earned income credit: $1,270 (reported on 11.8% of returns)
Here:
$1,270
State:
$1,757
Percentage of individuals using paid preparers for their 2004 taxes: 61.1%
Here:
61%
State:
67%
(% for various income ranges: 50.7% for AGIs below $10k, 66.5% for AGIs $10k-25k, 60.9% for AGIs $25k-50k, 64.6% for AGIs $50k-75k, 54.9% for AGIs $75k-100k, 72.2% for AGIs over 100k)
Likely homosexual households (counted as self-reported same-sex unmarried-partner households)
Lesbian couples: 0.6% of all households
Gay men: 0.6% of all households
Household received Food Stamps/SNAP in the past 12 months: 34 Household did not receive Food Stamps/SNAP in the past 12 months: 700
Women who had a birth in the past 12 months: 32 (17 now married, 15 unmarried) Women who did not have a birth in the past 12 months: 376 (171 now married, 204 unmarried)
Housing units in zip code 12173 with a mortgage: 359 (67 second mortgage, 68 both second mortgage and home equity loan) Houses without a mortgage: 6
Median monthly owner costs for units with a mortgage: $1,495 Median monthly owner costs for units without a mortgage: $684
Residents with income below the poverty level in 2022:
This zip code:
7.7%
Whole state:
14.3%
Residents with income below 50% of the poverty level in 2022:
This zip code:
7.1%
Whole state:
6.8%
Median number of rooms in houses and condos:
Here:
6.0
State:
6.3
Median number of rooms in apartments:
Here:
5.9
State:
3.8
Notable locations in this zip code not listed on our city pages
Churches in zip code 12173 include: Saint Pauls Church (A), Saint John's Lutheran Church (B), Saint Mary's Church (C). Display/hide their locations on the map
In group quarters: 3 (-1 institutionalized population)
Size of family households: 277 2-persons, 83 3-persons, 90 4-persons, 42 5-persons, 17 6-persons, 16 7-or-more-persons
Size of nonfamily households: 181 1-person, 35 2-persons
312 married couples with children.
289 single-parent households (59 men, 230 women).
92.0% of residents of 12173 zip code speak English at home.
8.0% of residents speak Spanish at home (80% well, 20% not well).
0.4% of residents speak other Indo-European language at home (100% very well).
Foreign born population: 15 (0.8%) (0.0% of them are naturalized citizens)
:
0.8%
Whole state:
22.7%
107%Honduras
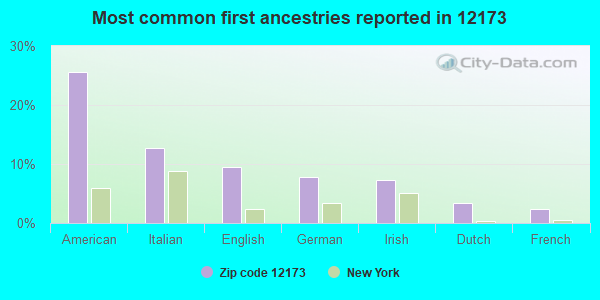
26%American
13%Italian
10%English
8%German
7%Irish
3%Dutch
2%French
Year of entry for the foreign-born population
182010 or later
02000 to 2009
01990 to 1999
0Before 1990
Facilities with environmental interests located in this zip code:
CRAY VALLEY PRODUCTS (7571 ROSSMAN ROAD in STUYVESANT, NY)
STATE MASTER (New York facility tracking) - AIR PROGRAM, (Integrated Compliance Information System) - ICIS-02-1992-0092, FORMAL ENFORCEMENT ACTION COMPLIANCE ACTIVITY (Tracking inspections of insecticide, fungicide, and rodenticide, and toxic substances) (Resource Conservation and Recovery Act (tracking hazardous waste)) Business SIC classification: PLASTICS MATERIALS, SYNTHETIC RESINS, AND NONVULCANIZABLE ELASTOMERS; PAINTS, VARNISHES, LACQUERS, ENAMELS, AND ALLIED PRODUCTS; PAINTS, VARNISHES, AND SUPPLIES Business NAICS classification: PLASTICS MATERIAL AND RESIN MANUFACTURING. Organizations: CRAY VALLEY PRODUCTS INC (LEGALLY RESPONSIBLE PARTY)
J & J MILL CREEK FARM (9100 GIBBONS ROAD in STUYVESANT, NY)
STATE MASTER (New York facility tracking) - National Pollutant Discharge Elimination System Permit National Pollutant Discharge Elimination System NON-MAJOR (Tracking pollutant discharge elimination systems) - permit Business SIC classification: GENERAL FARMS, PRIMARILY LIVESTOCK AND ANIMAL SPECIALTIES Organizations: JOHN W. KOWALKSKI, JR. (CONTACT/OWNER)
, J & J MILL CREEK FARM INC (LEGALLY RESPONSIBLE PARTY)
Alternative names: JOHN W. KOWALKSKI, JR., JOHN W. KOWALSKI, JR.
HOLLY ROCK FARM (823 EICHY BUSH ROAD in STUYVESANT, NY)
STATE MASTER (New York facility tracking) - National Pollutant Discharge Elimination System Permit National Pollutant Discharge Elimination System NON-MAJOR (Tracking pollutant discharge elimination systems) - permit Business SIC classification: GENERAL FARMS, PRIMARILY LIVESTOCK AND ANIMAL SPECIALTIES Organizations: ROBERT KELLER (CONTACT/OWNER)
Alternative names: ROBERT KELLER
Housing units lacking complete plumbing facilities: 2.4% Housing units lacking complete kitchen facilities: 2.4%
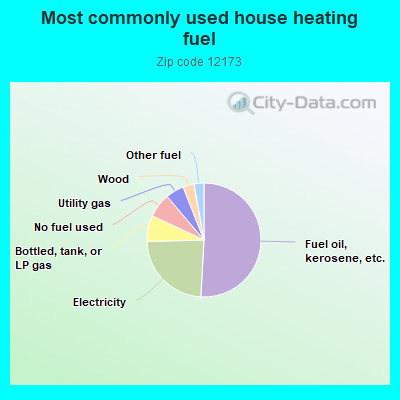
51.1%Fuel oil, kerosene, etc.
23.8%Electricity
7.4%Bottled, tank, or LP gas
6.9%No fuel used
5.2%Utility gas
3.2%Wood
2.8%Other fuel
Population in 1990: 1,806. Population change in the 1990s: +551 (+30.5%).
Place of birth for U.S.-born residents:
This state: 1,774
Northeast: 94
Midwest: 9
South: 87
West: 14
68% of the 12173 zip code residents lived in the same house 5 years ago. Out of people who lived in different houses, 82% lived in this county. Out of people who lived in different counties, 50% lived in New York.
97% of the 12173 zip code residents lived in the same house 1 year ago. Out of people who lived in different houses, 61% moved from this county. Out of people who lived in different houses, 14% moved from different county within same state. Out of people who lived in different houses, 19% moved from different state.
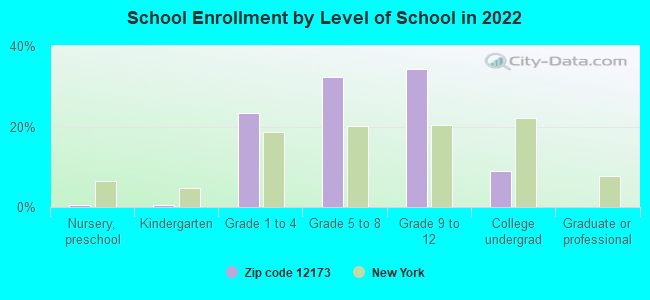
Private vs. public school enrollment:
Students in private schools in grades 1 to 8 (elementary and middle school): 22
Here:
6.9%
New York:
15.6%
Students in private schools in grades 9 to 12 (high school):
Here:
0.0%
New York:
15.0%
Students in private undergraduate colleges: 10
Here:
20.4%
New York:
39.2%
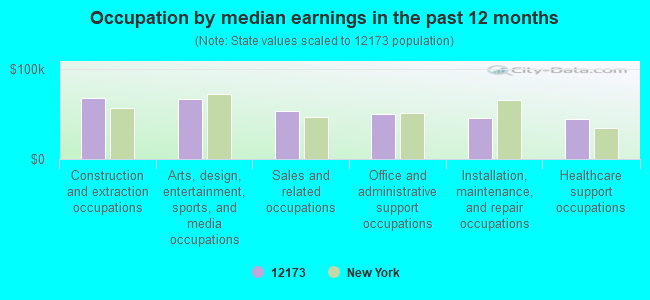
Occupation by median earnings in the past 12 months ($)
67,631Construction and extraction occupations
66,608Arts, design, entertainment, sports, and media occupations
54,049Sales and related occupations
50,197Office and administrative support occupations
45,302Installation, maintenance, and repair occupations
45,110Healthcare support occupations
Companies with federal contracts located in this zip code:
VIPER DEVELOPMENT GROUP, LLC (1848 STATE ROUTE 9 J in STUYVESANT, NY; small business)
$17,156 with Navy for Individual Equipment. Signed on 2005-03-04. Completion date: 2005-03-25.
WALSH, ROBERT E (69 ROYAL RD in STUYVESANT, NY; small business)
$4,090 with Defense Logistics Agency for Refrigeration and Air Conditioning Components. Signed on 2006-06-28. Completion date: 2006-08-13.
Top industries in this zip code by the number of employees in 2005:
Wholesale Trade: Motor Vehicle Parts (Used) Merchant Wholesalers (20-49 employees: 1 establishment)
Other Services (except Public Administration): Religious Organizations (1-4: 2)
Arts, Entertainment, and Recreation: Independent Artists, Writers, and Performers (1-4: 2)
Finance and Insurance: Savings Institutions (1-4: 1)
Accommodation and Food Services: Full-Service Restaurants (1-4: 1)
2002 - 2018 National Fire Incident Reporting System (NFIRS) incidents
Based on the data from the years 2002 - 2018 the average number of fire incidents per year is 11. The highest number of fire incidents - 27 took place in 2014, and the least - 1 in 2017. The data has a decreasing trend.
When looking into fire subcategories, the most reports belonged to: Structure Fires (60.3%), and Outside Fires (25.8%).
Fire incident types reported to NFIRS in Zip Code 12173


 Nearest zip codes: 12174, 12106, 12192, 12124, 12051, 12172.


 Based on the data from the years 2002 - 2018 the average number of fire incidents per year is 11. The highest number of fire incidents - 27 took place in 2014, and the least - 1 in 2017. The data has a decreasing trend.
 When looking into fire subcategories, the most reports belonged to: Structure Fires (60.3%), and Outside Fires (25.8%).