Estimated zip code population in 2022: 1,920 Zip code population in 2010: 2,233 Zip code population in 2000: 2,397
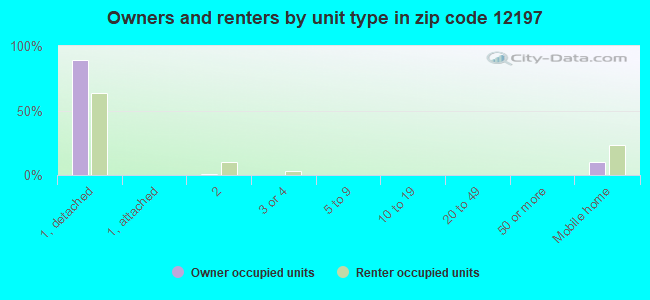
Houses and condos: 1,218 Renter-occupied apartments: 61
% of renters here:
8%
State:
46%
March 2022 cost of living index in zip code 12197: 93.7 (less than average, U.S. average is 100)
Land area: 67.0 sq. mi. Water area: 0.4 sq. mi.
Population density: 29 people per square mile
(very low).
OSM Map
General Map
Google Map
MSN Map
OSM Map
General Map
Google Map
MSN Map
OSM Map
General Map
Google Map
MSN Map
OSM Map
General Map
Google Map
MSN Map
Please wait while loading the map...
Real estate property taxes paid for housing units in 2022:
This zip code:
1.8% ($2,692)
New York:
1.5% ($6,180)
Median real estate property taxes paid for housing units with mortgages in 2022: $2,910 (1.9%) Median real estate property taxes paid for housing units with no mortgage in 2022: $2,551 (1.6%)
Averages for the 2020 tax year for zip code 12197, filed in 2021:
Average Adjusted Gross Income (AGI) in 2020: $56,706 (Individual Income Tax Returns)
Here:
$56,706
State:
$90,930
Salary/wage: $50,095 (reported on 77.5% of returns)
Here:
$50,095
State:
$72,104
(% of AGI for various income ranges: 1088.1% for AGIs below $25k, 3236.7% for AGIs $25k-50k, 6274.2% for AGIs $50k-75k, 9412.5% for AGIs $75k-100k, 19292.5% for AGIs $100k-200k)
Taxable interest for individuals: $849 (reported on 36.3% of returns)
This zip code:
$849
New York:
$3,075
(% of AGI for various income ranges: 12.4% for AGIs below $25k, 17.1% for AGIs $25k-50k, 19.2% for AGIs $50k-75k, 51.2% for AGIs $75k-100k, 235.0% for AGIs $100k-200k)
Ordinary dividends: $4,359 (reported on 21.6% of returns)
Here:
$4,359
State:
$11,095
(% of AGI for various income ranges: 29.5% for AGIs below $25k, 29.5% for AGIs $25k-50k, 142.5% for AGIs $50k-75k, 168.8% for AGIs $75k-100k, 661.2% for AGIs $100k-200k)
Net capital gain/loss in AGI: +$6,182 (reported on 16.7% of returns)
Here:
+$6,182
State:
+$44,925
(% of AGI for various income ranges: 32.4% for AGIs below $25k, 41.9% for AGIs $25k-50k, 201.7% for AGIs $50k-75k, 100.0% for AGIs $75k-100k, 716.2% for AGIs $100k-200k)
Profit/loss from business: +$8,013 (reported on 14.7% of returns)
Here:
+$8,013
State:
+$14,940
(% of AGI for various income ranges: 121.4% for AGIs below $25k, 242.9% for AGIs $25k-50k, 156.7% for AGIs $50k-75k, 311.2% for AGIs $75k-100k)
Taxable individual retirement arrangement distribution: $15,310 (reported on 9.8% of returns)
12197:
$15,310
New York:
$19,609
(% of AGI for various income ranges: 152.4% for AGIs $25k-50k, 625.0% for AGIs $50k-75k, 576.2% for AGIs $100k-200k)
Total itemized deductions: $24,933 (reported on 2.9% of returns)
Here:
$24,933
State:
$39,326
(% of AGI for various income ranges: 935.0% for AGIs $75k-100k)
Charity contributions: $2,500 (reported on 2.0% of returns)
Here:
$2,500
State:
$15,420
(% of AGI for various income ranges: 41.7% for AGIs $50k-75k)
Taxes paid: $9,233 (reported on 2.9% of returns)
12197:
$9,233
State:
$9,183
(% of AGI for various income ranges: 346.2% for AGIs $75k-100k)
Earned income credit: $2,046 (reported on 12.7% of returns)
Here:
$2,046
State:
$2,138
(% of AGI for various income ranges: 72.9% for AGIs below $25k, 53.8% for AGIs $25k-50k)
Percentage of individuals using paid preparers for their 2020 taxes: 95.1%
Here:
95%
State:
95%
(% for various income ranges: 90.3% for AGIs below $25k, 96.2% for AGIs $25k-50k, 100.0% for AGIs $50k-75k, 100.0% for AGIs $75k-100k, 93.3% for AGIs $100k-200k)
Averages for the 2012 tax year for zip code 12197, filed in 2013:
Average Adjusted Gross Income (AGI) in 2012: $42,165 (Individual Income Tax Returns)
Here:
$42,165
State:
$77,088
Salary/wage: $38,216 (reported on 77.9% of returns)
Here:
$38,216
State:
$60,593
(% of AGI for various income ranges: 65.6% for AGIs below $25k, 71.5% for AGIs $25k-50k, 76.8% for AGIs $50k-75k, 65.7% for AGIs $75k-100k, 70.1% for AGIs $100k-200k)
Taxable interest for individuals: $886 (reported on 37.9% of returns)
This zip code:
$886
New York:
$3,125
(% of AGI for various income ranges: 1.0% for AGIs below $25k, 0.8% for AGIs $25k-50k, 1.1% for AGIs $50k-75k, 1.1% for AGIs $75k-100k, 0.2% for AGIs $100k-200k)
Ordinary dividends: $2,932 (reported on 26.3% of returns)
Here:
$2,932
State:
$10,299
(% of AGI for various income ranges: 2.7% for AGIs below $25k, 2.0% for AGIs $25k-50k, 0.9% for AGIs $50k-75k, 4.2% for AGIs $75k-100k, 0.3% for AGIs $100k-200k)
Net capital gain/loss in AGI: +$500 (reported on 16.8% of returns)
Here:
+$500
State:
+$42,474
(% of AGI for various income ranges: 1.5% for AGIs $100k-200k)
Profit/loss from business: +$9,643 (reported on 14.7% of returns)
Here:
+$9,643
State:
+$16,168
(% of AGI for various income ranges: 7.9% for AGIs below $25k, 3.0% for AGIs $25k-50k, 9.4% for AGIs $75k-100k)
Taxable individual retirement arrangement distribution: $12,956 (reported on 9.5% of returns)
12197:
$12,956
New York:
$17,621
(% of AGI for various income ranges: 2.6% for AGIs below $25k, 4.4% for AGIs $25k-50k, 8.6% for AGIs $75k-100k)
Total itemized deductions: $16,925 (22% of AGI, reported on 21.1% of returns)
Here:
$16,925
State:
$34,985
Here:
21.6% of AGI
State:
21.3% of AGI
(% of AGI for various income ranges: 6.3% for AGIs below $25k, 6.0% for AGIs $25k-50k, 7.2% for AGIs $50k-75k, 8.4% for AGIs $75k-100k, 12.9% for AGIs $100k-200k)
Charity contributions: $1,925 (reported on 12.6% of returns)
Here:
$1,925
State:
$5,572
(% of AGI for various income ranges: 0.6% for AGIs $25k-50k, 0.9% for AGIs $50k-75k, 0.9% for AGIs $100k-200k)
Taxes paid: $7,440 (reported on 21.1% of returns)
12197:
$7,440
State:
$18,656
(% of AGI for various income ranges: 1.5% for AGIs below $25k, 2.0% for AGIs $25k-50k, 3.1% for AGIs $50k-75k, 3.3% for AGIs $75k-100k, 7.2% for AGIs $100k-200k)
Earned income credit: $1,873 (reported on 15.8% of returns)
Here:
$1,873
State:
$2,230
(% of AGI for various income ranges: 4.4% for AGIs below $25k, 0.9% for AGIs $25k-50k)
Percentage of individuals using paid preparers for their 2012 taxes: 58.9%
Here:
59%
State:
66%
(% for various income ranges: 55.3% for AGIs below $25k, 56.0% for AGIs $25k-50k, 60.0% for AGIs $50k-75k, 66.7% for AGIs $75k-100k, 75.0% for AGIs $100k-200k)
Averages for the 2004 tax year for zip code 12197, filed in 2005:
Average Adjusted Gross Income (AGI) in 2004: $33,725 (Individual Income Tax Returns)
Here:
$33,725
State:
$59,519
Salary/wage: $30,954 (reported on 79.7% of returns)
Here:
$30,954
State:
$50,673
(% of AGI for various income ranges: 149.5% for AGIs below $10k, 70.8% for AGIs $10k-25k, 76.2% for AGIs $25k-50k, 75.6% for AGIs $50k-75k, 72.1% for AGIs $75k-100k, 55.2% for AGIs over 100k)
Taxable interest for individuals: $1,557 (reported on 50.7% of returns)
This zip code:
$1,557
New York:
$2,377
(% of AGI for various income ranges: 14.2% for AGIs below $10k, 2.8% for AGIs $10k-25k, 1.9% for AGIs $25k-50k, 3.6% for AGIs $50k-75k, 0.7% for AGIs $75k-100k, 1.1% for AGIs over 100k)
Taxable dividends: $2,007 (reported on 29.3% of returns)
Here:
$2,007
State:
$5,394
(% of AGI for various income ranges: 7.0% for AGIs below $10k, 1.9% for AGIs $10k-25k, 2.0% for AGIs $25k-50k, 1.1% for AGIs $50k-75k, 2.2% for AGIs $75k-100k, 0.8% for AGIs over 100k)
Net capital gain/loss: +$3,448 (reported on 21.3% of returns)
Here:
+$3,448
State:
+$23,581
(% of AGI for various income ranges: -5.7% for AGIs below $10k, 1.7% for AGIs $10k-25k, 0.7% for AGIs $25k-50k, 1.3% for AGIs $50k-75k, 1.5% for AGIs $75k-100k, 9.4% for AGIs over 100k)
Profit/loss from business: +$5,919 (reported on 17.3% of returns)
Here:
+$5,919
State:
+$13,809
(% of AGI for various income ranges: 5.5% for AGIs below $10k, 9.3% for AGIs $10k-25k, 3.8% for AGIs $25k-50k, 0.3% for AGIs $50k-75k, 2.9% for AGIs $75k-100k)
IRA payment deduction: $2,731 (reported on 2.6% of returns)
12197:
$2,731
New York:
$3,115
Total itemized deductions: $15,123 (24% of AGI, reported on 23.0% of returns)
Here:
$15,123
State:
$25,864
Here:
24.2% of AGI
State:
21.9% of AGI
(% of AGI for various income ranges: 12.7% for AGIs below $10k, 6.1% for AGIs $10k-25k, 7.7% for AGIs $25k-50k, 10.9% for AGIs $50k-75k, 14.4% for AGIs $75k-100k, 13.7% for AGIs over 100k)
Charity contributions deductions: $2,097 (3% of AGI, reported on 19.7% of returns)
Here:
$2,097
State:
$4,439
Here:
3.2% of AGI
State:
3.6% of AGI
(% of AGI for various income ranges: 0.4% for AGIs $10k-25k, 0.8% for AGIs $25k-50k, 1.2% for AGIs $50k-75k, 2.1% for AGIs $75k-100k, 2.2% for AGIs over 100k)
Total tax: $3,962 (reported on 74.1% of returns)
12197:
$3,962
State:
$11,730
(% of AGI for various income ranges: 4.2% for AGIs below $10k, 4.8% for AGIs $10k-25k, 7.0% for AGIs $25k-50k, 8.3% for AGIs $50k-75k, 10.4% for AGIs $75k-100k, 15.7% for AGIs over 100k)
Earned income credit: $1,727 (reported on 15.5% of returns)
Here:
$1,727
State:
$1,757
Percentage of individuals using paid preparers for their 2004 taxes: 62.9%
Here:
63%
State:
67%
(% for various income ranges: 52.1% for AGIs below $10k, 61.0% for AGIs $10k-25k, 63.8% for AGIs $25k-50k, 73.6% for AGIs $50k-75k, 78.1% for AGIs $75k-100k, 69.7% for AGIs over 100k)
Likely homosexual households (counted as self-reported same-sex unmarried-partner households)
Lesbian couples: 0.0% of all households
Gay men: 1.6% of all households
Household received Food Stamps/SNAP in the past 12 months: 76 Household did not receive Food Stamps/SNAP in the past 12 months: 667
Women who had a birth in the past 12 months: 12 (12 now married, 0 unmarried) Women who did not have a birth in the past 12 months: 370 (141 now married, 228 unmarried)
Housing units in zip code 12197 with a mortgage: 256 (20 second mortgage, 15 both second mortgage and home equity loan) Houses without a mortgage: 26
Median monthly owner costs for units with a mortgage: $1,262 Median monthly owner costs for units without a mortgage: $547
Residents with income below the poverty level in 2022:
This zip code:
5.6%
Whole state:
14.3%
Residents with income below 50% of the poverty level in 2022:
This zip code:
3.9%
Whole state:
6.8%
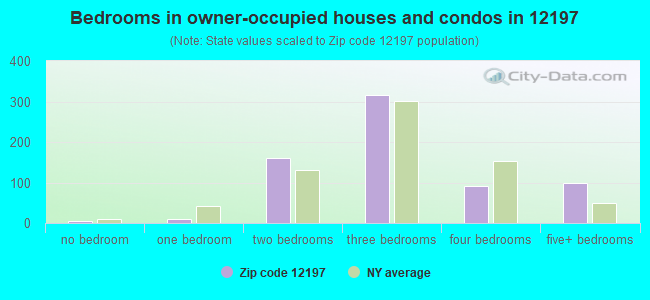
Median number of rooms in houses and condos:
Here:
6.7
State:
6.3
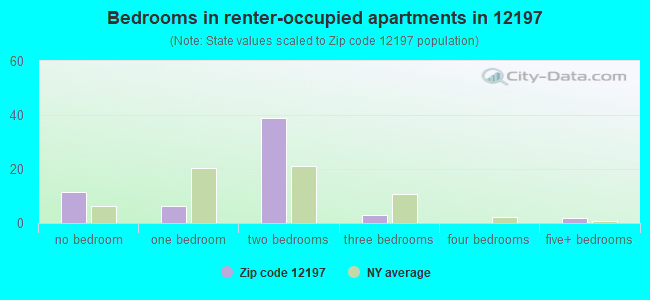
Median number of rooms in apartments:
Here:
4.5
State:
3.8
Notable locations in this zip code not listed on our city pages
Notable locations in zip code 12197: Barton Corners (A), Worcester Eastbound Rest Area (B), Worcester Free Library (C). Display/hide their locations on the map
Churches in zip code 12197 include: First Presbyterian Church (A), Second Baptist Church (B), Saint Josephs Catholic Church (C). Display/hide their locations on the map
Cemeteries: Simpson Cemetery (1), Draper Hill Cemetery (2), Saint Joseph's Roman Catholic Cemetery (3), Ferris Cemetery (4), Decatur Cemetery (5), Maple Grove Cemetery (6). Display/hide their locations on the map
In group quarters: 31 (-1 institutionalized population)
Size of family households: 298 2-persons, 66 3-persons, 75 4-persons, 89 5-persons, 4 6-persons
Size of nonfamily households: 164 1-person, 33 2-persons, 14 3-persons
116 married couples with children.
54 single-parent households (32 men, 22 women).
99.3% of residents of 12197 zip code speak English at home.
0.1% of residents speak Spanish at home (100% very well).
0.3% of residents speak other Indo-European language at home (67% very well, 33% not well).
0.7% of residents speak other language at home (100% well).
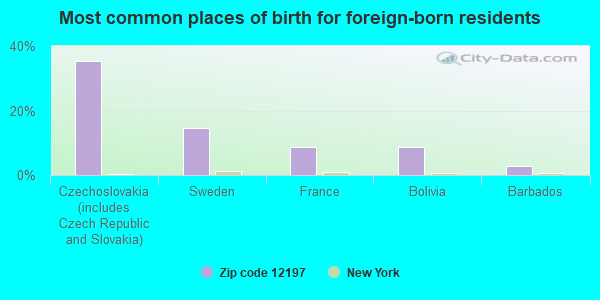
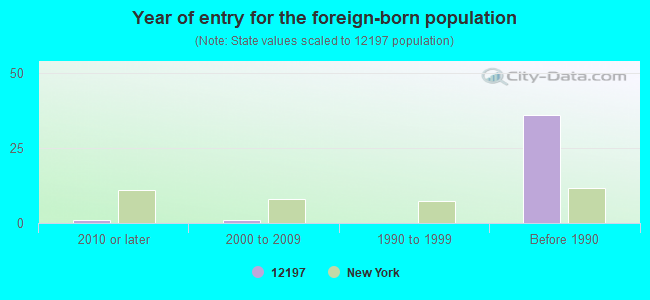
Foreign born population: 34 (1.8%) (61.2% of them are naturalized citizens)
This zip code:
1.8%
Whole state:
22.7%
35%Czechoslovakia (includes Czech Republic and Slovakia)
15%Sweden
9%France
9%Bolivia
3%Barbados
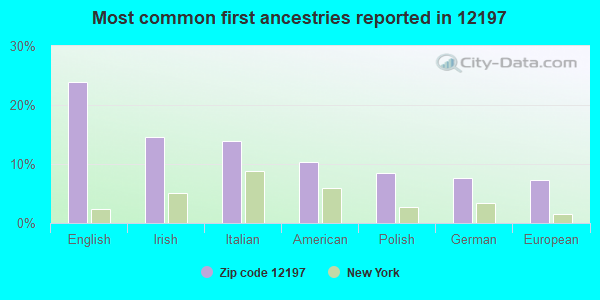
24%English
15%Irish
14%Italian
10%American
8%Polish
8%German
7%European
Year of entry for the foreign-born population
12010 or later
12000 to 2009
01990 to 1999
36Before 1990
Facilities with environmental interests located in this zip code:
A T & T (OFF COUNTY RD 39 - EAST APPROX in DECATUR, NY)
Conditionally Exempt Small Quantity Generators, less than 100 kg/month of hazardous waste (Resource Conservation and Recovery Act (tracking hazardous waste)) - notification
Housing units lacking complete plumbing facilities: 5.3% Housing units lacking complete kitchen facilities: 2.1%
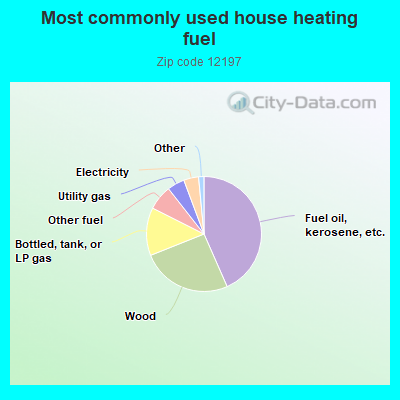
43.5%Fuel oil, kerosene, etc.
25.6%Wood
13.5%Bottled, tank, or LP gas
7.0%Other fuel
4.9%Utility gas
4.2%Electricity
0.8%Solar energy
0.5%No fuel used
Population in 1990: 2,239. Population change in the 1990s: +158 (+7.1%).
Place of birth for U.S.-born residents:
This state: 1,345
Northeast: 329
Midwest: 16
South: 164
West: 14
66% of the 12197 zip code residents lived in the same house 5 years ago. Out of people who lived in different houses, 58% lived in this county. Out of people who lived in different counties, 50% lived in New York.
90% of the 12197 zip code residents lived in the same house 1 year ago. Out of people who lived in different houses, 15% moved from this county. Out of people who lived in different houses, 59% moved from different county within same state. Out of people who lived in different houses, 28% moved from different state. Out of people who lived in different houses, 1% moved from abroad.
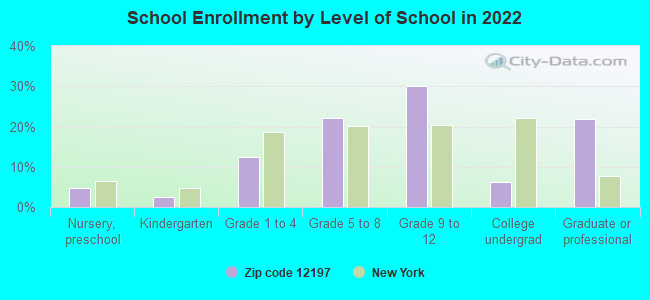
Private vs. public school enrollment:
Students in private schools in grades 1 to 8 (elementary and middle school): 7
Here:
6.0%
New York:
15.6%
Students in private schools in grades 9 to 12 (high school): 1
Here:
1.0%
New York:
15.0%
Students in private undergraduate colleges: 20
Here:
92.0%
New York:
39.2%
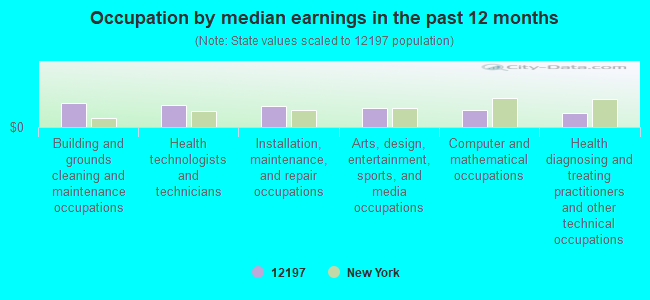
Occupation by median earnings in the past 12 months ($)
84,965Building and grounds cleaning and maintenance occupations
77,093Health technologists and technicians
74,450Installation, maintenance, and repair occupations
67,613Arts, design, entertainment, sports, and media occupations
60,491Computer and mathematical occupations
50,102Health diagnosing and treating practitioners and other technical occupations
Top industries in this zip code by the number of employees in 2005:
Accommodation and Food Services: Bed-and-Breakfast Inns (10-19: 1)
Professional, Scientific, and Technical Services: Offices of Lawyers (5-9: 1, 1-4: 1)
Accommodation and Food Services: Limited-Service Restaurants (5-9: 1)
Finance and Insurance: Commercial Banking (5-9: 1)
People in group quarters in 2010:
12 people in group homes intended for adults
9 people in workers' group living quarters and job corps centers
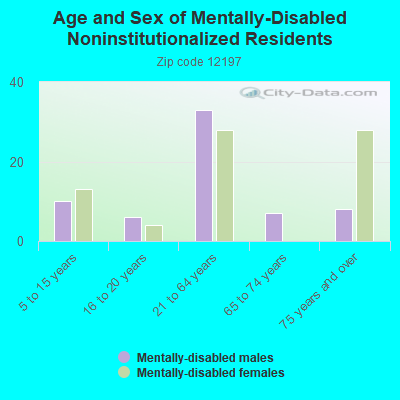
People in group quarters in 2000:
12 people in homes for the mentally retarded
Fatal accident statistics in 2014:
Fatal accident count: 1
Vehicles involved in fatal accidents: 2
Fatal accidents caused by drunken drivers: 0
Fatalities: 1
Persons involved in fatal accidents: 5
Pedestrians involved in fatal accidents: 0
Fatal accident statistics in 2012:
Fatal accident count: 1
Vehicles involved in fatal accidents: 1
Fatal accidents caused by drunken drivers: 1
Fatalities: 1
Persons involved in fatal accidents: 1
Pedestrians involved in fatal accidents: 0
2002 - 2018 National Fire Incident Reporting System (NFIRS) incidents
According to the data from the years 2002 - 2018 the average number of fires per year is 8. The highest number of fires - 17 took place in 2005, and the least - 0 in 2003. The data has a rising trend.
When looking into fire subcategories, the most incidents belonged to: Structure Fires (50.0%), and Outside Fires (24.6%).
Fire incident types reported to NFIRS in Zip Code 12197
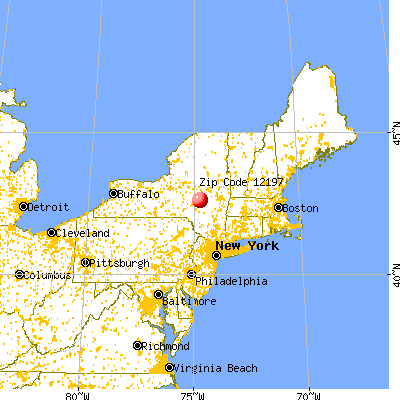


 Nearest zip codes: 12064, 13488, 12036, 12155, 13450, 12093.


 According to the data from the years 2002 - 2018 the average number of fires per year is 8. The highest number of fires - 17 took place in 2005, and the least - 0 in 2003. The data has a rising trend.
 When looking into fire subcategories, the most incidents belonged to: Structure Fires (50.0%), and Outside Fires (24.6%).