Estimated zip code population in 2022: 14,558 Zip code population in 2010: 16,395 Zip code population in 2000: 16,291
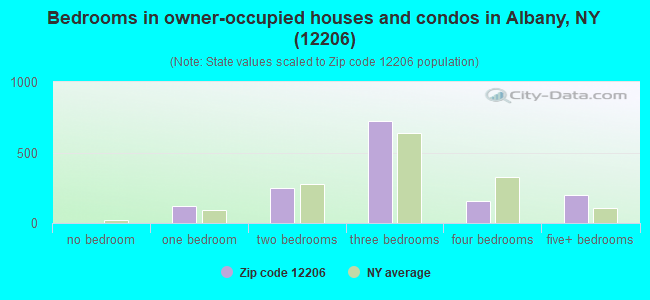
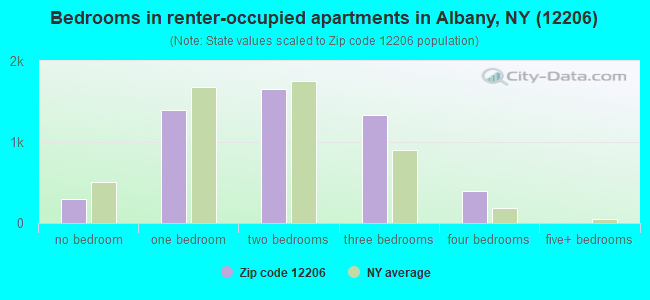
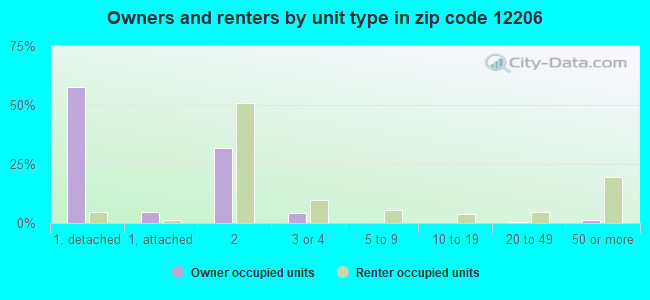
Houses and condos: 8,405 Renter-occupied apartments: 5,096
% of renters here:
78%
State:
46%
March 2022 cost of living index in zip code 12206: 106.4 (more than average, U.S. average is 100)
Land area: 2.1 sq. mi. Water area: 0.0 sq. mi.
Population density: 6,839 people per square mile
(high).
OSM Map
General Map
Google Map
MSN Map
OSM Map
General Map
Google Map
MSN Map
OSM Map
General Map
Google Map
MSN Map
OSM Map
General Map
Google Map
MSN Map
Please wait while loading the map...
Real estate property taxes paid for housing units in 2022:
This zip code:
2.2% ($2,744)
New York:
1.5% ($6,180)
Median real estate property taxes paid for housing units with mortgages in 2022: $4,374 (2.7%) Median real estate property taxes paid for housing units with no mortgage in 2022: $2,191 (2.0%)
Averages for the 2020 tax year for zip code 12206, filed in 2021:
Average Adjusted Gross Income (AGI) in 2020: $36,750 (Individual Income Tax Returns)
Here:
$36,750
State:
$90,930
Salary/wage: $33,044 (reported on 87.2% of returns)
Here:
$33,044
State:
$72,104
(% of AGI for various income ranges: 1091.9% for AGIs below $25k, 3564.5% for AGIs $25k-50k, 6936.2% for AGIs $50k-75k, 10404.7% for AGIs $75k-100k, 16676.8% for AGIs $100k-200k)
Taxable interest for individuals: $619 (reported on 13.9% of returns)
This zip code:
$619
New York:
$3,075
(% of AGI for various income ranges: 2.1% for AGIs below $25k, 4.1% for AGIs $25k-50k, 10.8% for AGIs $50k-75k, 37.4% for AGIs $75k-100k, 119.5% for AGIs $100k-200k)
Ordinary dividends: $3,615 (reported on 6.7% of returns)
Here:
$3,615
State:
$11,095
(% of AGI for various income ranges: 4.2% for AGIs below $25k, 8.0% for AGIs $25k-50k, 39.3% for AGIs $50k-75k, 87.4% for AGIs $75k-100k, 377.4% for AGIs $100k-200k)
Net capital gain/loss in AGI: +$5,253 (reported on 6.6% of returns)
Here:
+$5,253
State:
+$44,925
(% of AGI for various income ranges: 1.3% for AGIs below $25k, 4.9% for AGIs $25k-50k, 28.5% for AGIs $50k-75k, 97.9% for AGIs $75k-100k, 332.6% for AGIs $100k-200k)
Profit/loss from business: +$5,930 (reported on 10.6% of returns)
Here:
+$5,930
State:
+$14,940
(% of AGI for various income ranges: 71.4% for AGIs below $25k, 84.0% for AGIs $25k-50k, 69.3% for AGIs $50k-75k, 113.2% for AGIs $75k-100k, 173.7% for AGIs $100k-200k)
Taxable individual retirement arrangement distribution: $11,912 (reported on 2.2% of returns)
12206:
$11,912
New York:
$19,609
(% of AGI for various income ranges: 8.6% for AGIs below $25k, 17.9% for AGIs $25k-50k, 63.0% for AGIs $50k-75k, 185.3% for AGIs $75k-100k, 311.1% for AGIs $100k-200k)
Total itemized deductions: $21,684 (reported on 2.6% of returns)
Here:
$21,684
State:
$39,326
(% of AGI for various income ranges: 48.7% for AGIs $25k-50k, 152.6% for AGIs $50k-75k, 366.3% for AGIs $75k-100k, 807.4% for AGIs $100k-200k)
Charity contributions: $7,008 (reported on 1.8% of returns)
Here:
$7,008
State:
$15,420
(% of AGI for various income ranges: 60.3% for AGIs $50k-75k, 67.9% for AGIs $75k-100k, 217.9% for AGIs $100k-200k)
Taxes paid: $7,084 (reported on 2.6% of returns)
12206:
$7,084
State:
$9,183
(% of AGI for various income ranges: 9.3% for AGIs $25k-50k, 54.3% for AGIs $50k-75k, 165.3% for AGIs $75k-100k, 272.6% for AGIs $100k-200k)
Earned income credit: $2,320 (reported on 33.3% of returns)
Here:
$2,320
State:
$2,138
(% of AGI for various income ranges: 129.4% for AGIs below $25k, 108.0% for AGIs $25k-50k)
Percentage of individuals using paid preparers for their 2020 taxes: 94.8%
Here:
95%
State:
95%
(% for various income ranges: 95.3% for AGIs below $25k, 94.7% for AGIs $25k-50k, 94.1% for AGIs $50k-75k, 93.1% for AGIs $75k-100k, 93.8% for AGIs $100k-200k, 100.0% for AGIs over 200k)
Averages for the 2012 tax year for zip code 12206, filed in 2013:
Average Adjusted Gross Income (AGI) in 2012: $31,108 (Individual Income Tax Returns)
Here:
$31,108
State:
$77,088
Salary/wage: $28,695 (reported on 88.5% of returns)
Here:
$28,695
State:
$60,593
(% of AGI for various income ranges: 80.8% for AGIs below $25k, 87.5% for AGIs $25k-50k, 82.6% for AGIs $50k-75k, 79.5% for AGIs $75k-100k, 77.2% for AGIs $100k-200k, 69.2% for AGIs over 200k)
Taxable interest for individuals: $583 (reported on 18.8% of returns)
This zip code:
$583
New York:
$3,125
(% of AGI for various income ranges: 0.2% for AGIs below $25k, 0.3% for AGIs $25k-50k, 0.4% for AGIs $50k-75k, 0.4% for AGIs $75k-100k, 0.4% for AGIs $100k-200k, 0.6% for AGIs over 200k)
Ordinary dividends: $2,850 (reported on 7.4% of returns)
Here:
$2,850
State:
$10,299
(% of AGI for various income ranges: 0.5% for AGIs below $25k, 0.4% for AGIs $25k-50k, 0.7% for AGIs $50k-75k, 1.1% for AGIs $75k-100k, 1.1% for AGIs $100k-200k, 0.8% for AGIs over 200k)
Net capital gain/loss in AGI: +$465 (reported on 5.3% of returns)
Here:
+$465
State:
+$42,474
(% of AGI for various income ranges: 0.1% for AGIs $50k-75k, 0.6% for AGIs $75k-100k)
Profit/loss from business: +$9,039 (reported on 10.0% of returns)
Here:
+$9,039
State:
+$16,168
(% of AGI for various income ranges: 6.7% for AGIs below $25k, 1.2% for AGIs $25k-50k, 1.8% for AGIs $50k-75k, 2.2% for AGIs $75k-100k, 3.4% for AGIs $100k-200k)
Taxable individual retirement arrangement distribution: $10,268 (reported on 3.1% of returns)
12206:
$10,268
New York:
$17,621
(% of AGI for various income ranges: 0.6% for AGIs below $25k, 0.6% for AGIs $25k-50k, 1.5% for AGIs $50k-75k, 1.7% for AGIs $75k-100k, 2.2% for AGIs $100k-200k)
Total itemized deductions: $17,339 (21% of AGI, reported on 13.4% of returns)
Here:
$17,339
State:
$34,985
Here:
20.9% of AGI
State:
21.3% of AGI
(% of AGI for various income ranges: 1.9% for AGIs below $25k, 5.2% for AGIs $25k-50k, 9.7% for AGIs $50k-75k, 11.9% for AGIs $75k-100k, 13.4% for AGIs $100k-200k, 10.9% for AGIs over 200k)
Charity contributions: $2,877 (reported on 10.4% of returns)
Here:
$2,877
State:
$5,572
(% of AGI for various income ranges: 0.2% for AGIs below $25k, 0.7% for AGIs $25k-50k, 1.4% for AGIs $50k-75k, 1.4% for AGIs $75k-100k, 1.7% for AGIs $100k-200k, 1.0% for AGIs over 200k)
Taxes paid: $7,959 (reported on 13.4% of returns)
12206:
$7,959
State:
$18,656
(% of AGI for various income ranges: 0.5% for AGIs below $25k, 1.7% for AGIs $25k-50k, 4.2% for AGIs $50k-75k, 5.4% for AGIs $75k-100k, 7.5% for AGIs $100k-200k, 7.1% for AGIs over 200k)
Earned income credit: $2,292 (reported on 39.1% of returns)
Here:
$2,292
State:
$2,230
(% of AGI for various income ranges: 10.6% for AGIs below $25k, 1.6% for AGIs $25k-50k)
Percentage of individuals using paid preparers for their 2012 taxes: 51.5%
Here:
51%
State:
66%
(% for various income ranges: 52.3% for AGIs below $25k, 48.1% for AGIs $25k-50k, 52.5% for AGIs $50k-75k, 50.0% for AGIs $75k-100k, 62.5% for AGIs $100k-200k, 50.0% for AGIs over 200k)
Averages for the 2004 tax year for zip code 12206, filed in 2005:
Average Adjusted Gross Income (AGI) in 2004: $26,277 (Individual Income Tax Returns)
Here:
$26,277
State:
$59,519
Salary/wage: $23,930 (reported on 89.5% of returns)
Here:
$23,930
State:
$50,673
(% of AGI for various income ranges: 88.0% for AGIs below $10k, 87.3% for AGIs $10k-25k, 90.7% for AGIs $25k-50k, 85.5% for AGIs $50k-75k, 79.3% for AGIs $75k-100k, 45.6% for AGIs over 100k)
Taxable interest for individuals: $835 (reported on 27.0% of returns)
This zip code:
$835
New York:
$2,377
(% of AGI for various income ranges: 1.4% for AGIs below $10k, 0.7% for AGIs $10k-25k, 0.5% for AGIs $25k-50k, 1.1% for AGIs $50k-75k, 0.5% for AGIs $75k-100k, 1.7% for AGIs over 100k)
Taxable dividends: $2,231 (reported on 9.6% of returns)
Here:
$2,231
State:
$5,394
(% of AGI for various income ranges: 0.7% for AGIs below $10k, 0.4% for AGIs $10k-25k, 0.3% for AGIs $25k-50k, 0.6% for AGIs $50k-75k, 1.0% for AGIs $75k-100k, 2.9% for AGIs over 100k)
Net capital gain/loss: +$5,649 (reported on 6.5% of returns)
Here:
+$5,649
State:
+$23,581
(% of AGI for various income ranges: -0.2% for AGIs below $10k, -0.0% for AGIs $10k-25k, 0.3% for AGIs $25k-50k, 0.8% for AGIs $50k-75k, 1.8% for AGIs $75k-100k, 7.2% for AGIs over 100k)
Profit/loss from business: +$6,015 (reported on 8.0% of returns)
Here:
+$6,015
State:
+$13,809
(% of AGI for various income ranges: 6.9% for AGIs below $10k, 2.5% for AGIs $10k-25k, 0.7% for AGIs $25k-50k, 0.9% for AGIs $50k-75k, 3.3% for AGIs $75k-100k, 1.6% for AGIs over 100k)
IRA payment deduction: $2,295 (reported on 1.4% of returns)
12206:
$2,295
New York:
$3,115
Total itemized deductions: $13,156 (20% of AGI, reported on 14.5% of returns)
Here:
$13,156
State:
$25,864
Here:
20.4% of AGI
State:
21.9% of AGI
(% of AGI for various income ranges: 3.3% for AGIs below $10k, 2.5% for AGIs $10k-25k, 6.1% for AGIs $25k-50k, 11.4% for AGIs $50k-75k, 12.6% for AGIs $75k-100k, 11.7% for AGIs over 100k)
Charity contributions deductions: $2,420 (3% of AGI, reported on 12.2% of returns)
Here:
$2,420
State:
$4,439
Here:
3.4% of AGI
State:
3.6% of AGI
(% of AGI for various income ranges: 0.2% for AGIs below $10k, 0.4% for AGIs $10k-25k, 0.9% for AGIs $25k-50k, 1.6% for AGIs $50k-75k, 1.9% for AGIs $75k-100k, 2.1% for AGIs over 100k)
Total tax: $3,255 (reported on 59.1% of returns)
12206:
$3,255
State:
$11,730
(% of AGI for various income ranges: 1.7% for AGIs below $10k, 3.3% for AGIs $10k-25k, 6.9% for AGIs $25k-50k, 10.2% for AGIs $50k-75k, 11.7% for AGIs $75k-100k, 11.4% for AGIs over 100k)
Earned income credit: $1,827 (reported on 36.2% of returns)
Here:
$1,827
State:
$1,757
Percentage of individuals using paid preparers for their 2004 taxes: 61.9%
Here:
62%
State:
67%
(% for various income ranges: 61.1% for AGIs below $10k, 65.4% for AGIs $10k-25k, 59.2% for AGIs $25k-50k, 55.1% for AGIs $50k-75k, 61.9% for AGIs $75k-100k, 64.3% for AGIs over 100k)
Likely homosexual households (counted as self-reported same-sex unmarried-partner households)
Lesbian couples: 0.0% of all households
Gay men: 0.5% of all households
Household received Food Stamps/SNAP in the past 12 months: 2,776 Household did not receive Food Stamps/SNAP in the past 12 months: 3,961
Women who had a birth in the past 12 months: 124 (0 now married, 129 unmarried) Women who did not have a birth in the past 12 months: 3,780 (714 now married, 3,098 unmarried)
Housing units in zip code 12206 with a mortgage: 844 (85 second mortgage, 38 both second mortgage and home equity loan) Median monthly owner costs for units with a mortgage: $1,405 Median monthly owner costs for units without a mortgage: $530
Residents with income below the poverty level in 2022:
This zip code:
42.4%
Whole state:
14.3%
Residents with income below 50% of the poverty level in 2022:
This zip code:
20.7%
Whole state:
6.8%
Median number of rooms in houses and condos:
Here:
6.3
State:
6.3
Median number of rooms in apartments:
Here:
4.5
State:
3.8
Notable locations in this zip code not listed on our city pages
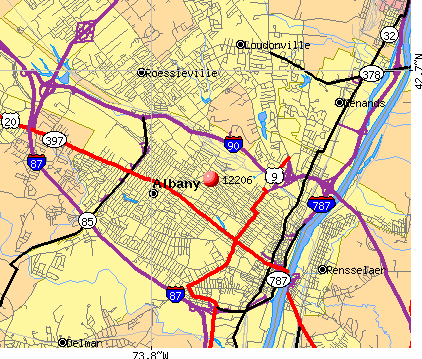
Notable locations in zip code 12206: Bleecker Stadium (A), Albany Guardian Society Home For Aged Women (B), Salvation Army Social Service Center (C), Charles R Joy Library (D), Albany Fire Department Engine 7 (E). Display/hide their locations on the map
Shopping Centers: Central Plaza Shopping Center (1), Colvin Central Plaza Shopping Center (2), Westgate Shopping Center (3). Display/hide their locations on the map
Churches in zip code 12206 include: Levine's Memorial Chapel (A), West End Presbyterian Church (B), Church of the Blessed Sacrament (C), Saint Georges Lithuanian Roman Catholic Church (D), Albany United Methodist Church (E), Saint John's Evangelical Lutheran Church (F), First Unitarian Universalist Church (G), Mount Pleasant Baptist Church (H), Virgin Mary of Czestochowa Church (I). Display/hide their locations on the map
693 married couples with children.
2,298 single-parent households (268 men, 2,030 women).
80.3% of residents of 12206 zip code speak English at home.
7.5% of residents speak Spanish at home (49% very well, 42% well, 9% not at all).
5.2% of residents speak other Indo-European language at home (23% very well, 53% well, 20% not well, 3% not at all).
3.9% of residents speak Asian or Pacific Island language at home (61% very well, 30% well, 6% not well, 2% not at all).
2.9% of residents speak other language at home (85% very well, 13% well, 2% not well).
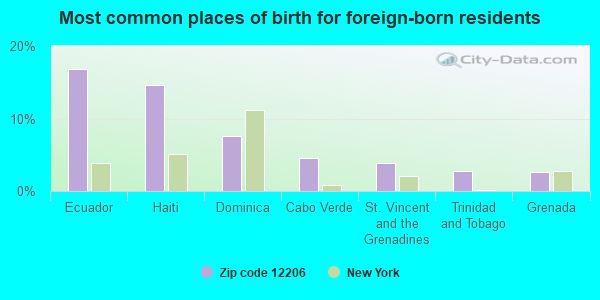
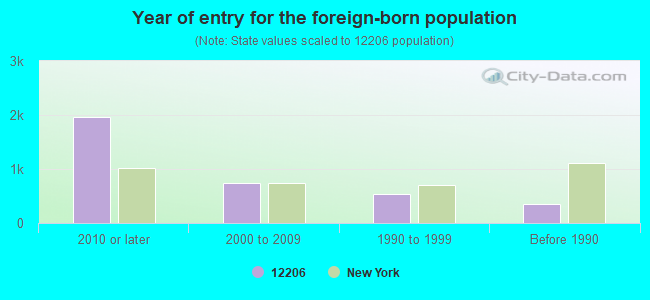
Foreign born population: 3,216 (22.1%) (46.7% of them are naturalized citizens)
Major facilities with environmental interests located in this zip code:
HESS CORP- HESS STATION #32210 (812 CENTRAL AVE in ALBANY, NY)
STATE MASTER (New York facility tracking) - AIR PROGRAM, Conditionally Exempt Small Quantity Generators, less than 100 kg/month of hazardous waste (Resource Conservation and Recovery Act (tracking hazardous waste)) - notification Business SIC classification: GASOLINE SERVICE STATIONS Organizations: HESS CORPORATION, AMERADA HESS CORP (CONTACT/OWNER)
Alternative names: AMERADA HESS CORP- HESS STATION #32210, AMERADA HESS STATION 32210
A-1 WASH N CLEAN (610 CLINTON AVE in ALBANY, NY)
STATE MASTER (New York facility tracking) - AIR PROGRAM, HAZARDOUS WASTE PROGRAM Small Quantity Generators, between 100 kg and 1000 kg of hazardous waste/month (Resource Conservation and Recovery Act (tracking hazardous waste)) Business SIC classification: DRYCLEANING PLANTS, EXCEPT RUG CLEANING Business NAICS classification: DRYCLEANING AND LAUNDRY SERVICES (EXCEPT COIN-OPERATED). Organizations: A-1 WASH & CLEAN (LEGALLY RESPONSIBLE PARTY)
, COIN METER LAUNDRIES OF ALBANY INC (LEGALLY RESPONSIBLE PARTY)
Alternative names: A1 WASH N CLEAN
COLONIAL CLEANERS (177 NORTH ALLEN ST in ALBANY, NY)
AIR SYNTHETIC MINOR (AIRS/AFS) STATE MASTER (New York facility tracking) - AIR PROGRAM Small Quantity Generators, between 100 kg and 1000 kg of hazardous waste/month (Resource Conservation and Recovery Act (tracking hazardous waste)) Business SIC classification: DRYCLEANING PLANTS, EXCEPT RUG CLEANING Business NAICS classification: DRYCLEANING AND LAUNDRY SERVICES (EXCEPT COIN-OPERATED). Organizations: COLONIAL CLEANERS LLC (LEGALLY RESPONSIBLE PARTY)
ALBANY DODGE (770 CENTRAL AVENUE in ALBANY, NY)
STATE MASTER (New York facility tracking) - AIR PROGRAM, HAZARDOUS WASTE PROGRAM Small Quantity Generators, between 100 kg and 1000 kg of hazardous waste/month (Resource Conservation and Recovery Act (tracking hazardous waste)) Business SIC and NAICS classification: BOAT DEALERS Organizations: ALBANY DODGE INC (LEGALLY RESPONSIBLE PARTY)
ARMORY GARAGE INC (926 CENTRAL AVE in ALBANY, NY)
STATE MASTER (New York facility tracking) - AIR PROGRAM, 401 CERTIFICATION, SECTION 404 PERMITTING, AIR PROGRAM, HAZARDOUS WASTE PROGRAM Small Quantity Generators, between 100 kg and 1000 kg of hazardous waste/month (Resource Conservation and Recovery Act (tracking hazardous waste)) Business SIC classification: MOTOR VEHICLE DEALERS (NEW AND USED) Business NAICS classification: NEW CAR DEALERS.
COLBY BODY & FENDER WORKS (709 3RD ST in ALBANY, NY)
STATE MASTER (New York facility tracking) - AIR PROGRAM, HAZARDOUS WASTE PROGRAM Conditionally Exempt Small Quantity Generators, less than 100 kg/month of hazardous waste (Resource Conservation and Recovery Act (tracking hazardous waste)) Organizations: COLBY BODY & FENDER WORKS INC (LEGALLY RESPONSIBLE PARTY)
HOSPITALITY HOUSE ( in ALBANY, NY)
(National Center for Education Statistics) - STATE ID-010100890149 Organizations: ALBANY CITY SD (SCHOOL DISTRICT)
ATC ASSOCIATES, INC (10 COLVIN AVE in ALBANY, NY)
ENFORCEMENT/COMPLIANCE ACTIVITY (Integrated Compliance Information System) COMPLIANCE ACTIVITY (Tracking inspections of insecticide, fungicide, and rodenticide, and toxic substances) Business SIC classification: BUSINESS SERVICES; JOB TRAINING AND VOCATIONAL REHABILITATION SERVICES Alternative names: ATC ASSICIATES, INC., ATC GROUP SERVICES
CITGO STATION (589 CENTRAL AVE in ALBANY, NY)
(Resource Conservation and Recovery Act (tracking hazardous waste)) Organizations: RED KAP SALES (CONTACT/OPERATOR)
ALBANY COACH WORKS (40-B WATERVLIET AVE in ALBANY, NY)
(Resource Conservation and Recovery Act (tracking hazardous waste))
ALBANY CSD - ABROOKIN VOTEC CENTER (99 KENT ST in ALBANY, NY)
Small Quantity Generators, between 100 kg and 1000 kg of hazardous waste/month (Resource Conservation and Recovery Act (tracking hazardous waste)) Organizations: ALBANY CITY SCHOOL DISTRICT (CONTACT/OWNER)
Alternative names: ALBANY PUBLIC SCHOOLS
ALBANY CYTOPATH LABS INC (214 CENTRAL AVE in ALBANY, NY)
(Resource Conservation and Recovery Act (tracking hazardous waste))
ALBANY PUBLIC SCHOOLS (270 CENTRAL AVE in ALBANY, NY)
(Resource Conservation and Recovery Act (tracking hazardous waste))
Housing units lacking complete plumbing facilities: 2.9% Housing units lacking complete kitchen facilities: 5.3%
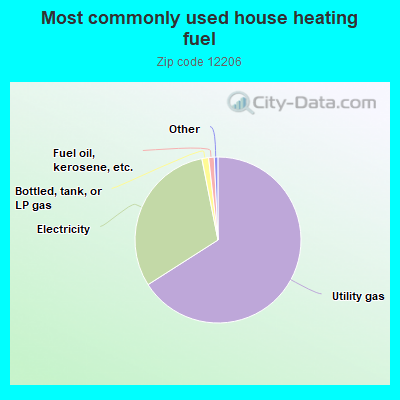
65.9%Utility gas
30.9%Electricity
1.3%Bottled, tank, or LP gas
1.1%Fuel oil, kerosene, etc.
Population in 1990: 17,230.
Place of birth for U.S.-born residents:
This state: 9,098
Northeast: 830
Midwest: 111
South: 1,021
West: 58
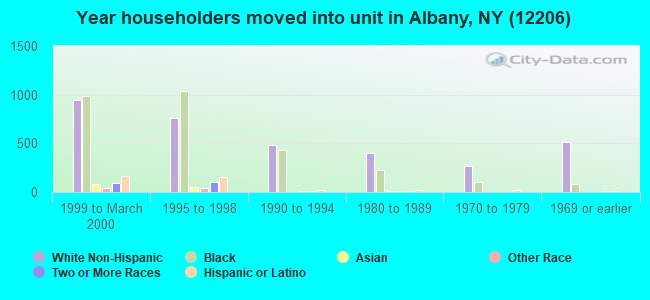
45% of the 12206 zip code residents lived in the same house 5 years ago. Out of people who lived in different houses, 71% lived in this county. Out of people who lived in different counties, 50% lived in New York.
77% of the 12206 zip code residents lived in the same house 1 year ago. Out of people who lived in different houses, 63% moved from this county. Out of people who lived in different houses, 28% moved from different county within same state. Out of people who lived in different houses, 8% moved from different state.
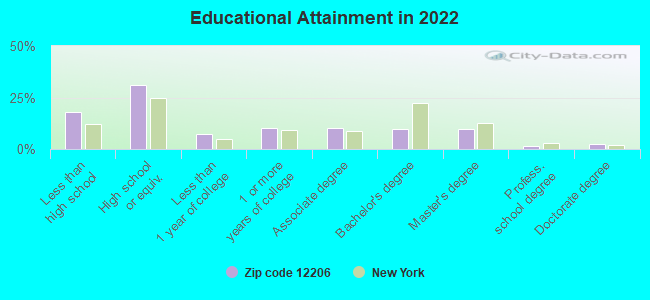
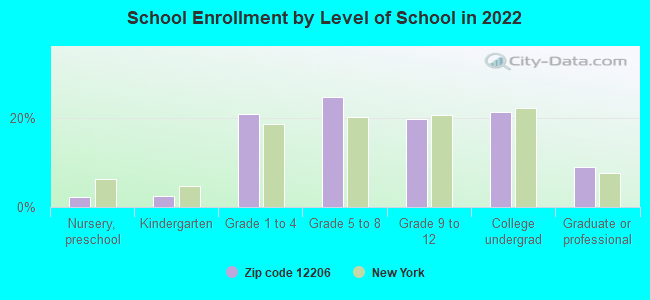
Private vs. public school enrollment:
Students in private schools in grades 1 to 8 (elementary and middle school): 205
Here:
10.2%
New York:
15.6%
Students in private schools in grades 9 to 12 (high school): 92
Here:
10.5%
New York:
15.0%
Students in private undergraduate colleges: 201
Here:
21.6%
New York:
39.2%
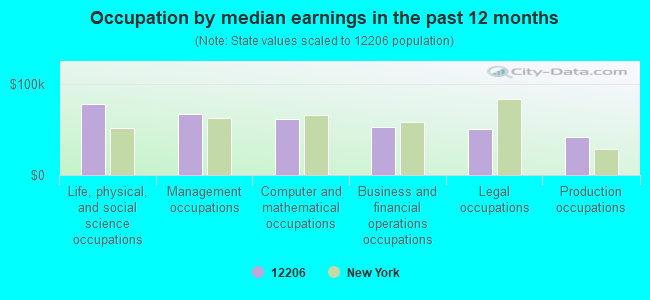
Occupation by median earnings in the past 12 months ($)
77,570Life, physical, and social science occupations
67,083Management occupations
61,423Computer and mathematical occupations
53,227Business and financial operations occupations
50,027Legal occupations
41,488Production occupations
Companies with federal contracts located in this zip code:
MOHAWK VALLEY UTILITY CONSTRUC (136 N LAKE AVE in ALBANY, NY; small business) : $1,002,374 in 6 contractsfrom 2000 to 2002
Contracts for Maintenance, Repair or Alteration of Real Property -- Miscellaneous Buildings, Maintenance, Repair or Alteration of Real Property -- Other Utilities by Air Force, Navy Signed by year:2000: $916,030; 2001: $82,549; 2002: $3,795; 2003: $0; 2004: $0; 2005: $0; 2006: $0.
Biggest contracts:
$787,300 with Air Force for Maintenance, Repair or Alteration of Real Property -- Miscellaneous Buildings. Taking place in MA. Signed on 2000-09-27. Completion date: 2001-06-20.
$128,730 with Navy for Maintenance, Repair or Alteration of Real Property -- Other Utilities. Taking place in RI. Signed on 2000-09-27. Completion date: 2001-03-11.
$82,236 with Air Force for Maintenance, Repair or Alteration of Real Property -- Miscellaneous Buildings. Taking place in MA. Signed on 2001-07-10. Completion date: 2001-11-30.
$3,795, same as above.Signed on 2002-04-05. Completion date: 2002-04-30.
NORTHEASTERN ASSOC OF THE BLI (301 WASHINGTON AVENUE in ALBANY, NY) : $221,096 in 5 contractsfrom 2000 to 2002
Contracts for Hosiery, Handwear, and Clothing Accessories, Women's by Defense Logistics Agency Signed by year:2000: $103,344; 2001: $72,852; 2002: $44,900; 2003: $0; 2004: $0; 2005: $0; 2006: $0.
Biggest contracts:
$72,852 with Defense Logistics Agency for Hosiery, Handwear, and Clothing Accessories, Women's. Signed on 2001-04-11. Completion date: 2002-06-27.
$53,880, same as above.Signed on 2000-08-09. Completion date: 2001-10-01.
$49,464, same as above.Signed on 2000-03-27. Completion date: 2000-06-15.
$44,900, same as above.Signed on 2002-02-04. Completion date: 2003-04-23.
CRISAFULLI BROS PLUMBING & HEA (520 LIVINGSTON AVE in ALBANY, NY; small business) : $19,460 in 2 contractsin 2004
$9,730 with Navy for Maintenance, Repair or Alteration of Real Property -- Miscellaneous Buildings. Signed on 2004-07-01. Completion date: 2004-08-16.
$9,730 with Navy for Maintenance, Repair or Alteration of Real Property -- Other Administrative Facilities and Service Buildings. Signed on 2004-07-01. Completion date: 2004-08-15.
Top industries in this zip code by the number of employees in 2005:
Health Care and Social Assistance: Home Health Care Services (500-999 employees: 1 establishment, 100-249 employees: 1 establishment)
Finance and Insurance: Direct Health and Medical Insurance Carriers (500-999: 1)
Health Care and Social Assistance: Child and Youth Services (250-499: 1, 20-49: 1, 10-19: 2)
Health Care and Social Assistance: Offices of Physicians (except Mental Health Specialists) (50-99: 2, 20-49: 7, 5-9: 2, 1-4: 4)
Administrative and Support and Waste Management and Remediation Services: Security Guards and Patrol Services (250-499: 1)
2002 - 2018 National Fire Incident Reporting System (NFIRS) incidents
Based on the data from the years 2002 - 2018 the average number of fire incidents per year is 77. The highest number of fire incidents - 139 took place in 2002, and the least - 0 in 2008. The data has a decreasing trend.
When looking into fire subcategories, the most reports belonged to: Structure Fires (40.6%), and Other (26.1%).
Fire incident types reported to NFIRS in Zip Code 12206

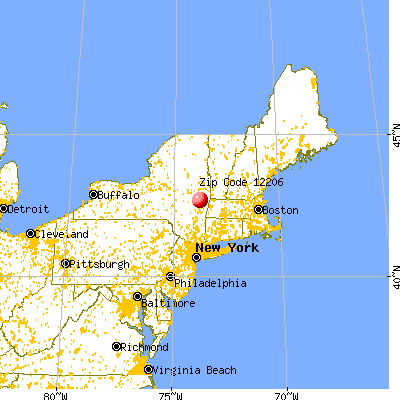


 Nearest zip codes: 12210, 12211, 12208, 12209, 12207, 12222.


 Based on the data from the years 2002 - 2018 the average number of fire incidents per year is 77. The highest number of fire incidents - 139 took place in 2002, and the least - 0 in 2008. The data has a decreasing trend.
 When looking into fire subcategories, the most reports belonged to: Structure Fires (40.6%), and Other (26.1%).