Estimated zip code population in 2022: 22,761 Zip code population in 2010: 20,702 Zip code population in 2000: 21,307
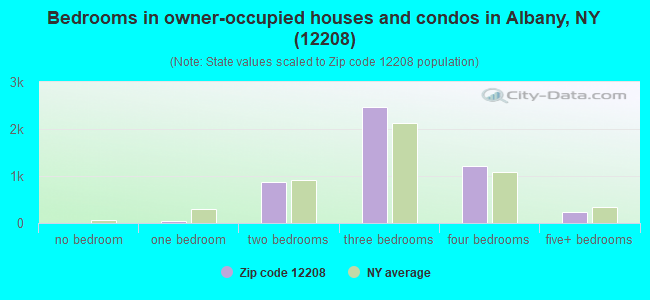
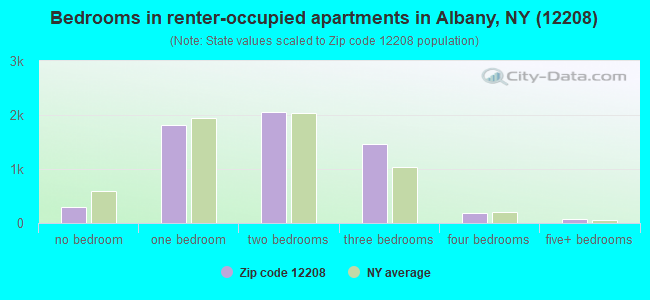
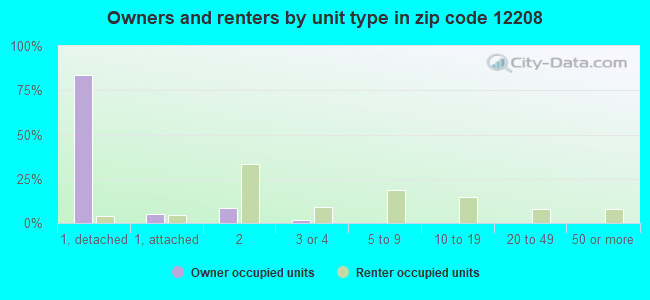
Houses and condos: 11,817 Renter-occupied apartments: 5,923
% of renters here:
55%
State:
46%
March 2022 cost of living index in zip code 12208: 106.7 (more than average, U.S. average is 100)
Land area: 4.2 sq. mi. Water area: 0.0 sq. mi.
Population density: 5,427 people per square mile
(average).
OSM Map
General Map
Google Map
MSN Map
OSM Map
General Map
Google Map
MSN Map
OSM Map
General Map
Google Map
MSN Map
OSM Map
General Map
Google Map
MSN Map
Please wait while loading the map...
Real estate property taxes paid for housing units in 2022:
This zip code:
2.4% ($6,026)
New York:
1.5% ($6,180)
Median real estate property taxes paid for housing units with mortgages in 2022: $6,432 (2.5%) Median real estate property taxes paid for housing units with no mortgage in 2022: $5,090 (2.1%)
Averages for the 2020 tax year for zip code 12208, filed in 2021:
Average Adjusted Gross Income (AGI) in 2020: $64,666 (Individual Income Tax Returns)
Here:
$64,666
State:
$90,930
Salary/wage: $55,554 (reported on 83.1% of returns)
Here:
$55,554
State:
$72,104
(% of AGI for various income ranges: 1172.8% for AGIs below $25k, 3666.9% for AGIs $25k-50k, 6603.7% for AGIs $50k-75k, 9648.0% for AGIs $75k-100k, 17780.7% for AGIs $100k-200k, 70969.0% for AGIs over 200k)
Taxable interest for individuals: $1,186 (reported on 35.1% of returns)
This zip code:
$1,186
New York:
$3,075
(% of AGI for various income ranges: 15.1% for AGIs below $25k, 13.1% for AGIs $25k-50k, 41.6% for AGIs $50k-75k, 57.9% for AGIs $75k-100k, 149.5% for AGIs $100k-200k, 1518.0% for AGIs over 200k)
Ordinary dividends: $5,041 (reported on 21.9% of returns)
Here:
$5,041
State:
$11,095
(% of AGI for various income ranges: 34.4% for AGIs below $25k, 30.0% for AGIs $25k-50k, 75.5% for AGIs $50k-75k, 153.8% for AGIs $75k-100k, 428.5% for AGIs $100k-200k, 4438.0% for AGIs over 200k)
Net capital gain/loss in AGI: +$9,652 (reported on 19.6% of returns)
Here:
+$9,652
State:
+$44,925
(% of AGI for various income ranges: 12.1% for AGIs below $25k, 23.8% for AGIs $25k-50k, 65.0% for AGIs $50k-75k, 202.3% for AGIs $75k-100k, 594.9% for AGIs $100k-200k, 11568.0% for AGIs over 200k)
Profit/loss from business: +$13,407 (reported on 11.8% of returns)
Here:
+$13,407
State:
+$14,940
(% of AGI for various income ranges: 71.8% for AGIs below $25k, 46.1% for AGIs $25k-50k, 125.4% for AGIs $50k-75k, 193.8% for AGIs $75k-100k, 651.0% for AGIs $100k-200k, 5525.0% for AGIs over 200k)
Taxable individual retirement arrangement distribution: $14,670 (reported on 7.9% of returns)
12208:
$14,670
New York:
$19,609
(% of AGI for various income ranges: 35.9% for AGIs below $25k, 52.5% for AGIs $25k-50k, 128.2% for AGIs $50k-75k, 232.8% for AGIs $75k-100k, 523.0% for AGIs $100k-200k, 2386.0% for AGIs over 200k)
Self-employed (Keogh) retirement plans: $20,940 (reported on 0.5% of returns)
12208:
$20,940
New York:
$32,497
(% of AGI for various income ranges: 71.1% for AGIs $100k-200k, 464.0% for AGIs over 200k)
Total itemized deductions: $25,304 (reported on 8.1% of returns)
Here:
$25,304
State:
$39,326
(% of AGI for various income ranges: 35.9% for AGIs below $25k, 72.7% for AGIs $25k-50k, 287.2% for AGIs $50k-75k, 593.7% for AGIs $75k-100k, 716.2% for AGIs $100k-200k, 5123.0% for AGIs over 200k)
Charity contributions: $9,025 (reported on 6.1% of returns)
Here:
$9,025
State:
$15,420
(% of AGI for various income ranges: 3.0% for AGIs below $25k, 7.9% for AGIs $25k-50k, 27.7% for AGIs $50k-75k, 72.1% for AGIs $75k-100k, 168.4% for AGIs $100k-200k, 3200.0% for AGIs over 200k)
Taxes paid: $8,704 (reported on 8.1% of returns)
12208:
$8,704
State:
$9,183
(% of AGI for various income ranges: 9.8% for AGIs below $25k, 22.9% for AGIs $25k-50k, 121.0% for AGIs $50k-75k, 242.4% for AGIs $75k-100k, 305.2% for AGIs $100k-200k, 824.0% for AGIs over 200k)
Earned income credit: $1,927 (reported on 11.8% of returns)
Here:
$1,927
State:
$2,138
(% of AGI for various income ranges: 62.2% for AGIs below $25k, 47.7% for AGIs $25k-50k)
Percentage of individuals using paid preparers for their 2020 taxes: 94.4%
Here:
94%
State:
95%
(% for various income ranges: 92.8% for AGIs below $25k, 95.7% for AGIs $25k-50k, 95.4% for AGIs $50k-75k, 92.7% for AGIs $75k-100k, 94.1% for AGIs $100k-200k, 97.1% for AGIs over 200k)
Averages for the 2012 tax year for zip code 12208, filed in 2013:
Average Adjusted Gross Income (AGI) in 2012: $53,607 (Individual Income Tax Returns)
Here:
$53,607
State:
$77,088
Salary/wage: $46,654 (reported on 84.6% of returns)
Here:
$46,654
State:
$60,593
(% of AGI for various income ranges: 79.2% for AGIs below $25k, 84.9% for AGIs $25k-50k, 76.5% for AGIs $50k-75k, 74.1% for AGIs $75k-100k, 72.7% for AGIs $100k-200k, 52.6% for AGIs over 200k)
Taxable interest for individuals: $1,005 (reported on 39.8% of returns)
This zip code:
$1,005
New York:
$3,125
(% of AGI for various income ranges: 1.0% for AGIs below $25k, 0.5% for AGIs $25k-50k, 0.5% for AGIs $50k-75k, 0.7% for AGIs $75k-100k, 0.8% for AGIs $100k-200k, 1.0% for AGIs over 200k)
Ordinary dividends: $4,210 (reported on 22.6% of returns)
Here:
$4,210
State:
$10,299
(% of AGI for various income ranges: 1.7% for AGIs below $25k, 1.1% for AGIs $25k-50k, 1.2% for AGIs $50k-75k, 1.4% for AGIs $75k-100k, 2.0% for AGIs $100k-200k, 3.5% for AGIs over 200k)
Net capital gain/loss in AGI: +$3,554 (reported on 16.2% of returns)
Here:
+$3,554
State:
+$42,474
(% of AGI for various income ranges: 0.1% for AGIs $25k-50k, 0.2% for AGIs $50k-75k, 0.5% for AGIs $75k-100k, 1.2% for AGIs $100k-200k, 4.8% for AGIs over 200k)
Profit/loss from business: +$15,140 (reported on 11.5% of returns)
Here:
+$15,140
State:
+$16,168
(% of AGI for various income ranges: 4.4% for AGIs below $25k, 1.7% for AGIs $25k-50k, 2.3% for AGIs $50k-75k, 1.7% for AGIs $75k-100k, 2.9% for AGIs $100k-200k, 8.2% for AGIs over 200k)
Taxable individual retirement arrangement distribution: $12,686 (reported on 9.0% of returns)
12208:
$12,686
New York:
$17,621
(% of AGI for various income ranges: 2.1% for AGIs below $25k, 1.4% for AGIs $25k-50k, 1.8% for AGIs $50k-75k, 2.2% for AGIs $75k-100k, 2.0% for AGIs $100k-200k, 3.7% for AGIs over 200k)
Self-employment retirement plans: $18,138 (reported on 0.8% of returns)
12208:
$18,138
New York:
$27,330
(% of AGI for various income ranges: 0.3% for AGIs $25k-50k, 0.3% for AGIs $100k-200k, 1.1% for AGIs over 200k)
Total itemized deductions: $20,771 (21% of AGI, reported on 33.7% of returns)
Here:
$20,771
State:
$34,985
Here:
20.9% of AGI
State:
21.3% of AGI
(% of AGI for various income ranges: 7.2% for AGIs below $25k, 8.3% for AGIs $25k-50k, 13.2% for AGIs $50k-75k, 15.1% for AGIs $75k-100k, 15.7% for AGIs $100k-200k, 15.2% for AGIs over 200k)
Charity contributions: $2,952 (reported on 27.9% of returns)
Here:
$2,952
State:
$5,572
(% of AGI for various income ranges: 0.5% for AGIs below $25k, 0.7% for AGIs $25k-50k, 1.3% for AGIs $50k-75k, 1.5% for AGIs $75k-100k, 1.9% for AGIs $100k-200k, 3.0% for AGIs over 200k)
Taxes paid: $10,931 (reported on 33.6% of returns)
12208:
$10,931
State:
$18,656
(% of AGI for various income ranges: 2.3% for AGIs below $25k, 3.6% for AGIs $25k-50k, 6.4% for AGIs $50k-75k, 7.7% for AGIs $75k-100k, 9.1% for AGIs $100k-200k, 9.0% for AGIs over 200k)
Earned income credit: $1,860 (reported on 14.2% of returns)
Here:
$1,860
State:
$2,230
(% of AGI for various income ranges: 4.5% for AGIs below $25k, 0.6% for AGIs $25k-50k)
Percentage of individuals using paid preparers for their 2012 taxes: 46.8%
Here:
47%
State:
66%
(% for various income ranges: 43.2% for AGIs below $25k, 42.3% for AGIs $25k-50k, 50.3% for AGIs $50k-75k, 52.2% for AGIs $75k-100k, 54.4% for AGIs $100k-200k, 76.2% for AGIs over 200k)
Averages for the 2004 tax year for zip code 12208, filed in 2005:
Average Adjusted Gross Income (AGI) in 2004: $45,351 (Individual Income Tax Returns)
Here:
$45,351
State:
$59,519
Salary/wage: $39,977 (reported on 84.5% of returns)
Here:
$39,977
State:
$50,673
(% of AGI for various income ranges: 105.2% for AGIs below $10k, 78.8% for AGIs $10k-25k, 84.8% for AGIs $25k-50k, 79.3% for AGIs $50k-75k, 75.8% for AGIs $75k-100k, 61.9% for AGIs over 100k)
Taxable interest for individuals: $1,396 (reported on 55.1% of returns)
This zip code:
$1,396
New York:
$2,377
(% of AGI for various income ranges: 5.8% for AGIs below $10k, 2.4% for AGIs $10k-25k, 1.3% for AGIs $25k-50k, 1.4% for AGIs $50k-75k, 1.3% for AGIs $75k-100k, 1.9% for AGIs over 100k)
Taxable dividends: $3,127 (reported on 27.9% of returns)
Here:
$3,127
State:
$5,394
(% of AGI for various income ranges: 4.0% for AGIs below $10k, 1.4% for AGIs $10k-25k, 0.9% for AGIs $25k-50k, 1.2% for AGIs $50k-75k, 1.6% for AGIs $75k-100k, 3.2% for AGIs over 100k)
Net capital gain/loss: +$9,335 (reported on 21.6% of returns)
Here:
+$9,335
State:
+$23,581
(% of AGI for various income ranges: -1.1% for AGIs below $10k, 0.4% for AGIs $10k-25k, 0.6% for AGIs $25k-50k, 0.9% for AGIs $50k-75k, 2.3% for AGIs $75k-100k, 11.2% for AGIs over 100k)
Profit/loss from business: +$13,251 (reported on 11.0% of returns)
Here:
+$13,251
State:
+$13,809
(% of AGI for various income ranges: 5.9% for AGIs below $10k, 3.2% for AGIs $10k-25k, 1.7% for AGIs $25k-50k, 1.4% for AGIs $50k-75k, 3.3% for AGIs $75k-100k, 5.0% for AGIs over 100k)
IRA payment deduction: $2,775 (reported on 2.4% of returns)
12208:
$2,775
New York:
$3,115
(% of AGI for various income ranges: 0.2% for AGIs $10k-25k, 0.3% for AGIs $25k-50k, 0.1% for AGIs $50k-75k, 0.1% for AGIs $75k-100k, 0.1% for AGIs over 100k)
Self-employed pension: $12,852 (reported on 1.1% of returns)
Here:
$12,852
New York:
$19,016
(% of AGI for various income ranges: 0.1% for AGIs $10k-25k, 0.1% for AGIs $50k-75k, 0.2% for AGIs $75k-100k, 0.7% for AGIs over 100k)
Total itemized deductions: $17,247 (20% of AGI, reported on 32.7% of returns)
Here:
$17,247
State:
$25,864
Here:
20.3% of AGI
State:
21.9% of AGI
(% of AGI for various income ranges: 9.6% for AGIs below $10k, 6.1% for AGIs $10k-25k, 9.2% for AGIs $25k-50k, 13.5% for AGIs $50k-75k, 15.4% for AGIs $75k-100k, 14.4% for AGIs over 100k)
Charity contributions deductions: $2,884 (3% of AGI, reported on 29.6% of returns)
Here:
$2,884
State:
$4,439
Here:
3.2% of AGI
State:
3.6% of AGI
(% of AGI for various income ranges: 0.4% for AGIs below $10k, 0.6% for AGIs $10k-25k, 1.1% for AGIs $25k-50k, 1.8% for AGIs $50k-75k, 2.1% for AGIs $75k-100k, 2.8% for AGIs over 100k)
Total tax: $6,836 (reported on 79.1% of returns)
12208:
$6,836
State:
$11,730
(% of AGI for various income ranges: 2.1% for AGIs below $10k, 4.7% for AGIs $10k-25k, 8.4% for AGIs $25k-50k, 10.9% for AGIs $50k-75k, 11.4% for AGIs $75k-100k, 17.5% for AGIs over 100k)
Earned income credit: $1,358 (reported on 11.1% of returns)
Here:
$1,358
State:
$1,757
Percentage of individuals using paid preparers for their 2004 taxes: 51.5%
Here:
51%
State:
67%
(% for various income ranges: 45.8% for AGIs below $10k, 50.6% for AGIs $10k-25k, 49.1% for AGIs $25k-50k, 54.7% for AGIs $50k-75k, 57.2% for AGIs $75k-100k, 62.3% for AGIs over 100k)
Likely homosexual households (counted as self-reported same-sex unmarried-partner households)
Lesbian couples: 0.0% of all households
Gay men: 0.2% of all households
Household received Food Stamps/SNAP in the past 12 months: 1,175 Household did not receive Food Stamps/SNAP in the past 12 months: 9,511
Women who had a birth in the past 12 months: 279 (228 now married, 49 unmarried) Women who did not have a birth in the past 12 months: 6,665 (1,478 now married, 5,232 unmarried)
Housing units in zip code 12208 with a mortgage: 3,187 (269 second mortgage, 267 both second mortgage and home equity loan) Houses without a mortgage: 267
Median monthly owner costs for units with a mortgage: $1,813 Median monthly owner costs for units without a mortgage: $796
Residents with income below the poverty level in 2022:
This zip code:
19.5%
Whole state:
14.3%
Residents with income below 50% of the poverty level in 2022:
This zip code:
5.2%
Whole state:
6.8%
Median number of rooms in houses and condos:
Here:
6.7
State:
6.3
Median number of rooms in apartments:
Here:
4.1
State:
3.8
Notable locations in this zip code not listed on our city pages
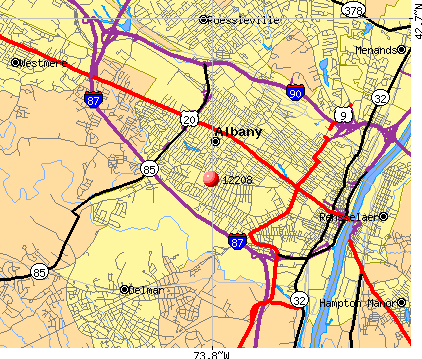
Notable locations in zip code 12208: Capital Hills at Albany (A), Boys Club of Albany (B), Saint Vincent's Community Center (C), Lutheran Women's Home For The Aged (D), Pine Hill Branch Albany Public Library (E), Father Charles Building (F), Bishop Cusack Memorial Nurses Home (G), Saint Teresa of Avila Auditorium (H), Albany Fire Department Engine 11 (I), Villa Mary Immaculate Nursing Home (J), Albany Division 1 Police Station (K). Display/hide their locations on the map
Churches in zip code 12208 include: Madison Avenue Baptist Church (A), Saint Catherine of Siena Roman Catholic Church (B), Saint Teresa of Avila Roman Catholic Church (C), Temple Israel (D), Bethany Reformed Church (E), Saint Vincent De Paul Roman Catholic Church (F), Emmaus United Methodist Church (G), First Congregational Church (H), First Church of Christ Scientist (I). Display/hide their locations on the map
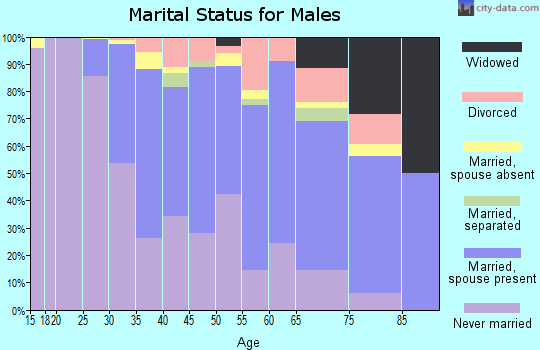
1,608 married couples with children.
731 single-parent households (199 men, 532 women).
84.6% of residents of 12208 zip code speak English at home.
2.0% of residents speak Spanish at home (85% very well, 12% well, 3% not well).
7.0% of residents speak other Indo-European language at home (61% very well, 30% well, 7% not well, 2% not at all).
4.6% of residents speak Asian or Pacific Island language at home (62% very well, 10% well, 22% not well, 6% not at all).
1.7% of residents speak other language at home (69% very well, 31% well).
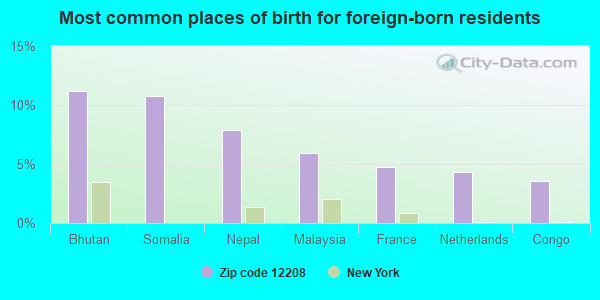
Foreign born population: 3,262 (14.3%) (60.4% of them are naturalized citizens)
Facilities with environmental interests located in this zip code:
ALBANY MEDICAL CENTER (43 NEW SCOTLAND AVE in ALBANY, NY)
AIR MINOR (AIRS/AFS) STATE MASTER (New York facility tracking) - REFUSE DISPOSAL, AIR PROGRAM, RADIOACTIVE MATERIALS, HAZARDOUS WASTE PROGRAM, SOLID WASTE PROGRAM (Integrated Compliance Information System) - ICIS-02-1989-0412, FORMAL ENFORCEMENT ACTION, ICIS-02-1999-1042, HAZARDOUS WASTE BIENNIAL REPORTER (Resource Conservation and Recovery Act (tracking hazardous waste)) Large Quantity Generators, more that 1000 kg of hazardous waste/month (Resource Conservation and Recovery Act (tracking hazardous waste)) - notification (Resource Conservation and Recovery Act (tracking hazardous waste)) Business SIC classification: GENERAL MEDICAL AND SURGICAL HOSPITALS Organizations: ALBANY MEDICAL CTR (CONTACT/OPERATOR)
Alternative names: ALBANY MEDICAL COLLEGE, ALBANY MEDICAL CENTER HOS
CHILDS HOSPITAL (25 HACKETT BLVD in ALBANY, NY)
AIR MINOR (AIRS/AFS) STATE MASTER (New York facility tracking) - REFUSE DISPOSAL, AIR PROGRAM, Organizations: ALBANY MEDICAL CENTER (LEGALLY RESPONSIBLE PARTY)
GETTY SERVICE STATION (1066 MADISON AVENUE in ALBANY, NY)
STATE MASTER (New York facility tracking) - AIR PROGRAM (Resource Conservation and Recovery Act (tracking hazardous waste)) Business SIC classification: GASOLINE SERVICE STATIONS Organizations: GETTY PETROLEUM MARKETING INC (LEGALLY RESPONSIBLE PARTY)
Alternative names: GETTY PETROLEUM CORP
AMERICAN RED CROSS (2 CLARA BARTON RD in ALBANY, NY)
(Integrated Compliance Information System) - ICIS-02-2000-1034, FORMAL ENFORCEMENT ACTION Business SIC classification: SPECIAL TRADE CONTRACTORS
ALBANY COUNTY MENTAL HEALTH AC (543 WARREN ST in ALBANY, NY)
(Resource Conservation and Recovery Act (tracking hazardous waste))
ALBANY MEDICAL CENTER (25 HACKETT BLVD in ALBANY, NY)
Small Quantity Generators, between 100 kg and 1000 kg of hazardous waste/month (Resource Conservation and Recovery Act (tracking hazardous waste))
ALBANY PUBLIC SCHOOL #19 (369 NEW SCOTLAND RD in ALBANY, NY)
(Resource Conservation and Recovery Act (tracking hazardous waste))
ALBANY PUBLIC SCHOOLS - SUNSHINE SCHOOL (DELAWARE & MORTON AVES in ALBANY, NY)
(Resource Conservation and Recovery Act (tracking hazardous waste))
ALBANY ACADEMY FOR GIRLS (145 ACADEMY RD in ALBANY, NY)
COMPLIANCE ACTIVITY (Tracking inspections of insecticide, fungicide, and rodenticide, and toxic substances)
ALBANY COLLEGE OF PHARMACY (106 NEW SCOTLAND AVE in ALBANY, NY)
Small Quantity Generators, between 100 kg and 1000 kg of hazardous waste/month (Resource Conservation and Recovery Act (tracking hazardous waste))
ALBANY LAW SCHOOL (80 NEW SCOTLAND AVE in ALBANY, NY)
Conditionally Exempt Small Quantity Generators, less than 100 kg/month of hazardous waste (Resource Conservation and Recovery Act (tracking hazardous waste))
Housing units lacking complete plumbing facilities: 0.3% Housing units lacking complete kitchen facilities: 0.2%
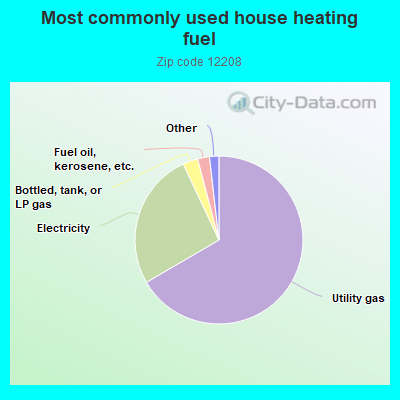
66.6%Utility gas
26.4%Electricity
2.9%Bottled, tank, or LP gas
2.3%Fuel oil, kerosene, etc.
1.0%Other fuel
0.6%Wood
Population in 1990: 22,041.
Place of birth for U.S.-born residents:
This state: 14,517
Northeast: 1,869
Midwest: 623
South: 1,181
West: 959
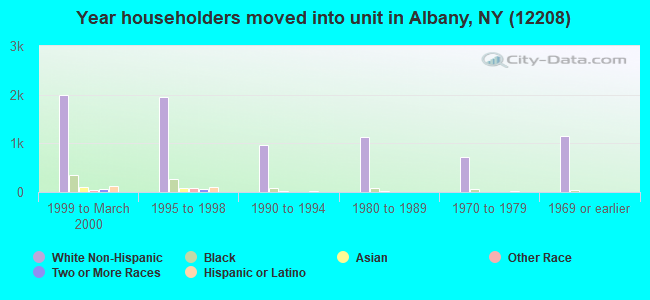
49% of the 12208 zip code residents lived in the same house 5 years ago. Out of people who lived in different houses, 53% lived in this county. Out of people who lived in different counties, 50% lived in New York.
84% of the 12208 zip code residents lived in the same house 1 year ago. Out of people who lived in different houses, 63% moved from this county. Out of people who lived in different houses, 25% moved from different county within same state. Out of people who lived in different houses, 9% moved from different state. Out of people who lived in different houses, 3% moved from abroad.
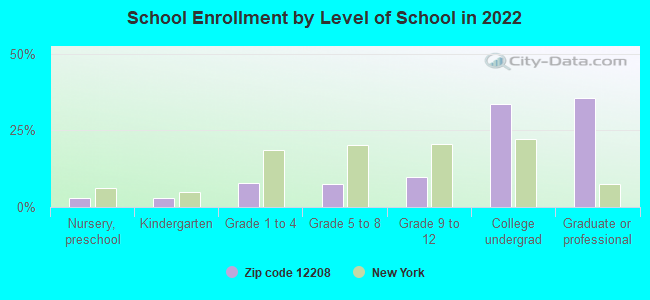
Private vs. public school enrollment:
Students in private schools in grades 1 to 8 (elementary and middle school): 166
Here:
16.6%
New York:
15.6%
Students in private schools in grades 9 to 12 (high school): 96
Here:
14.9%
New York:
15.0%
Students in private undergraduate colleges: 747
Here:
34.0%
New York:
39.2%
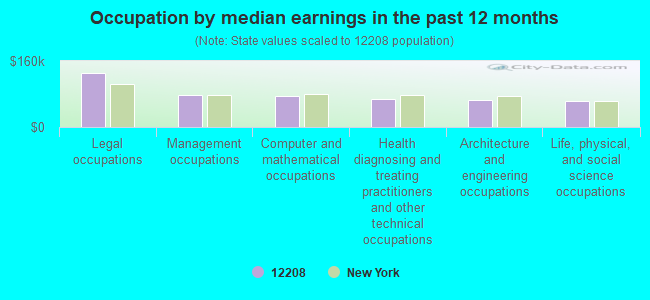
Occupation by median earnings in the past 12 months ($)
129,716Legal occupations
77,356Management occupations
74,949Computer and mathematical occupations
67,068Health diagnosing and treating practitioners and other technical occupations
66,219Architecture and engineering occupations
64,108Life, physical, and social science occupations
Companies with federal contracts located in this zip code (ALBANY, NY):
ALBANY MEDICAL COLLEGE (47 NEW SCOTLAND AVE) : $142,699 in 2 contractsfrom 1999 to 2006
$80,699 with Army for Educational Services. Signed on 2006-02-10. Completion date: 2006-09-29.
$62,000 with Army for Tuition, Registration, and Membership Fees. Signed on 1999-10-14. Completion date: 1999-11-30.
N & S CLEANERS INC (781 MADISON AVE; small business) : $26,517 in 6 contractsfrom 2002 to 2006
Contracts for Laundry and DryCleaning Services by Army Signed by year:2000: $0; 2001: $0; 2002: $6,174; 2003: $6,444; 2004: $7,121; 2005: $0; 2006: $6,778.
Biggest contracts:
$7,121 with Army for Laundry and DryCleaning Services. Signed on 2004-10-01. Completion date: 2005-09-30.
$6,778, same as above.Signed on 2006-01-24. Completion date: 2006-09-30.
$6,547, same as above.Signed on 2003-10-24. Completion date: 2004-09-30.
$6,174, same as above.Signed on 2002-10-31. Completion date: 2003-09-30.
GORDON ELKIN (70 KAKELY ST; small business) : $14,560 in 2 contractsin 2003
$14,560 with Army for Optometry Services. Signed on 2003-10-22. Completion date: 2004-09-30.
$0, same as above.Signed on 2003-10-22. Completion date: 2004-09-30.
ALBANY LAW SCHOOL INC, THE (80 NEW SCOTLAND)
$8,245 with Navy for Tuition, Registration, and Membership Fees. Signed on 2005-08-17. Completion date: 2005-12-31.
Top industries in this zip code by the number of employees in 2005:
Health Care and Social Assistance: General Medical and Surgical Hospitals (over 1000 employees: 3 establishments, 100-249 employees: 1 establishment)
Educational Services: Colleges, Universities, and Professional Schools (over 1000: 1, 250-499: 2)
Management of Companies and Enterprises: Corporate, Subsidiary, and Regional Managing Offices (500-999: 1, 250-499: 2)
Health Care and Social Assistance: Offices of Physicians (except Mental Health Specialists) (50-99: 2, 20-49: 10, 10-19: 18, 5-9: 16, 1-4: 23)
Health Care and Social Assistance: Psychiatric and Substance Abuse Hospitals (500-999: 1)
2002 - 2018 National Fire Incident Reporting System (NFIRS) incidents
Based on the data from the years 2002 - 2018 the average number of fire incidents per year is 46. The highest number of fire incidents - 99 took place in 2003, and the least - 0 in 2008. The data has a decreasing trend.
When looking into fire subcategories, the most reports belonged to: Structure Fires (37.3%), and Other (36.3%).
Fire incident types reported to NFIRS in Zip Code 12208

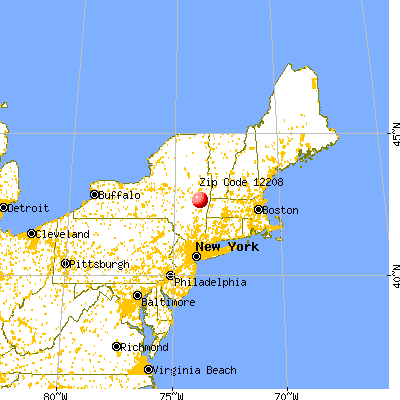


 Nearest zip codes: 12209, 12206, 12222, 12203, 12202, 12210.


 Based on the data from the years 2002 - 2018 the average number of fire incidents per year is 46. The highest number of fire incidents - 99 took place in 2003, and the least - 0 in 2008. The data has a decreasing trend.
 When looking into fire subcategories, the most reports belonged to: Structure Fires (37.3%), and Other (36.3%).