Estimated zip code population in 2022: 30,060 Zip code population in 2010: 29,952 Zip code population in 2000: 32,866
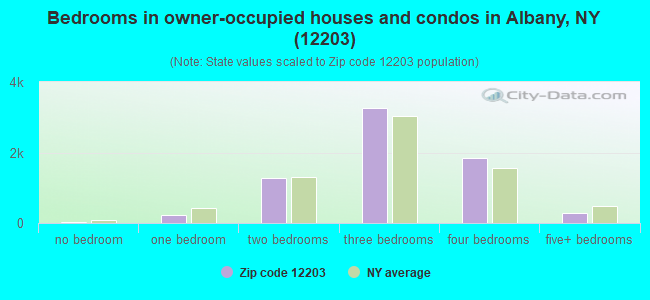
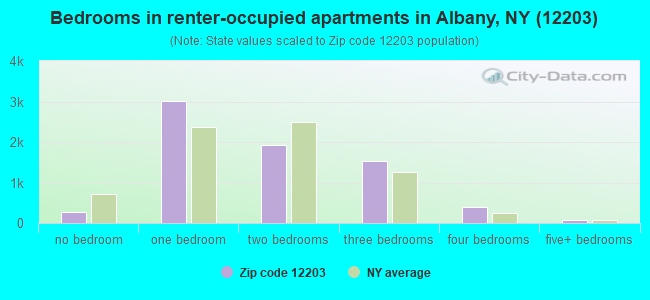
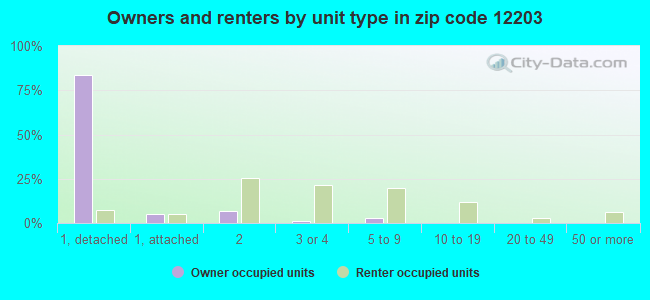
Houses and condos: 15,021 Renter-occupied apartments: 7,227
% of renters here:
51%
State:
46%
March 2022 cost of living index in zip code 12203: 106.6 (more than average, U.S. average is 100)
Land area: 11.4 sq. mi. Water area: 0.1 sq. mi.
Population density: 2,635 people per square mile
(average).
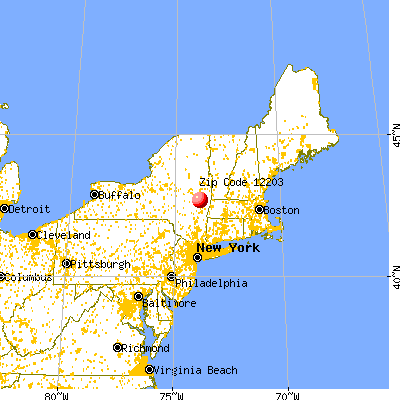
OSM Map
General Map
Google Map
MSN Map
OSM Map
General Map
Google Map
MSN Map
OSM Map
General Map
Google Map
MSN Map
OSM Map
General Map
Google Map
MSN Map
Please wait while loading the map...
Real estate property taxes paid for housing units in 2022:
This zip code:
2.3% ($5,819)
New York:
1.5% ($6,180)
Median real estate property taxes paid for housing units with mortgages in 2022: $5,952 (2.2%) Median real estate property taxes paid for housing units with no mortgage in 2022: $5,459 (2.2%)
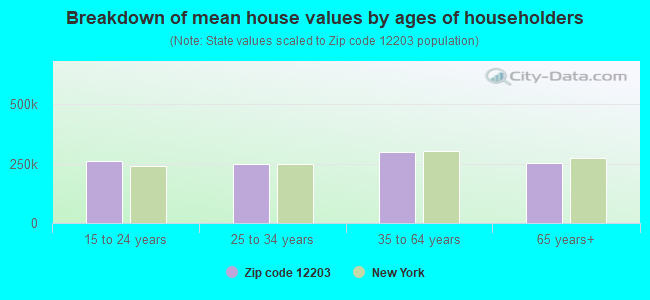
Estimated median house/condo value in 2022: $257,586
12203:
$257,586
New York:
$400,400
According to our research of New York and other state lists, there were 24 registered sex offenders living in 12203 zip code as of April 27, 2024. The ratio of all residents to sex offenders in zip code 12203 is 1,294 to 1. The ratio of registered sex offenders to all residents in this zip code is lower than the state average.
Median resident age:
This zip code:
34.9 years
New York median age:
40.0 years
Average household size:
This zip code:
1.9 people
New York:
2.5 people
Averages for the 2020 tax year for zip code 12203, filed in 2021:
Average Adjusted Gross Income (AGI) in 2020: $81,987 (Individual Income Tax Returns)
Here:
$81,987
State:
$90,930
Salary/wage: $61,192 (reported on 79.7% of returns)
Here:
$61,192
State:
$72,104
(% of AGI for various income ranges: 1159.2% for AGIs below $25k, 3622.9% for AGIs $25k-50k, 6397.8% for AGIs $50k-75k, 9295.4% for AGIs $75k-100k, 16975.8% for AGIs $100k-200k, 73615.8% for AGIs over 200k)
Taxable interest for individuals: $1,593 (reported on 40.6% of returns)
This zip code:
$1,593
New York:
$3,075
(% of AGI for various income ranges: 15.7% for AGIs below $25k, 20.5% for AGIs $25k-50k, 52.9% for AGIs $50k-75k, 87.8% for AGIs $75k-100k, 147.5% for AGIs $100k-200k, 2337.9% for AGIs over 200k)
Ordinary dividends: $7,613 (reported on 25.3% of returns)
Here:
$7,613
State:
$11,095
(% of AGI for various income ranges: 37.4% for AGIs below $25k, 43.9% for AGIs $25k-50k, 93.1% for AGIs $50k-75k, 188.7% for AGIs $75k-100k, 467.2% for AGIs $100k-200k, 8092.1% for AGIs over 200k)
Net capital gain/loss in AGI: +$20,635 (reported on 21.9% of returns)
Here:
+$20,635
State:
+$44,925
(% of AGI for various income ranges: 9.1% for AGIs below $25k, 33.0% for AGIs $25k-50k, 87.5% for AGIs $50k-75k, 212.9% for AGIs $75k-100k, 631.9% for AGIs $100k-200k, 26475.8% for AGIs over 200k)
Profit/loss from business: +$15,529 (reported on 12.0% of returns)
Here:
+$15,529
State:
+$14,940
(% of AGI for various income ranges: 63.7% for AGIs below $25k, 93.7% for AGIs $25k-50k, 129.8% for AGIs $50k-75k, 193.2% for AGIs $75k-100k, 584.5% for AGIs $100k-200k, 5493.2% for AGIs over 200k)
Taxable individual retirement arrangement distribution: $16,383 (reported on 9.2% of returns)
12203:
$16,383
New York:
$19,609
(% of AGI for various income ranges: 47.8% for AGIs below $25k, 81.6% for AGIs $25k-50k, 161.3% for AGIs $50k-75k, 298.8% for AGIs $75k-100k, 619.2% for AGIs $100k-200k, 2263.2% for AGIs over 200k)
Self-employed (Keogh) retirement plans: $21,490 (reported on 0.7% of returns)
12203:
$21,490
New York:
$32,497
(% of AGI for various income ranges: 75.5% for AGIs $100k-200k, 650.5% for AGIs over 200k)
Total itemized deductions: $31,305 (reported on 9.3% of returns)
Here:
$31,305
State:
$39,326
(% of AGI for various income ranges: 51.7% for AGIs below $25k, 107.6% for AGIs $25k-50k, 305.3% for AGIs $50k-75k, 603.3% for AGIs $75k-100k, 810.2% for AGIs $100k-200k, 7901.6% for AGIs over 200k)
Charity contributions: $14,512 (reported on 7.0% of returns)
Here:
$14,512
State:
$15,420
(% of AGI for various income ranges: 3.3% for AGIs below $25k, 11.2% for AGIs $25k-50k, 33.4% for AGIs $50k-75k, 65.9% for AGIs $75k-100k, 192.1% for AGIs $100k-200k, 5329.5% for AGIs over 200k)
Taxes paid: $8,269 (reported on 9.3% of returns)
12203:
$8,269
State:
$9,183
(% of AGI for various income ranges: 10.9% for AGIs below $25k, 28.1% for AGIs $25k-50k, 113.6% for AGIs $50k-75k, 225.0% for AGIs $75k-100k, 281.6% for AGIs $100k-200k, 1041.6% for AGIs over 200k)
Earned income credit: $1,686 (reported on 8.7% of returns)
Here:
$1,686
State:
$2,138
(% of AGI for various income ranges: 49.5% for AGIs below $25k, 30.6% for AGIs $25k-50k)
Percentage of individuals using paid preparers for their 2020 taxes: 93.7%
Here:
94%
State:
95%
(% for various income ranges: 93.3% for AGIs below $25k, 94.5% for AGIs $25k-50k, 93.6% for AGIs $50k-75k, 92.4% for AGIs $75k-100k, 92.9% for AGIs $100k-200k, 96.9% for AGIs over 200k)
Averages for the 2012 tax year for zip code 12203, filed in 2013:
Average Adjusted Gross Income (AGI) in 2012: $73,832 (Individual Income Tax Returns)
Here:
$73,832
State:
$77,088
Salary/wage: $52,296 (reported on 81.1% of returns)
Here:
$52,296
State:
$60,593
(% of AGI for various income ranges: 74.0% for AGIs below $25k, 77.7% for AGIs $25k-50k, 73.0% for AGIs $50k-75k, 71.9% for AGIs $75k-100k, 72.6% for AGIs $100k-200k, 25.3% for AGIs over 200k)
Taxable interest for individuals: $1,634 (reported on 47.0% of returns)
This zip code:
$1,634
New York:
$3,125
(% of AGI for various income ranges: 1.5% for AGIs below $25k, 0.8% for AGIs $25k-50k, 0.7% for AGIs $50k-75k, 0.6% for AGIs $75k-100k, 0.8% for AGIs $100k-200k, 1.5% for AGIs over 200k)
Ordinary dividends: $7,435 (reported on 27.1% of returns)
Here:
$7,435
State:
$10,299
(% of AGI for various income ranges: 2.5% for AGIs below $25k, 1.1% for AGIs $25k-50k, 1.5% for AGIs $50k-75k, 1.4% for AGIs $75k-100k, 1.8% for AGIs $100k-200k, 4.9% for AGIs over 200k)
Net capital gain/loss in AGI: +$23,635 (reported on 19.1% of returns)
Here:
+$23,635
State:
+$42,474
(% of AGI for various income ranges: 0.2% for AGIs $25k-50k, 0.3% for AGIs $50k-75k, 0.5% for AGIs $75k-100k, 1.5% for AGIs $100k-200k, 17.0% for AGIs over 200k)
Profit/loss from business: +$15,156 (reported on 11.5% of returns)
Here:
+$15,156
State:
+$16,168
(% of AGI for various income ranges: 4.1% for AGIs below $25k, 2.1% for AGIs $25k-50k, 2.3% for AGIs $50k-75k, 1.6% for AGIs $75k-100k, 2.5% for AGIs $100k-200k, 2.4% for AGIs over 200k)
Taxable individual retirement arrangement distribution: $12,268 (reported on 11.6% of returns)
12203:
$12,268
New York:
$17,621
(% of AGI for various income ranges: 3.3% for AGIs below $25k, 1.9% for AGIs $25k-50k, 2.1% for AGIs $50k-75k, 2.5% for AGIs $75k-100k, 2.8% for AGIs $100k-200k, 0.9% for AGIs over 200k)
Self-employment retirement plans: $21,827 (reported on 0.8% of returns)
12203:
$21,827
New York:
$27,330
(% of AGI for various income ranges: 0.2% for AGIs $50k-75k, 0.3% for AGIs $100k-200k, 0.4% for AGIs over 200k)
Total itemized deductions: $26,052 (18% of AGI, reported on 36.8% of returns)
Here:
$26,052
State:
$34,985
Here:
18.2% of AGI
State:
21.3% of AGI
(% of AGI for various income ranges: 10.7% for AGIs below $25k, 9.5% for AGIs $25k-50k, 12.5% for AGIs $50k-75k, 14.4% for AGIs $75k-100k, 15.3% for AGIs $100k-200k, 12.8% for AGIs over 200k)
Charity contributions: $4,674 (reported on 30.4% of returns)
Here:
$4,674
State:
$5,572
(% of AGI for various income ranges: 0.6% for AGIs below $25k, 0.7% for AGIs $25k-50k, 1.2% for AGIs $50k-75k, 1.5% for AGIs $75k-100k, 1.7% for AGIs $100k-200k, 3.2% for AGIs over 200k)
Taxes paid: $15,047 (reported on 36.6% of returns)
12203:
$15,047
State:
$18,656
(% of AGI for various income ranges: 2.9% for AGIs below $25k, 3.8% for AGIs $25k-50k, 5.7% for AGIs $50k-75k, 7.1% for AGIs $75k-100k, 8.5% for AGIs $100k-200k, 9.8% for AGIs over 200k)
Earned income credit: $1,655 (reported on 9.7% of returns)
Here:
$1,655
State:
$2,230
(% of AGI for various income ranges: 3.1% for AGIs below $25k, 0.4% for AGIs $25k-50k)
Percentage of individuals using paid preparers for their 2012 taxes: 47.7%
Here:
48%
State:
66%
(% for various income ranges: 42.8% for AGIs below $25k, 43.3% for AGIs $25k-50k, 50.2% for AGIs $50k-75k, 52.2% for AGIs $75k-100k, 56.2% for AGIs $100k-200k, 75.0% for AGIs over 200k)
Averages for the 2004 tax year for zip code 12203, filed in 2005:
Average Adjusted Gross Income (AGI) in 2004: $49,803 (Individual Income Tax Returns)
Here:
$49,803
State:
$59,519
Salary/wage: $43,565 (reported on 81.8% of returns)
Here:
$43,565
State:
$50,673
(% of AGI for various income ranges: 91.8% for AGIs below $10k, 72.9% for AGIs $10k-25k, 80.3% for AGIs $25k-50k, 75.8% for AGIs $50k-75k, 76.1% for AGIs $75k-100k, 61.5% for AGIs over 100k)
Taxable interest for individuals: $1,484 (reported on 60.8% of returns)
This zip code:
$1,484
New York:
$2,377
(% of AGI for various income ranges: 6.0% for AGIs below $10k, 2.8% for AGIs $10k-25k, 1.6% for AGIs $25k-50k, 1.6% for AGIs $50k-75k, 1.5% for AGIs $75k-100k, 1.8% for AGIs over 100k)
Taxable dividends: $3,105 (reported on 32.4% of returns)
Here:
$3,105
State:
$5,394
(% of AGI for various income ranges: 6.2% for AGIs below $10k, 2.5% for AGIs $10k-25k, 1.2% for AGIs $25k-50k, 1.5% for AGIs $50k-75k, 1.5% for AGIs $75k-100k, 2.7% for AGIs over 100k)
Net capital gain/loss: +$7,048 (reported on 25.1% of returns)
Here:
+$7,048
State:
+$23,581
(% of AGI for various income ranges: -0.4% for AGIs below $10k, 0.2% for AGIs $10k-25k, 0.4% for AGIs $25k-50k, 1.2% for AGIs $50k-75k, 2.0% for AGIs $75k-100k, 7.9% for AGIs over 100k)
Profit/loss from business: +$12,748 (reported on 11.4% of returns)
Here:
+$12,748
State:
+$13,809
(% of AGI for various income ranges: 4.8% for AGIs below $10k, 3.1% for AGIs $10k-25k, 1.2% for AGIs $25k-50k, 2.0% for AGIs $50k-75k, 1.7% for AGIs $75k-100k, 4.7% for AGIs over 100k)
IRA payment deduction: $2,823 (reported on 2.4% of returns)
12203:
$2,823
New York:
$3,115
(% of AGI for various income ranges: 0.2% for AGIs below $10k, 0.2% for AGIs $10k-25k, 0.3% for AGIs $25k-50k, 0.1% for AGIs $50k-75k, 0.1% for AGIs $75k-100k, 0.1% for AGIs over 100k)
Self-employed pension: $16,907 (reported on 1.0% of returns)
Here:
$16,907
New York:
$19,016
(% of AGI for various income ranges: 0.0% for AGIs $25k-50k, 0.1% for AGIs $50k-75k, 0.1% for AGIs $75k-100k, 0.8% for AGIs over 100k)
Total itemized deductions: $17,514 (20% of AGI, reported on 36.2% of returns)
Here:
$17,514
State:
$25,864
Here:
19.8% of AGI
State:
21.9% of AGI
(% of AGI for various income ranges: 13.2% for AGIs below $10k, 8.3% for AGIs $10k-25k, 9.4% for AGIs $25k-50k, 13.4% for AGIs $50k-75k, 15.3% for AGIs $75k-100k, 14.0% for AGIs over 100k)
Charity contributions deductions: $2,648 (3% of AGI, reported on 32.5% of returns)
Here:
$2,648
State:
$4,439
Here:
2.8% of AGI
State:
3.6% of AGI
(% of AGI for various income ranges: 0.4% for AGIs below $10k, 0.8% for AGIs $10k-25k, 1.1% for AGIs $25k-50k, 1.7% for AGIs $50k-75k, 2.1% for AGIs $75k-100k, 2.2% for AGIs over 100k)
Total tax: $7,825 (reported on 82.0% of returns)
12203:
$7,825
State:
$11,730
(% of AGI for various income ranges: 2.3% for AGIs below $10k, 4.6% for AGIs $10k-25k, 8.6% for AGIs $25k-50k, 10.9% for AGIs $50k-75k, 11.4% for AGIs $75k-100k, 19.0% for AGIs over 100k)
Earned income credit: $1,342 (reported on 7.4% of returns)
Here:
$1,342
State:
$1,757
Percentage of individuals using paid preparers for their 2004 taxes: 51.0%
Here:
51%
State:
67%
(% for various income ranges: 45.7% for AGIs below $10k, 49.8% for AGIs $10k-25k, 47.8% for AGIs $25k-50k, 53.4% for AGIs $50k-75k, 57.0% for AGIs $75k-100k, 62.9% for AGIs over 100k)
Likely homosexual households (counted as self-reported same-sex unmarried-partner households)
Lesbian couples: 1.1% of all households
Gay men: 0.5% of all households
Household received Food Stamps/SNAP in the past 12 months: 1,204 Household did not receive Food Stamps/SNAP in the past 12 months: 12,806
Women who had a birth in the past 12 months: 173 (101 now married, 73 unmarried) Women who did not have a birth in the past 12 months: 7,824 (2,309 now married, 5,540 unmarried)
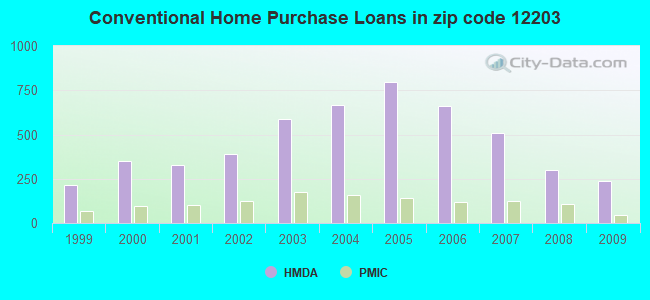
Housing units in zip code 12203 with a mortgage: 4,464 (434 second mortgage, 401 both second mortgage and home equity loan) Houses without a mortgage: 368
Median monthly owner costs for units with a mortgage: $1,792 Median monthly owner costs for units without a mortgage: $799
Residents with income below the poverty level in 2022:
This zip code:
15.2%
Whole state:
14.3%
Residents with income below 50% of the poverty level in 2022:
This zip code:
6.6%
Whole state:
6.8%
Median number of rooms in houses and condos:
Here:
6.3
State:
6.3
Median number of rooms in apartments:
Here:
4.1
State:
3.8
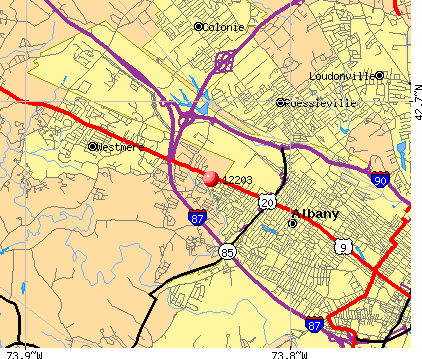
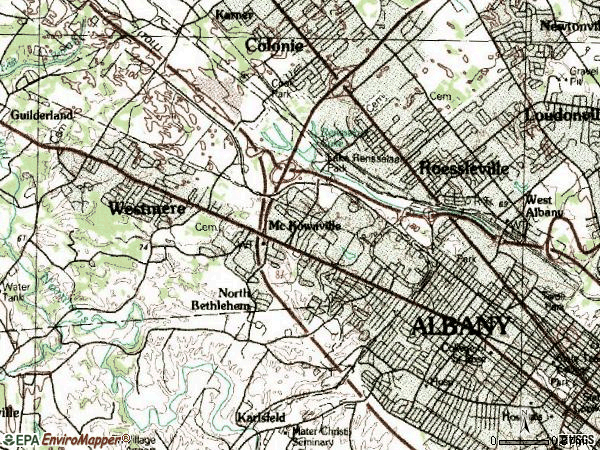
Notable locations in this zip code not listed on our city pages
Notable locations in zip code 12203: Freedom Quadrangle (A), Kamer Road Industrial Park (B), Albany Fire Department Engine 1 (C), Washington Park Pavilion (D), Women's Club of Albany (E), Ten Eyck Hall (F), Truth Hall (G), Stanton Hall (H), Lazarus Hall (I), Northrup Hall (J), Milne Building (K), Governor Thomas E Dewey Graduate Library for Public Affairs and Policy (L), Page Building (M), Richardson Building (N), Husted Building (O), Draper Building (P), Hindelang Criminal Justice Research Center (Q), Hawley Building (R), Brubacher Hall (S), Sayles Hall (T). Display/hide their locations on the map
Shopping Centers: Stuyvesant Plaza Shopping Center (1), Westmere Plaza Shopping Center (2), Cosimos Plaza Shopping Center (3), Crossgates Mall Shopping Center (4). Display/hide their locations on the map
Churches in zip code 12203 include: Christ The King Church (A), Saint Andrew's Episcopal Church (B), First Assembly of God Church (C), Saint Margaret Marys Roman Catholic Church (D), Seventh Day Adventist Church (E), Church of the Nazarene (F), New Covenant Presbyterian Church (G), Holy Cross Roman Catholic Church (H), Capital City Seventh Day Adventist Church (I). Display/hide their locations on the map
2,292 married couples with children.
810 single-parent households (310 men, 500 women).
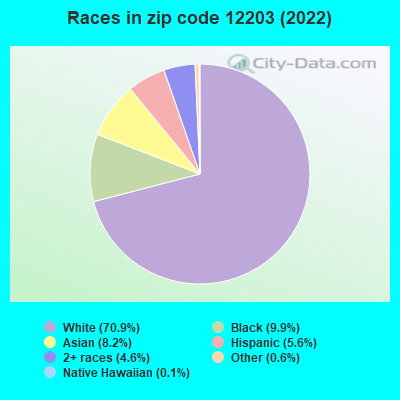
80.5% of residents of 12203 zip code speak English at home.
3.3% of residents speak Spanish at home (69% very well, 11% well, 19% not well).
8.2% of residents speak other Indo-European language at home (71% very well, 25% well, 4% not well, 1% not at all).
5.1% of residents speak Asian or Pacific Island language at home (56% very well, 26% well, 15% not well, 3% not at all).
2.8% of residents speak other language at home (81% very well, 15% well, 4% not well).
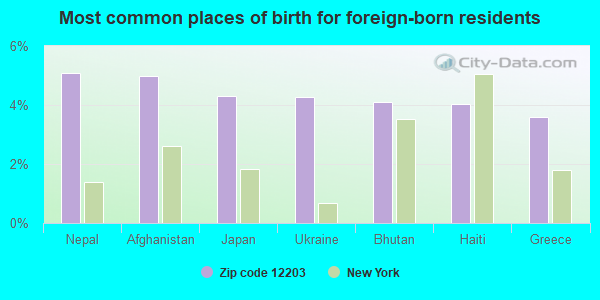
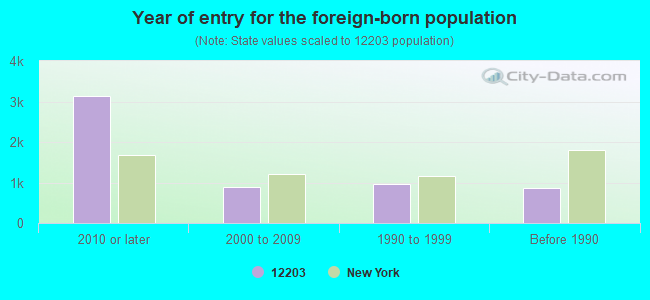
Foreign born population: 5,152 (17.1%) (55.0% of them are naturalized citizens)
Major facilities with environmental interests located in this zip code:
ALBANY MOLECULAR RESEARCH INC (21 CORPORATE CIRCLE in ALBANY, NY)
STATE MASTER (New York facility tracking) - AIR PROGRAM, HAZARDOUS WASTE PROGRAM HAZARDOUS WASTE BIENNIAL REPORTER (Resource Conservation and Recovery Act (tracking hazardous waste)) Large Quantity Generators, more that 1000 kg of hazardous waste/month (Resource Conservation and Recovery Act (tracking hazardous waste)) Large Quantity Generators, more that 1000 kg of hazardous waste/month (Resource Conservation and Recovery Act (tracking hazardous waste)) - notification Business SIC classification: PHARMACEUTICAL PREPARATIONS Business NAICS classification: PHARMACEUTICAL PREPARATION MANUFACTURING. Organizations: JIM GRATES (CONTACT/OPERATOR)
ALBANY HS (700 WASHINGTON AVE in ALBANY, NY)
(National Center for Education Statistics) - STATE ID-010100010034 Small Quantity Generators, between 100 kg and 1000 kg of hazardous waste/month (Resource Conservation and Recovery Act (tracking hazardous waste)) - notification Organizations: CITY SCHOOL DISTRICT OF ALBANY (CONTACT/OPERATOR)
, ALBANY CITY SD (SCHOOL DISTRICT)
Alternative names: ALBANY HIGH SCHOOL, ALBANY PUBLIC SCHOOLS
COLLEGE OF SAINT ROSE (432 WESTERN AVENUE in ALBANY, NY)
(Integrated Compliance Information System) - ICIS-02-2004-0839, ENFORCEMENT/COMPLIANCE ACTIVITY
A C AUTO PARTS (1436 WESTERN AVENUE in ALBANY, NY)
(Resource Conservation and Recovery Act (tracking hazardous waste)) Conditionally Exempt Small Quantity Generators, less than 100 kg/month of hazardous waste (Resource Conservation and Recovery Act (tracking hazardous waste)) - notification Organizations: ATHONY CACCAMO (CONTACT/OWNER)
747 MADISON AVENUE ASSOCIATES (418-420 HAMILTON ST in ALBANY, NY)
(Resource Conservation and Recovery Act (tracking hazardous waste))
A B DICK CO (1858 WESTERN AVE in ALBANY, NY)
(Resource Conservation and Recovery Act (tracking hazardous waste))
ALBANY - NANOTECH BUILDING (251 FULLER RD in ALBANY, NY)
Small Quantity Generators, between 100 kg and 1000 kg of hazardous waste/month (Resource Conservation and Recovery Act (tracking hazardous waste)) Organizations: FULLER ROAD MANAGEMENT CORP (CONTACT/OPERATOR)
, STATE UNIVERSITY OF NEW YORK (CONTACT/OWNER)
ALBANY AUTO RADIATOR CO INC (1758 WESTERN AVE in ALBANY, NY)
(Resource Conservation and Recovery Act (tracking hazardous waste))
ALBANY COUNTY OF RAPP ROAD LANDFILL (525 RAPP ROAD in ALBANY, NY)
AIR MAJOR (AIRS/AFS) CRITERIA AND HAZARDOUS AIR POLLUTANT INVENTORY (Inventory of air pollution sources) Small Quantity Generators, between 100 kg and 1000 kg of hazardous waste/month (Resource Conservation and Recovery Act (tracking hazardous waste)) Business SIC classification: REFUSE SYSTEMS Alternative names: ALBANY LANDFILL
ALBANY PUBLIC SCHOOL #16 (41 N ALLEN ST in ALBANY, NY)
(Resource Conservation and Recovery Act (tracking hazardous waste))
ALBANY PUBLIC SCHOOL #27 (1022 WESTERN AVE in ALBANY, NY)
(Resource Conservation and Recovery Act (tracking hazardous waste))
ALBANY PUBLIC SCHOOLS (27 WESTERN AVE in ALBANY, NY)
(Resource Conservation and Recovery Act (tracking hazardous waste))
GLENNPETER JEWELERS (STUYVESANT PLZ in ALBANY, NY)
(Resource Conservation and Recovery Act (tracking hazardous waste))
Housing units lacking complete plumbing facilities: 0.7% Housing units lacking complete kitchen facilities: 0.5%
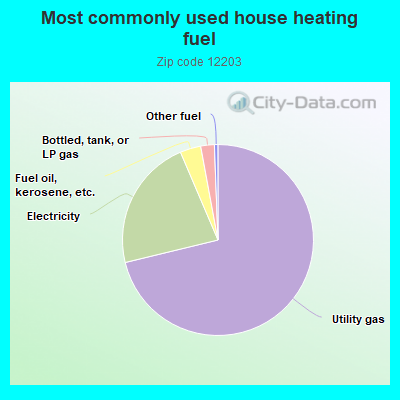
71.0%Utility gas
22.3%Electricity
3.5%Fuel oil, kerosene, etc.
2.3%Bottled, tank, or LP gas
0.6%Other fuel
Population in 1990: 33,356.
Place of birth for U.S.-born residents:
This state: 20,200
Northeast: 2,183
Midwest: 470
South: 1,089
West: 522
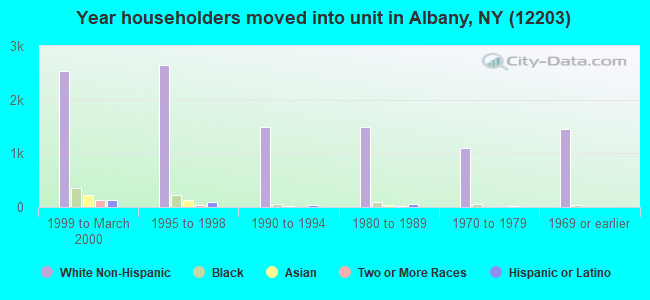
47% of the 12203 zip code residents lived in the same house 5 years ago. Out of people who lived in different houses, 37% lived in this county. Out of people who lived in different counties, 50% lived in New York.
83% of the 12203 zip code residents lived in the same house 1 year ago. Out of people who lived in different houses, 47% moved from this county. Out of people who lived in different houses, 38% moved from different county within same state. Out of people who lived in different houses, 5% moved from different state. Out of people who lived in different houses, 9% moved from abroad.
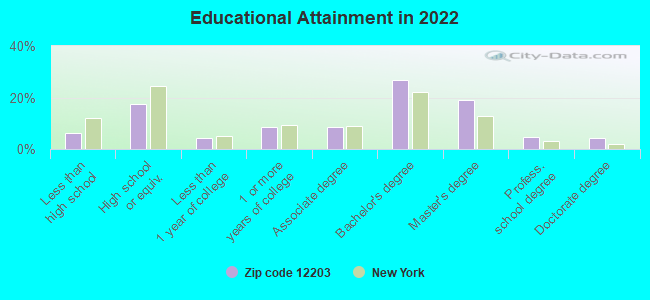
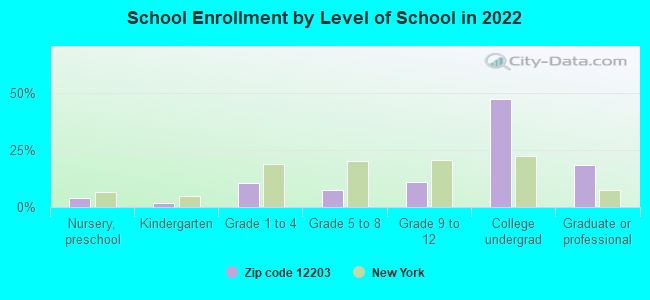
Private vs. public school enrollment:
Students in private schools in grades 1 to 8 (elementary and middle school): 315
Here:
20.2%
New York:
15.6%
Students in private schools in grades 9 to 12 (high school): 120
Here:
13.0%
New York:
15.0%
Students in private undergraduate colleges: 1,329
Here:
32.4%
New York:
39.2%
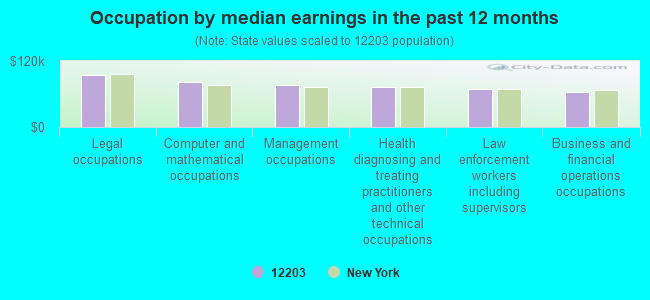
Occupation by median earnings in the past 12 months ($)
94,166Legal occupations
81,203Computer and mathematical occupations
76,854Management occupations
72,052Health diagnosing and treating practitioners and other technical occupations
68,644Law enforcement workers including supervisors
63,636Business and financial operations occupations
Companies with federal contracts located in this zip code (ALBANY, NY):
EXCELSIOR COLLEGE (7 COLUMBIA CIRCLE) : $6,106,573 in 33 contractsfrom 1999 to 2005
Contracts for Education Services, Certifications and Accreditations for Educational Institutions, Other Education and Training Services by Navy Signed by year:2000: $1,429,225; 2001: $1,019,546; 2002: $1,366,336; 2003: $1,247,896; 2004: $467,958; 2005: $368,037; 2006: $0.
Biggest contracts:
$635,908 with Navy for Education Services. Signed on 2002-04-01. Completion date: 2002-09-30.
$633,855, same as above.Signed on 2001-10-01. Completion date: 2001-03-31.
$616,527, same as above.Signed on 2003-04-01. Completion date: 2003-09-30.
$595,429, same as above.Signed on 2003-10-01. Completion date: 2003-09-30.
INTERNATIONAL MEDICAL PROGRAMS (6 EXECUTIVE PARK DRIVE; small business)
$1,685,000 with Army for Other Medical -- Basic Research (R&D). Signed on 2003-02-05. Completion date: 2005-02-28.
DESIGN & DISASTER RECOVERY CON (3 COLUMBIA CIRCLE; small business) : $396,508 in 8 contractsfrom 2000 to 2005
Contracts for ADP Support Equipment, Other ADP and Telecommunications Services (includes data storage on tapes, compact disks, etc.), ADP Systems Analysis Services, Communications Security Equipment and Components, and moreby Federal Technology Service, Army Signed by year:2000: $99,000; 2001: $194,000; 2002: $38,860; 2003: $0; 2004: $39,595; 2005: $25,053; 2006: $0.
Biggest contracts:
$167,000 with Federal Technology Service for ADP Support Equipment. Signed on 2001-08-15. Completion date: 2001-09-15.
$55,000, same as above.Signed on 2000-09-15. Completion date: 2000-10-15.
$44,000, same as above.Signed on 2000-09-15. Completion date: 2000-10-15.
$39,595 with Army for Other ADP and Telecommunications Services (includes data storage on tapes, compact disks, etc.). Signed on 2004-11-05. Completion date: 2004-10-01.
DR LOWELL J LEVINE (240 BENTWOOD COURT WEST; small business) : $176,667 in 8 contractsfrom 1999 to 2005
Contracts for Expert Witness, Guard Services, Other Professional Services, Pathology Services, and moreby Army, Navy Signed by year:2000: $58,499; 2001: $0; 2002: $0; 2003: $29,479; 2004: $28,976; 2005: $4,000; 2006: $0.
Biggest contracts:
$58,499 with Army for Expert Witness. Signed on 2000-12-28. Completion date: 2001-09-30.
$55,713 with Army for Guard Services. Signed on 1999-12-21. Completion date: 1999-12-21.
$28,975 with Navy for Other Professional Services. Taking place in HI. Signed on 2004-11-19. Completion date: 2005-10-31.
$15,000 with Army for Pathology Services. Taking place in HI. Signed on 2003-07-16. Completion date: 2003-09-30.
DAY & ZIMMERMANN FAC., SVCS., (WASHINGTON AVE EXT) : $64,436 in 3 contractsfrom 2000 to 2003
$56,000 with Public Buildings Service for Maintenance, Repair or Alteration of Real Property -- Office Buildings. Signed on 2002-09-15. Completion date: 2002-10-15.
$4,436 with Public Buildings Service for Maintenance, Repair and Rebuilding of Equipment -- Refrigeration, Air Conditioning, and Air Circulating Equipment. Signed on 2003-09-15. Completion date: 2003-10-15.
$4,000 with Public Buildings Service for Maintenance, Repair or Alteration of Real Property -- Office Buildings. Signed on 2000-06-15. Completion date: 2000-07-15.
PREFERRED DATA INC (24 MADISON AVENUE EXTENSIO; small business) : $37,960 in 3 contractsfrom 2003 to 2005
$13,000 with Army for ADP Data Conversion Services. Signed on 2005-09-07. Completion date: 2006-09-30.
$12,480, same as above.Signed on 2003-10-01. Completion date: 2004-09-30.
$12,480, same as above.Signed on 2004-09-14. Completion date: 2005-09-30.
SOVEREIGN HOTELS INC (1228 WESTERN AVE; small business)
$1,795 with Army for Lodging - Hotel/Motel. Signed on 2004-03-24. Completion date: 2004-03-10.
JO-JA CONSTRUCTION LTD S (PO BOX 3112 PINE HILLS STA; small business)
-$153,694 with Army for Construction of Structures and Facilities -- Dams. Signed on 1999-10-08. Completion date: 1999-10-08.
Top industries in this zip code by the number of employees in 2005:
Educational Services: Colleges, Universities, and Professional Schools (500-999 employees: 2 establishments)
2002 - 2018 National Fire Incident Reporting System (NFIRS) incidents
According to the data from the years 2002 - 2018 the average number of fires per year is 96. The highest number of fires - 165 took place in 2015, and the least - 36 in 2009. The data has a declining trend.
When looking into fire subcategories, the most incidents belonged to: Structure Fires (54.1%), and Outside Fires (24.8%).
Fire incident types reported to NFIRS in Zip Code 12203


 Nearest zip codes: 12222, 12205, 12208, 12159, 12084, 12206.
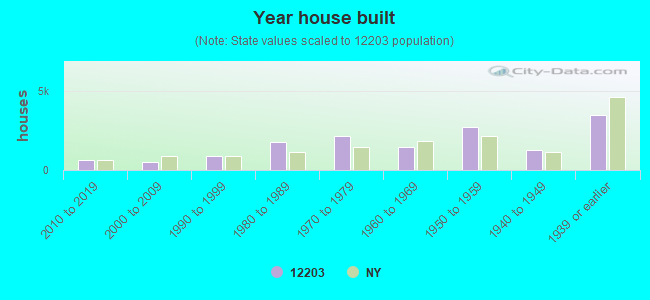


 According to the data from the years 2002 - 2018 the average number of fires per year is 96. The highest number of fires - 165 took place in 2015, and the least - 36 in 2009. The data has a declining trend.
 When looking into fire subcategories, the most incidents belonged to: Structure Fires (54.1%), and Outside Fires (24.8%).