Estimated zip code population in 2022: 1,319 Zip code population in 2010: 1,484 Zip code population in 2000: 1,360
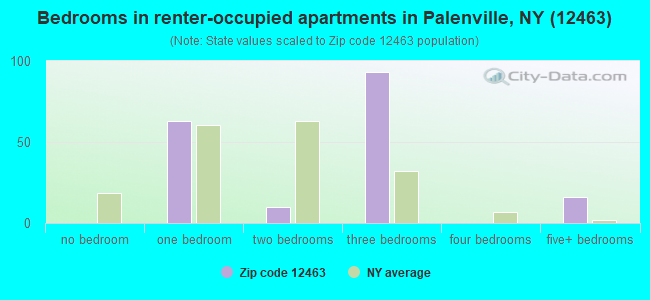
Houses and condos: 811 Renter-occupied apartments: 183
% of renters here:
28%
State:
46%
March 2022 cost of living index in zip code 12463: 96.7 (near average, U.S. average is 100)
Land area: 10.8 sq. mi. Water area: 0.0 sq. mi.
Population density: 122 people per square mile
(very low).
OSM Map
General Map
Google Map
MSN Map
OSM Map
General Map
Google Map
MSN Map
OSM Map
General Map
Google Map
MSN Map
OSM Map
General Map
Google Map
MSN Map
Please wait while loading the map...
Real estate property taxes paid for housing units in 2022:
This zip code:
1.8% ($4,273)
New York:
1.5% ($6,180)
Median real estate property taxes paid for housing units with mortgages in 2022: $3,414 (1.3%) Median real estate property taxes paid for housing units with no mortgage in 2022: $4,512 (1.9%)
Business Search- 14 Million verified businesses
Males: 423
(32.1%)
Females: 896
(67.9%)
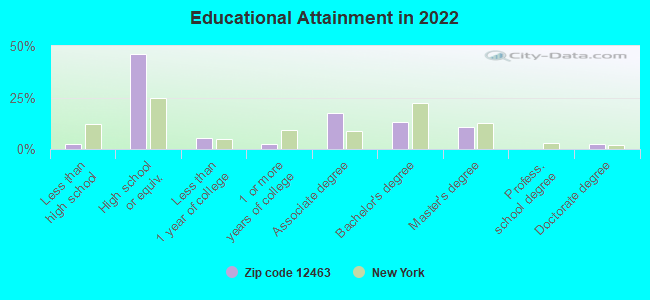
For population 25 years and over in 12463:
High school or higher: 97.2%
Bachelor's degree or higher: 26.1%
Graduate or professional degree: 12.9%
Unemployed: 2.1%
Mean travel time to work (commute): 28.7 minutes
For population 15 years and over in 12463:
Never married: 39.5%
Now married: 37.6%
Separated: 0.0%
Widowed: 14.8%
Divorced: 8.2%
Zip code 12463 compared to state average:
Median household income significantly below state average.
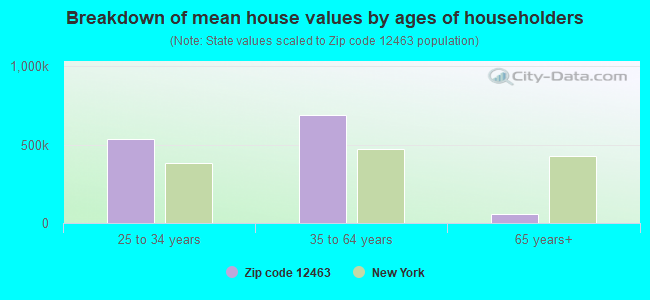
Median house value below state average.
Unemployed percentage below state average.
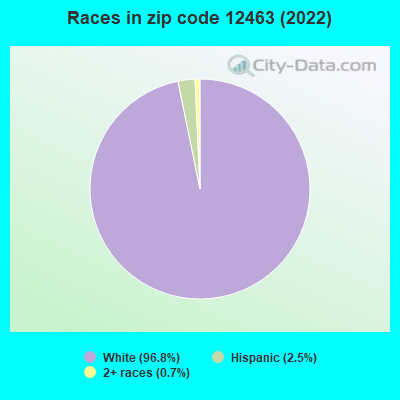
Black race population percentage significantly below state average.
Hispanic race population percentage significantly below state average.
Median age significantly above state average.
Foreign-born population percentage significantly below state average.
Renting percentage below state average.
Length of stay since moving in significantly above state average.
Number of college students significantly below state average.
Estimated median house/condo value in 2022: $241,950
12463:
$241,950
New York:
$400,400
Median resident age:
This zip code:
48.2 years
New York median age:
40.0 years
Average household size:
This zip code:
2.0 people
New York:
2.5 people
Averages for the 2020 tax year for zip code 12463, filed in 2021:
Average Adjusted Gross Income (AGI) in 2020: $61,289 (Individual Income Tax Returns)
Here:
$61,289
State:
$90,930
Salary/wage: $53,272 (reported on 75.0% of returns)
Here:
$53,272
State:
$72,104
(% of AGI for various income ranges: 1000.0% for AGIs below $25k, 3790.0% for AGIs $25k-50k, 5787.8% for AGIs $50k-75k, 8023.3% for AGIs $75k-100k, 18443.8% for AGIs $100k-200k)
Taxable interest for individuals: $619 (reported on 46.2% of returns)
This zip code:
$619
New York:
$3,075
(% of AGI for various income ranges: 10.0% for AGIs below $25k, 14.0% for AGIs $25k-50k, 50.0% for AGIs $50k-75k, 21.7% for AGIs $75k-100k, 106.2% for AGIs $100k-200k)
Ordinary dividends: $3,031 (reported on 20.0% of returns)
Here:
$3,031
State:
$11,095
(% of AGI for various income ranges: 13.3% for AGIs below $25k, 50.0% for AGIs $25k-50k, 44.4% for AGIs $50k-75k, 86.7% for AGIs $75k-100k, 372.5% for AGIs $100k-200k)
Net capital gain/loss in AGI: +$12,662 (reported on 16.2% of returns)
Here:
+$12,662
State:
+$44,925
(% of AGI for various income ranges: 69.3% for AGIs below $25k, 513.3% for AGIs $50k-75k, 1350.0% for AGIs $100k-200k)
Profit/loss from business: +$9,369 (reported on 16.2% of returns)
Here:
+$9,369
State:
+$14,940
(% of AGI for various income ranges: 158.0% for AGIs below $25k, 112.7% for AGIs $25k-50k, 220.0% for AGIs $50k-75k, 215.0% for AGIs $75k-100k, 606.2% for AGIs $100k-200k)
Taxable individual retirement arrangement distribution: $12,975 (reported on 10.0% of returns)
12463:
$12,975
New York:
$19,609
(% of AGI for various income ranges: 293.3% for AGIs $25k-50k, 996.7% for AGIs $75k-100k)
Total itemized deductions: $25,775 (reported on 5.0% of returns)
Here:
$25,775
State:
$39,326
(% of AGI for various income ranges: 1288.8% for AGIs $100k-200k)
Charity contributions: $2,633 (reported on 3.8% of returns)
Here:
$2,633
State:
$15,420
(% of AGI for various income ranges: 87.8% for AGIs $50k-75k)
Taxes paid: $8,175 (reported on 5.0% of returns)
12463:
$8,175
State:
$9,183
(% of AGI for various income ranges: 408.8% for AGIs $100k-200k)
Earned income credit: $1,820 (reported on 12.5% of returns)
Here:
$1,820
State:
$2,138
(% of AGI for various income ranges: 66.0% for AGIs below $25k, 55.3% for AGIs $25k-50k)
Percentage of individuals using paid preparers for their 2020 taxes: 92.5%
Here:
92%
State:
95%
(% for various income ranges: 90.9% for AGIs below $25k, 95.5% for AGIs $25k-50k, 100.0% for AGIs $50k-75k, 88.9% for AGIs $75k-100k, 91.7% for AGIs $100k-200k, 66.7% for AGIs over 200k)
Averages for the 2012 tax year for zip code 12463, filed in 2013:
Average Adjusted Gross Income (AGI) in 2012: $49,908 (Individual Income Tax Returns)
Here:
$49,908
State:
$77,088
Salary/wage: $45,105 (reported on 78.7% of returns)
Here:
$45,105
State:
$60,593
(% of AGI for various income ranges: 60.4% for AGIs below $25k, 74.5% for AGIs $25k-50k, 75.8% for AGIs $50k-75k, 78.6% for AGIs $75k-100k, 65.7% for AGIs $100k-200k)
Taxable interest for individuals: $623 (reported on 46.7% of returns)
This zip code:
$623
New York:
$3,125
(% of AGI for various income ranges: 1.2% for AGIs below $25k, 0.9% for AGIs $25k-50k, 0.7% for AGIs $50k-75k, 0.4% for AGIs $75k-100k, 0.3% for AGIs $100k-200k)
Ordinary dividends: $2,450 (reported on 21.3% of returns)
Here:
$2,450
State:
$10,299
(% of AGI for various income ranges: 1.3% for AGIs below $25k, 1.8% for AGIs $25k-50k, 1.0% for AGIs $50k-75k, 0.1% for AGIs $75k-100k, 1.2% for AGIs $100k-200k)
Net capital gain/loss in AGI: +$1,309 (reported on 14.7% of returns)
Here:
+$1,309
State:
+$42,474
(% of AGI for various income ranges: 0.5% for AGIs $50k-75k, 1.1% for AGIs $100k-200k)
Profit/loss from business: +$9,233 (reported on 16.0% of returns)
Here:
+$9,233
State:
+$16,168
(% of AGI for various income ranges: 19.0% for AGIs below $25k, 4.2% for AGIs $50k-75k, 2.3% for AGIs $75k-100k)
Taxable individual retirement arrangement distribution: $14,667 (reported on 8.0% of returns)
12463:
$14,667
New York:
$17,621
Total itemized deductions: $18,304 (20% of AGI, reported on 32.0% of returns)
Here:
$18,304
State:
$34,985
Here:
20.1% of AGI
State:
21.3% of AGI
(% of AGI for various income ranges: 8.4% for AGIs below $25k, 8.9% for AGIs $25k-50k, 10.6% for AGIs $50k-75k, 12.4% for AGIs $75k-100k, 14.0% for AGIs $100k-200k)
Charity contributions: $1,750 (reported on 24.0% of returns)
Here:
$1,750
State:
$5,572
(% of AGI for various income ranges: 0.6% for AGIs $25k-50k, 0.6% for AGIs $50k-75k, 1.1% for AGIs $75k-100k, 1.2% for AGIs $100k-200k)
Taxes paid: $9,246 (reported on 32.0% of returns)
12463:
$9,246
State:
$18,656
(% of AGI for various income ranges: 3.8% for AGIs below $25k, 4.3% for AGIs $25k-50k, 4.6% for AGIs $50k-75k, 6.0% for AGIs $75k-100k, 7.8% for AGIs $100k-200k)
Earned income credit: $1,609 (reported on 14.7% of returns)
Here:
$1,609
State:
$2,230
(% of AGI for various income ranges: 3.7% for AGIs below $25k, 0.9% for AGIs $25k-50k)
Percentage of individuals using paid preparers for their 2012 taxes: 58.7%
Here:
59%
State:
66%
(% for various income ranges: 53.6% for AGIs below $25k, 58.8% for AGIs $25k-50k, 58.3% for AGIs $50k-75k, 66.7% for AGIs $75k-100k, 66.7% for AGIs $100k-200k)
Averages for the 2004 tax year for zip code 12463, filed in 2005:
Average Adjusted Gross Income (AGI) in 2004: $39,228 (Individual Income Tax Returns)
Here:
$39,228
State:
$59,519
Salary/wage: $36,271 (reported on 81.9% of returns)
Here:
$36,271
State:
$50,673
(% of AGI for various income ranges: 91.5% for AGIs below $10k, 68.7% for AGIs $10k-25k, 82.1% for AGIs $25k-50k, 80.1% for AGIs $50k-75k, 75.6% for AGIs $75k-100k, 66.2% for AGIs over 100k)
Taxable interest for individuals: $946 (reported on 54.9% of returns)
This zip code:
$946
New York:
$2,377
(% of AGI for various income ranges: 4.7% for AGIs below $10k, 2.3% for AGIs $10k-25k, 1.4% for AGIs $25k-50k, 1.6% for AGIs $50k-75k, 0.7% for AGIs $75k-100k, 0.7% for AGIs over 100k)
Taxable dividends: $1,669 (reported on 23.6% of returns)
Here:
$1,669
State:
$5,394
(% of AGI for various income ranges: 1.5% for AGIs below $10k, 2.1% for AGIs $10k-25k, 0.8% for AGIs $25k-50k, 1.1% for AGIs $50k-75k, 1.0% for AGIs $75k-100k, 0.4% for AGIs over 100k)
Net capital gain/loss: +$2,370 (reported on 14.6% of returns)
Here:
+$2,370
State:
+$23,581
(% of AGI for various income ranges: 0.4% for AGIs $10k-25k, 0.2% for AGIs $25k-50k, 1.8% for AGIs $50k-75k, 0.1% for AGIs $75k-100k, 1.3% for AGIs over 100k)
Profit/loss from business: +$5,931 (reported on 17.7% of returns)
Here:
+$5,931
State:
+$13,809
(% of AGI for various income ranges: 21.9% for AGIs below $10k, 10.2% for AGIs $10k-25k, 3.7% for AGIs $25k-50k, 0.8% for AGIs $50k-75k, 0.6% for AGIs $75k-100k)
IRA payment deduction: $2,870 (reported on 3.1% of returns)
12463:
$2,870
New York:
$3,115
Total itemized deductions: $15,801 (23% of AGI, reported on 30.5% of returns)
Here:
$15,801
State:
$25,864
Here:
22.9% of AGI
State:
21.9% of AGI
(% of AGI for various income ranges: 7.9% for AGIs $10k-25k, 10.2% for AGIs $25k-50k, 13.4% for AGIs $50k-75k, 13.0% for AGIs $75k-100k, 15.7% for AGIs over 100k)
Charity contributions deductions: $1,610 (2% of AGI, reported on 28.3% of returns)
Here:
$1,610
State:
$4,439
Here:
2.3% of AGI
State:
3.6% of AGI
(% of AGI for various income ranges: 0.9% for AGIs $10k-25k, 1.0% for AGIs $25k-50k, 1.2% for AGIs $50k-75k, 1.5% for AGIs $75k-100k, 1.3% for AGIs over 100k)
Total tax: $4,967 (reported on 78.4% of returns)
12463:
$4,967
State:
$11,730
(% of AGI for various income ranges: 6.2% for AGIs below $10k, 4.9% for AGIs $10k-25k, 7.4% for AGIs $25k-50k, 8.7% for AGIs $50k-75k, 11.4% for AGIs $75k-100k, 15.9% for AGIs over 100k)
Earned income credit: $1,519 (reported on 14.6% of returns)
Here:
$1,519
State:
$1,757
Percentage of individuals using paid preparers for their 2004 taxes: 60.6%
Here:
61%
State:
67%
(% for various income ranges: 56.2% for AGIs below $10k, 56.0% for AGIs $10k-25k, 60.9% for AGIs $25k-50k, 67.5% for AGIs $50k-75k, 65.4% for AGIs $75k-100k, 68.2% for AGIs over 100k)
Likely homosexual households (counted as self-reported same-sex unmarried-partner households)
Lesbian couples: 0.0% of all households
Gay men: 2.5% of all households
Household received Food Stamps/SNAP in the past 12 months: 0 Household did not receive Food Stamps/SNAP in the past 12 months: 643
Women who did not have a birth in the past 12 months: 399 (81 now married, 320 unmarried)
Housing units in zip code 12463 with a mortgage: 181 (13 second mortgage, 13 both second mortgage and home equity loan) Median monthly owner costs for units with a mortgage: $1,720 Median monthly owner costs for units without a mortgage: $565
Residents with income below the poverty level in 2022:
This zip code:
30.8%
Whole state:
14.3%
Residents with income below 50% of the poverty level in 2022:
This zip code:
16.7%
Whole state:
6.8%
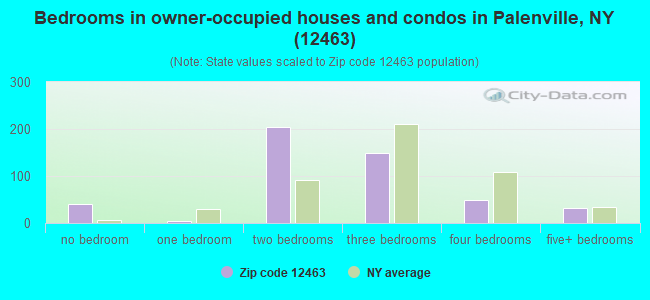
Median number of rooms in houses and condos:
Here:
5.6
State:
6.3
Median number of rooms in apartments:
Here:
6.2
State:
3.8
Notable locations in this zip code not listed on our city pages
Notable locations in zip code 12463: Mountain House (A), Catskill Public Library Palenville Branch (B), Palenville Fire Department (C), Palenville Fire District (D). Display/hide their locations on the map
Size of family households: 123 2-persons, 85 3-persons, 45 4-persons, 17 5-persons
Size of nonfamily households: 279 1-person, 114 2-persons
83 married couples with children.
76 single-parent households (76 women).
96.5% of residents of 12463 zip code speak English at home.
2.2% of residents speak other Indo-European language at home (100% very well).
1.5% of residents speak other language at home (100% very well).
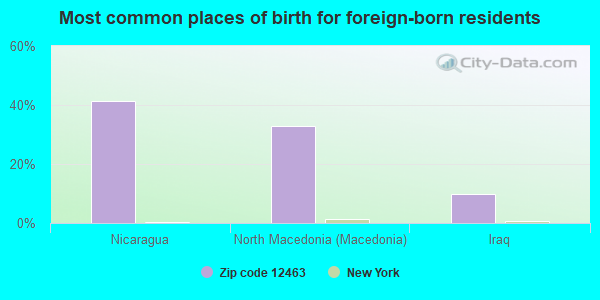
Foreign born population: 71 (5.4%) (100.0% of them are naturalized citizens)
This zip code:
5.4%
Whole state:
22.7%
41%Nicaragua
33%North Macedonia (Macedonia)
10%Iraq
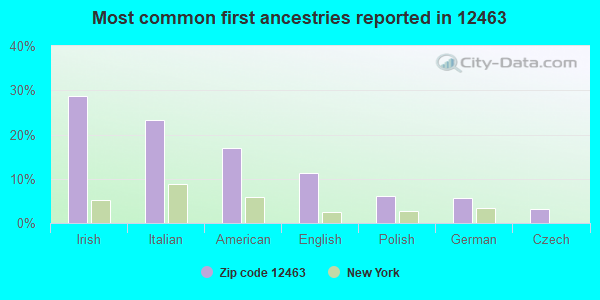
29%Irish
23%Italian
17%American
11%English
6%Polish
6%German
3%Czech
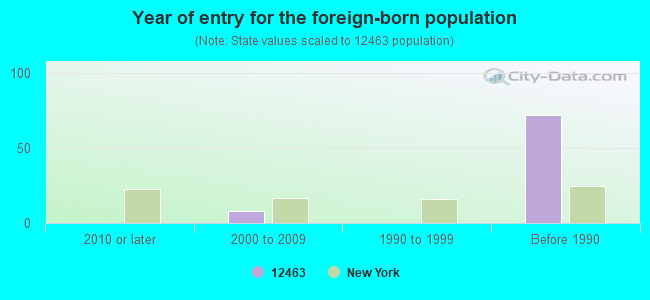
Year of entry for the foreign-born population
02010 or later
82000 to 2009
01990 to 1999
72Before 1990
Housing units lacking complete plumbing facilities: 4.7% Housing units lacking complete kitchen facilities: 4.7%
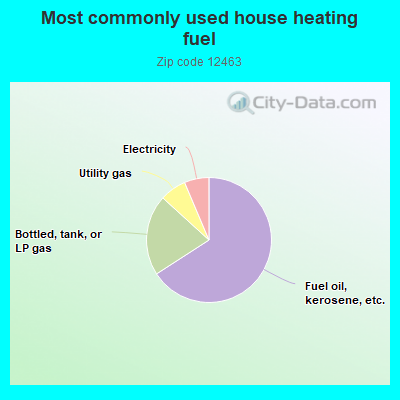
66.2%Fuel oil, kerosene, etc.
21.0%Bottled, tank, or LP gas
6.9%Utility gas
6.4%Electricity
Population in 1990: 1,195. Population change in the 1990s: +165 (+13.8%).
Place of birth for U.S.-born residents:
This state: 1,011
Northeast: 88
South: 127
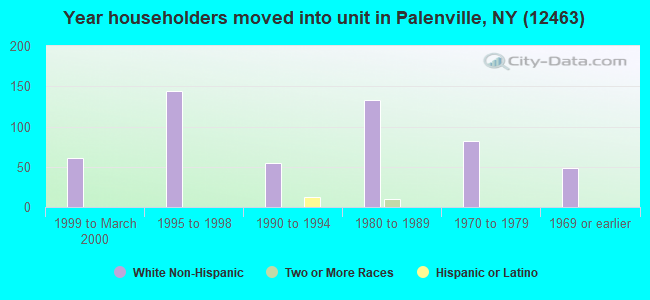
67% of the 12463 zip code residents lived in the same house 5 years ago. Out of people who lived in different houses, 57% lived in this county. Out of people who lived in different counties, 50% lived in New York.
90% of the 12463 zip code residents lived in the same house 1 year ago. Out of people who lived in different houses, 10% moved from this county. Out of people who lived in different houses, 43% moved from different county within same state. Out of people who lived in different houses, 25% moved from different state. Out of people who lived in different houses, 26% moved from abroad.
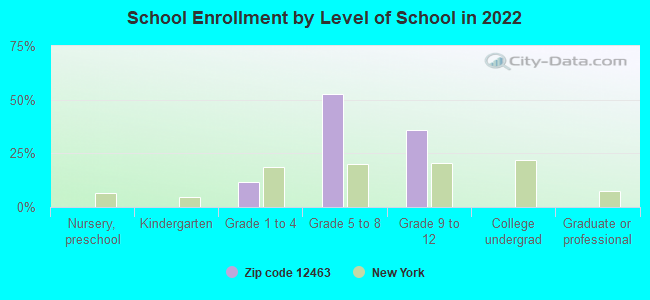
Private vs. public school enrollment:
Students in private schools in grades 1 to 8 (elementary and middle school):
Here:
0.0%
New York:
15.6%
Students in private schools in grades 9 to 12 (high school):
Here:
0.0%
New York:
15.0%
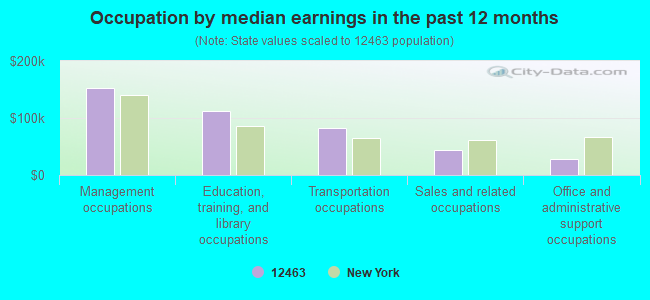
Occupation by median earnings in the past 12 months ($)
153,496Management occupations
112,791Education, training, and library occupations
82,157Transportation occupations
44,156Sales and related occupations
28,044Office and administrative support occupations
Top industries in this zip code by the number of employees in 2005:
Wholesale Trade: Jewelry, Watch, Precious Stone, and Precious Metal Merchant Wholesalers (10-19: 1)
Wholesale Trade: Other Miscellaneous Durable Goods Merchant Wholesalers (10-19: 1)
Construction: All Other Specialty Trade Contractors (1-4: 2)
Construction: Residential Remodelers (1-4: 1)
Construction: New Single-Family Housing Construction (except Operative Builders) (1-4: 1)
Construction: Commercial and Institutional Building Construction (1-4: 1)
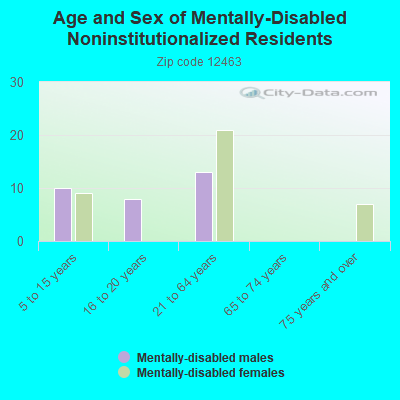
People in group quarters in 2000:
60 people in homes for the mentally retarded
Fatal accident statistics in 2010:
Fatal accident count: 1
Vehicles involved in fatal accidents: 1
Fatal accidents caused by drunken drivers: 0
Fatalities: 2
Persons involved in fatal accidents: 2
Pedestrians involved in fatal accidents: 0
2002 - 2018 National Fire Incident Reporting System (NFIRS) incidents
According to the data from the years 2002 - 2018 the average number of fire incidents per year is 8. The highest number of fires - 15 took place in 2014, and the least - 3 in 2002. The data has a growing trend.
When looking into fire subcategories, the most incidents belonged to: Structure Fires (53.6%), and Outside Fires (32.1%).
Fire incident types reported to NFIRS in Zip Code 12463

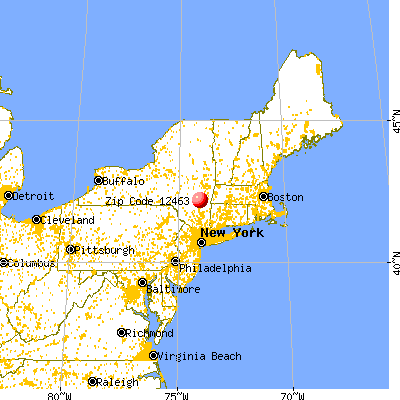


 Nearest zip codes: 12473, 12436, 12482, 12424, 12413, 12414.
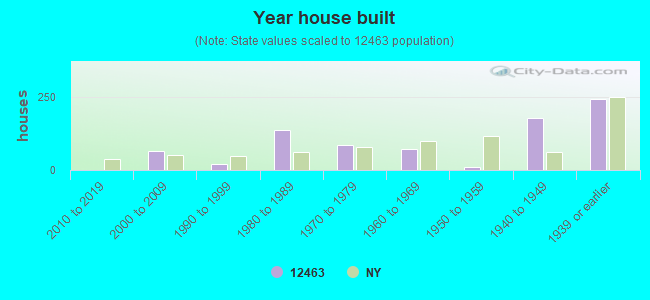


 According to the data from the years 2002 - 2018 the average number of fire incidents per year is 8. The highest number of fires - 15 took place in 2014, and the least - 3 in 2002. The data has a growing trend.
 When looking into fire subcategories, the most incidents belonged to: Structure Fires (53.6%), and Outside Fires (32.1%).