Estimated zip code population in 2022: 3,225 Zip code population in 2010: 2,891 Zip code population in 2000: 2,350
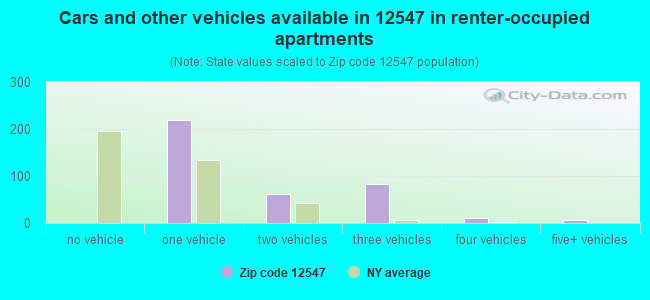
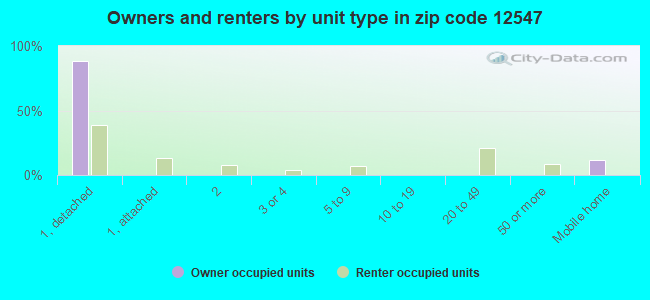
Houses and condos: 1,485 Renter-occupied apartments: 383
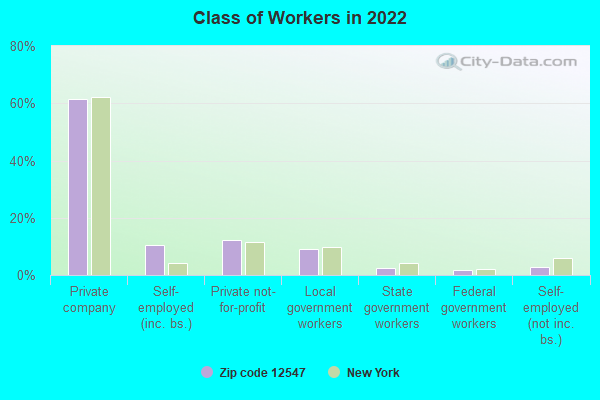
% of renters here:
28%
State:
46%
March 2022 cost of living index in zip code 12547: 98.7 (near average, U.S. average is 100)
Land area: 10.3 sq. mi. Water area: 0.2 sq. mi.
Population density: 312 people per square mile
(very low).
OSM Map
General Map
Google Map
MSN Map
OSM Map
General Map
Google Map
MSN Map
OSM Map
General Map
Google Map
MSN Map
OSM Map
General Map
Google Map
MSN Map
Please wait while loading the map...
Real estate property taxes paid for housing units in 2022:
This zip code:
2.6% ($9,805)
New York:
1.5% ($6,180)
Median real estate property taxes paid for housing units with mortgages in 2022: $9,858 (2.4%) Median real estate property taxes paid for housing units with no mortgage in 2022: $8,953 (2.8%)
Business Search- 14 Million verified businesses
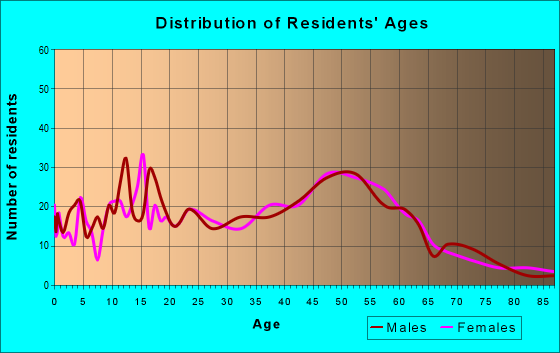
Males: 1,673
(51.9%)
Females: 1,551
(48.1%)
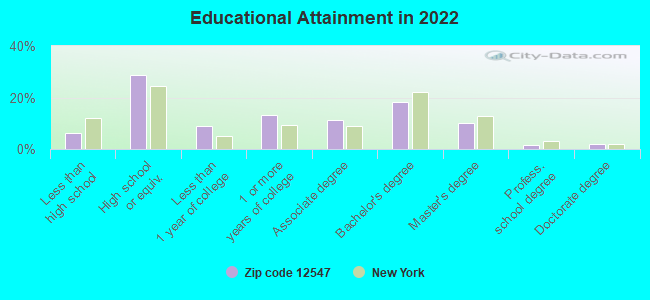
For population 25 years and over in 12547:
High school or higher: 93.7%
Bachelor's degree or higher: 31.6%
Graduate or professional degree: 13.5%
Unemployed: 1.0%
Mean travel time to work (commute): 31.4 minutes
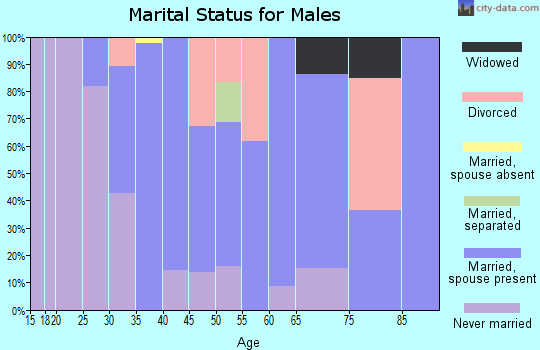
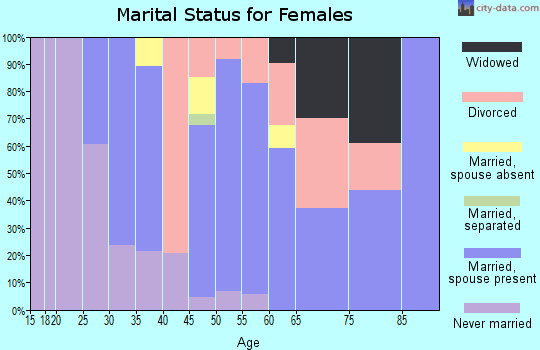
For population 15 years and over in 12547:
Never married: 31.0%
Now married: 54.2%
Separated: 1.1%
Widowed: 4.2%
Divorced: 9.5%
Zip code 12547 compared to state average:
Unemployed percentage significantly below state average.
Black race population percentage below state average.
Hispanic race population percentage below state average.
Median age above state average.
Foreign-born population percentage significantly below state average.
Renting percentage below state average.
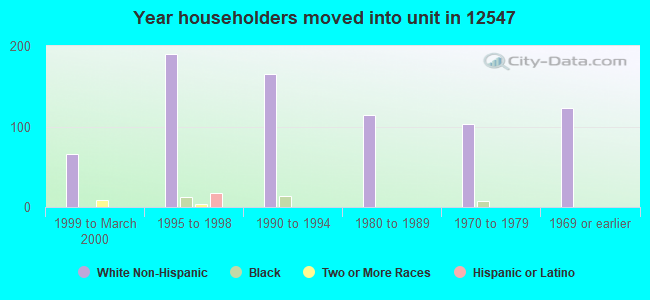
Length of stay since moving in significantly above state average.
Number of rooms per house above state average.
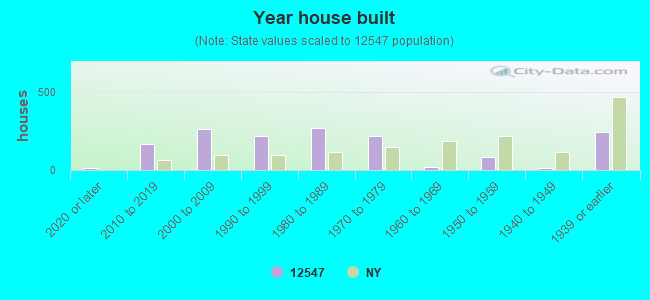
House age below state average.
Number of college students significantly below state average.
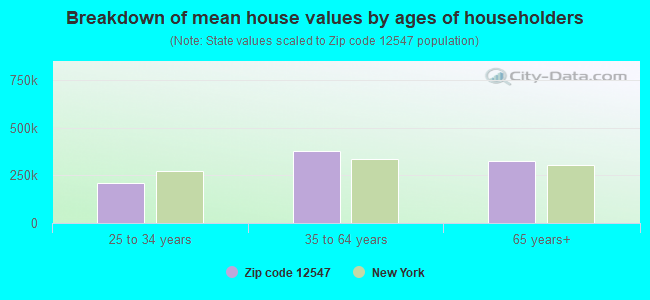
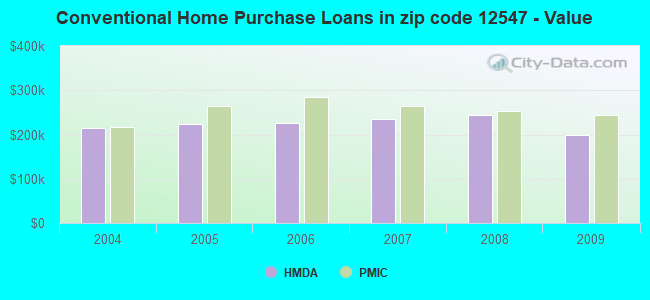
Estimated median house/condo value in 2022: $379,030
12547:
$379,030
New York:
$400,400
According to our research of New York and other state lists, there was 1 registered sex offender living in 12547 zip code as of April 27, 2024. The ratio of all residents to sex offenders in zip code 12547 is 2,914 to 1. The ratio of registered sex offenders to all residents in this zip code is much lower than the state average.
Median resident age:
This zip code:
45.4 years
New York median age:
40.0 years
Average household size:
This zip code:
2.3 people
New York:
2.5 people
Averages for the 2020 tax year for zip code 12547, filed in 2021:
Average Adjusted Gross Income (AGI) in 2020: $74,070 (Individual Income Tax Returns)
Here:
$74,070
State:
$90,930
Salary/wage: $64,514 (reported on 83.6% of returns)
Here:
$64,514
State:
$72,104
(% of AGI for various income ranges: 1434.8% for AGIs below $25k, 4157.4% for AGIs $25k-50k, 6399.4% for AGIs $50k-75k, 9748.2% for AGIs $75k-100k, 17385.6% for AGIs $100k-200k, 71906.7% for AGIs over 200k)
Taxable interest for individuals: $897 (reported on 37.1% of returns)
This zip code:
$897
New York:
$3,075
(% of AGI for various income ranges: 16.8% for AGIs below $25k, 7.8% for AGIs $25k-50k, 32.4% for AGIs $50k-75k, 89.1% for AGIs $75k-100k, 142.5% for AGIs $100k-200k, 283.3% for AGIs over 200k)
Ordinary dividends: $4,453 (reported on 20.1% of returns)
Here:
$4,453
State:
$11,095
(% of AGI for various income ranges: 28.0% for AGIs below $25k, 23.7% for AGIs $25k-50k, 62.9% for AGIs $50k-75k, 116.4% for AGIs $75k-100k, 260.0% for AGIs $100k-200k, 2133.3% for AGIs over 200k)
Net capital gain/loss in AGI: +$12,886 (reported on 18.2% of returns)
Here:
+$12,886
State:
+$44,925
(% of AGI for various income ranges: 7.2% for AGIs below $25k, 12.2% for AGIs $25k-50k, 84.7% for AGIs $50k-75k, 270.0% for AGIs $75k-100k, 536.9% for AGIs $100k-200k, 7953.3% for AGIs over 200k)
Profit/loss from business: +$10,509 (reported on 13.8% of returns)
Here:
+$10,509
State:
+$14,940
(% of AGI for various income ranges: 124.4% for AGIs below $25k, 224.1% for AGIs $25k-50k, 437.6% for AGIs $50k-75k, 320.0% for AGIs $75k-100k, 187.5% for AGIs $100k-200k)
Taxable individual retirement arrangement distribution: $11,492 (reported on 8.2% of returns)
12547:
$11,492
New York:
$19,609
(% of AGI for various income ranges: 122.8% for AGIs below $25k, 282.9% for AGIs $50k-75k, 441.2% for AGIs $100k-200k)
Total itemized deductions: $27,175 (reported on 10.1% of returns)
Here:
$27,175
State:
$39,326
(% of AGI for various income ranges: 300.7% for AGIs $25k-50k, 341.8% for AGIs $50k-75k, 628.2% for AGIs $75k-100k, 767.5% for AGIs $100k-200k, 3453.3% for AGIs over 200k)
Charity contributions: $3,146 (reported on 8.2% of returns)
Here:
$3,146
State:
$15,420
(% of AGI for various income ranges: 15.2% for AGIs below $25k, 48.2% for AGIs $50k-75k, 30.0% for AGIs $75k-100k, 70.6% for AGIs $100k-200k, 476.7% for AGIs over 200k)
Taxes paid: $9,412 (reported on 10.1% of returns)
12547:
$9,412
State:
$9,183
(% of AGI for various income ranges: 111.9% for AGIs $25k-50k, 144.1% for AGIs $50k-75k, 257.3% for AGIs $75k-100k, 241.2% for AGIs $100k-200k, 966.7% for AGIs over 200k)
Earned income credit: $1,735 (reported on 10.7% of returns)
Here:
$1,735
State:
$2,138
(% of AGI for various income ranges: 65.2% for AGIs below $25k, 48.9% for AGIs $25k-50k)
Percentage of individuals using paid preparers for their 2020 taxes: 93.1%
Here:
93%
State:
95%
(% for various income ranges: 92.9% for AGIs below $25k, 92.3% for AGIs $25k-50k, 95.7% for AGIs $50k-75k, 94.1% for AGIs $75k-100k, 92.9% for AGIs $100k-200k, 90.0% for AGIs over 200k)
Averages for the 2012 tax year for zip code 12547, filed in 2013:
Average Adjusted Gross Income (AGI) in 2012: $64,807 (Individual Income Tax Returns)
Here:
$64,807
State:
$77,088
Salary/wage: $55,807 (reported on 85.7% of returns)
Here:
$55,807
State:
$60,593
(% of AGI for various income ranges: 72.2% for AGIs below $25k, 80.0% for AGIs $25k-50k, 76.1% for AGIs $50k-75k, 77.0% for AGIs $75k-100k, 81.3% for AGIs $100k-200k, 56.6% for AGIs over 200k)
Taxable interest for individuals: $848 (reported on 47.1% of returns)
This zip code:
$848
New York:
$3,125
(% of AGI for various income ranges: 0.7% for AGIs below $25k, 1.0% for AGIs $25k-50k, 0.7% for AGIs $50k-75k, 0.5% for AGIs $75k-100k, 0.6% for AGIs $100k-200k, 0.3% for AGIs over 200k)
Ordinary dividends: $2,660 (reported on 25.0% of returns)
Here:
$2,660
State:
$10,299
(% of AGI for various income ranges: 2.0% for AGIs below $25k, 0.7% for AGIs $25k-50k, 0.9% for AGIs $50k-75k, 0.9% for AGIs $75k-100k, 0.9% for AGIs $100k-200k, 1.4% for AGIs over 200k)
Net capital gain/loss in AGI: +$7,996 (reported on 17.1% of returns)
Here:
+$7,996
State:
+$42,474
(% of AGI for various income ranges: 1.7% for AGIs $100k-200k, 7.5% for AGIs over 200k)
Profit/loss from business: +$8,100 (reported on 15.0% of returns)
Here:
+$8,100
State:
+$16,168
(% of AGI for various income ranges: 12.2% for AGIs below $25k, 3.0% for AGIs $25k-50k, 1.1% for AGIs $50k-75k, 0.8% for AGIs $75k-100k, 1.7% for AGIs $100k-200k)
Taxable individual retirement arrangement distribution: $11,267 (reported on 8.6% of returns)
12547:
$11,267
New York:
$17,621
(% of AGI for various income ranges: 1.8% for AGIs below $25k, 1.1% for AGIs $25k-50k, 3.1% for AGIs $50k-75k, 2.5% for AGIs $100k-200k)
Total itemized deductions: $27,305 (24% of AGI, reported on 40.7% of returns)
Here:
$27,305
State:
$34,985
Here:
23.7% of AGI
State:
21.3% of AGI
(% of AGI for various income ranges: 11.6% for AGIs below $25k, 12.1% for AGIs $25k-50k, 16.3% for AGIs $50k-75k, 18.7% for AGIs $75k-100k, 19.7% for AGIs $100k-200k, 17.3% for AGIs over 200k)
Charity contributions: $2,315 (reported on 34.3% of returns)
Here:
$2,315
State:
$5,572
(% of AGI for various income ranges: 0.9% for AGIs $25k-50k, 1.2% for AGIs $50k-75k, 1.1% for AGIs $75k-100k, 1.7% for AGIs $100k-200k, 1.2% for AGIs over 200k)
Taxes paid: $14,062 (reported on 40.0% of returns)
12547:
$14,062
State:
$18,656
(% of AGI for various income ranges: 4.2% for AGIs below $25k, 5.4% for AGIs $25k-50k, 7.3% for AGIs $50k-75k, 9.3% for AGIs $75k-100k, 10.6% for AGIs $100k-200k, 9.6% for AGIs over 200k)
Earned income credit: $2,000 (reported on 12.9% of returns)
Here:
$2,000
State:
$2,230
(% of AGI for various income ranges: 5.2% for AGIs below $25k, 0.7% for AGIs $25k-50k)
Percentage of individuals using paid preparers for their 2012 taxes: 62.9%
Here:
63%
State:
66%
(% for various income ranges: 52.1% for AGIs below $25k, 62.1% for AGIs $25k-50k, 68.2% for AGIs $50k-75k, 66.7% for AGIs $75k-100k, 71.4% for AGIs $100k-200k, 100.0% for AGIs over 200k)
Averages for the 2004 tax year for zip code 12547, filed in 2005:
Average Adjusted Gross Income (AGI) in 2004: $51,659 (Individual Income Tax Returns)
Here:
$51,659
State:
$59,519
Salary/wage: $48,628 (reported on 86.1% of returns)
Here:
$48,628
State:
$50,673
(% of AGI for various income ranges: 131.1% for AGIs below $10k, 73.5% for AGIs $10k-25k, 83.6% for AGIs $25k-50k, 83.7% for AGIs $50k-75k, 85.7% for AGIs $75k-100k, 76.5% for AGIs over 100k)
Taxable interest for individuals: $1,206 (reported on 57.6% of returns)
This zip code:
$1,206
New York:
$2,377
(% of AGI for various income ranges: 7.5% for AGIs below $10k, 2.6% for AGIs $10k-25k, 0.9% for AGIs $25k-50k, 1.3% for AGIs $50k-75k, 0.5% for AGIs $75k-100k, 1.6% for AGIs over 100k)
Taxable dividends: $1,752 (reported on 31.1% of returns)
Here:
$1,752
State:
$5,394
(% of AGI for various income ranges: 4.8% for AGIs below $10k, 1.2% for AGIs $10k-25k, 0.8% for AGIs $25k-50k, 1.0% for AGIs $50k-75k, 0.8% for AGIs $75k-100k, 1.2% for AGIs over 100k)
Net capital gain/loss: +$3,917 (reported on 22.4% of returns)
Here:
+$3,917
State:
+$23,581
(% of AGI for various income ranges: -3.2% for AGIs below $10k, 0.9% for AGIs $10k-25k, 0.1% for AGIs $25k-50k, 0.2% for AGIs $50k-75k, 0.2% for AGIs $75k-100k, 4.2% for AGIs over 100k)
Profit/loss from business: +$7,248 (reported on 11.9% of returns)
Here:
+$7,248
State:
+$13,809
(% of AGI for various income ranges: 7.1% for AGIs below $10k, 8.3% for AGIs $10k-25k, 1.6% for AGIs $25k-50k, 0.3% for AGIs $50k-75k, 1.2% for AGIs $75k-100k, 1.3% for AGIs over 100k)
IRA payment deduction: $2,872 (reported on 3.0% of returns)
12547:
$2,872
New York:
$3,115
Total itemized deductions: $20,249 (23% of AGI, reported on 40.3% of returns)
Here:
$20,249
State:
$25,864
Here:
23.1% of AGI
State:
21.9% of AGI
(% of AGI for various income ranges: 13.6% for AGIs $10k-25k, 11.4% for AGIs $25k-50k, 15.4% for AGIs $50k-75k, 19.0% for AGIs $75k-100k, 17.1% for AGIs over 100k)
Charity contributions deductions: $2,323 (3% of AGI, reported on 36.9% of returns)
Here:
$2,323
State:
$4,439
Here:
2.6% of AGI
State:
3.6% of AGI
(% of AGI for various income ranges: 1.1% for AGIs $10k-25k, 0.9% for AGIs $25k-50k, 1.7% for AGIs $50k-75k, 1.7% for AGIs $75k-100k, 2.1% for AGIs over 100k)
Total tax: $7,353 (reported on 80.3% of returns)
12547:
$7,353
State:
$11,730
(% of AGI for various income ranges: 4.9% for AGIs below $10k, 4.8% for AGIs $10k-25k, 7.4% for AGIs $25k-50k, 8.9% for AGIs $50k-75k, 9.7% for AGIs $75k-100k, 16.8% for AGIs over 100k)
Earned income credit: $1,461 (reported on 10.0% of returns)
Here:
$1,461
State:
$1,757
Percentage of individuals using paid preparers for their 2004 taxes: 67.1%
Here:
67%
State:
67%
(% for various income ranges: 61.0% for AGIs below $10k, 68.8% for AGIs $10k-25k, 63.8% for AGIs $25k-50k, 70.9% for AGIs $50k-75k, 67.8% for AGIs $75k-100k, 73.8% for AGIs over 100k)
Likely homosexual households (counted as self-reported same-sex unmarried-partner households)
Lesbian couples: 0.0% of all households
Gay men: 0.7% of all households
Household received Food Stamps/SNAP in the past 12 months: 77 Household did not receive Food Stamps/SNAP in the past 12 months: 1,258
Women who had a birth in the past 12 months: 26 (26 now married, 0 unmarried) Women who did not have a birth in the past 12 months: 493 (230 now married, 260 unmarried)
Housing units in zip code 12547 with a mortgage: 543 (59 second mortgage, 52 both second mortgage and home equity loan) Median monthly owner costs for units with a mortgage: $2,616 Median monthly owner costs for units without a mortgage: $1,157
Residents with income below the poverty level in 2022:
This zip code:
17.2%
Whole state:
14.3%
Residents with income below 50% of the poverty level in 2022:
This zip code:
8.6%
Whole state:
6.8%
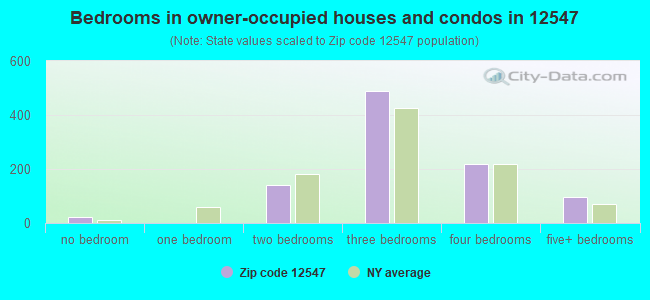
Median number of rooms in houses and condos:
Here:
6.8
State:
6.3
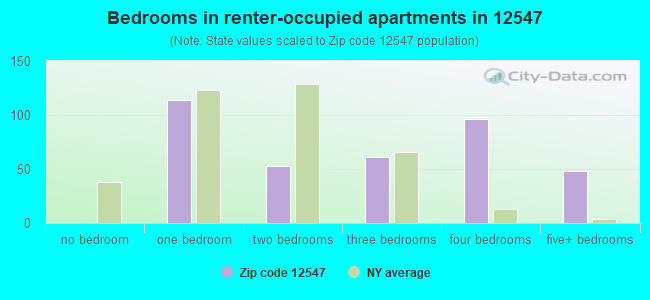
Median number of rooms in apartments:
Here:
5.8
State:
3.8
Notable locations in this zip code not listed on our city pages
Notable locations in zip code 12547: Split Rail Nursery (A), Fino Farms (B), Hepworth Farms (C), Kent Farm (D), Prospect Hill Orchards (E), Trapanis Blackberry Rose Farms (F), Sarah Hull Hallock Free Library (G). Display/hide their locations on the map
Churches in zip code 12547 include: Lattingtown Baptist Church (A), Milton - Marlboro United Methodist Church (B), Saint James Roman Catholic Church (C). Display/hide their locations on the map
345 married couples with children.
294 single-parent households (85 men, 209 women).
92.6% of residents of 12547 zip code speak English at home.
5.0% of residents speak Spanish at home (90% very well, 10% well).
0.6% of residents speak other Indo-European language at home (100% very well).
0.6% of residents speak Asian or Pacific Island language at home (100% very well).
0.6% of residents speak other language at home (100% very well).
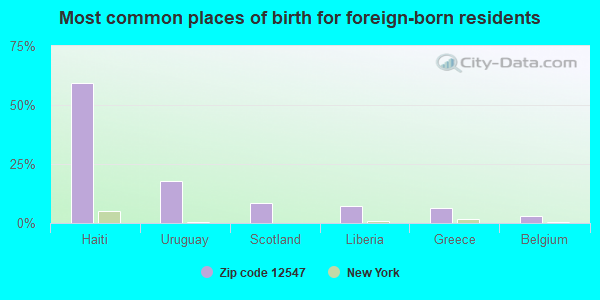
Foreign born population: 110 (3.4%) (83.5% of them are naturalized citizens)
This zip code:
3.4%
Whole state:
22.7%
59%Haiti
18%Uruguay
8%Scotland
7%Liberia
6%Greece
3%Belgium
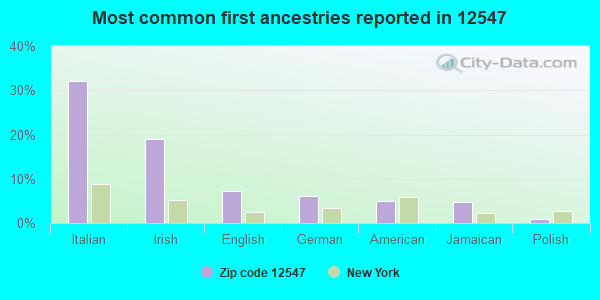
32%Italian
19%Irish
7%English
6%German
5%American
5%Jamaican
1%Polish
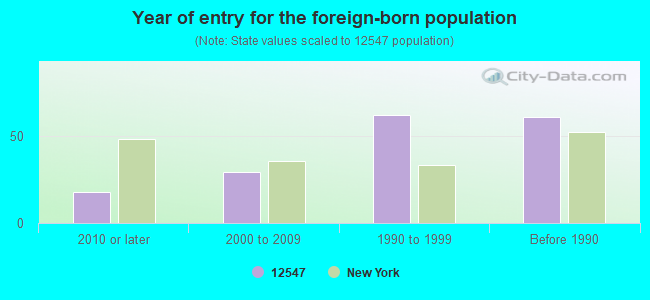
Year of entry for the foreign-born population
182010 or later
292000 to 2009
621990 to 1999
61Before 1990
Facilities with environmental interests located in this zip code:
INTERNATIONAL PALLET INC (2005 ROUTE 9W in MILTON, NY)
AIR MINOR (AIRS/AFS) STATE MASTER (New York facility tracking) - AIR PROGRAM Business SIC classification: WOOD PALLETS AND SKIDS Business NAICS classification: WOOD CONTAINER AND PALLET MANUFACTURING.
AGWAY INC MILTON HORT CROP C (RTE 9W in MILTON, NY)
(Resource Conservation and Recovery Act (tracking hazardous waste))
AGWAY PETROLEUM CORP (SANDS AVE in MILTON, NY)
(Resource Conservation and Recovery Act (tracking hazardous waste))
AGCHEM SERVICE (PO BOX 800, MILTON TURNPIKE in MILTON, NY)
COMPLIANCE ACTIVITY (Tracking inspections of insecticide, fungicide, and rodenticide, and toxic substances)
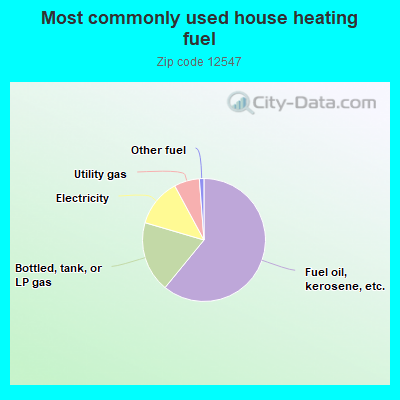
61.1%Fuel oil, kerosene, etc.
18.7%Bottled, tank, or LP gas
12.6%Electricity
6.7%Utility gas
1.2%Other fuel
Population in 1990: 2,834.
Place of birth for U.S.-born residents:
This state: 2,705
Northeast: 210
Midwest: 35
South: 48
West: 38
68% of the 12547 zip code residents lived in the same house 5 years ago. Out of people who lived in different houses, 56% lived in this county. Out of people who lived in different counties, 50% lived in New York.
94% of the 12547 zip code residents lived in the same house 1 year ago. Out of people who lived in different houses, 24% moved from this county. Out of people who lived in different houses, 54% moved from different county within same state. Out of people who lived in different houses, 22% moved from different state.
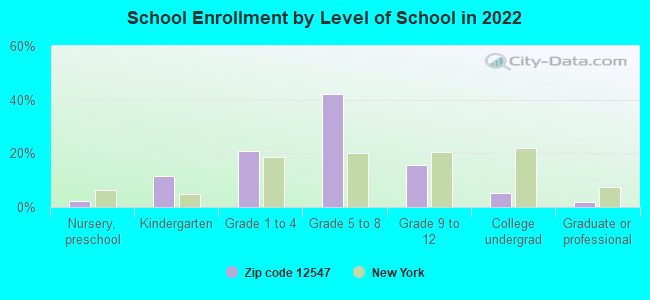
Private vs. public school enrollment:
Students in private schools in grades 1 to 8 (elementary and middle school): 14
Here:
3.4%
New York:
15.6%
Students in private schools in grades 9 to 12 (high school):
Here:
0.0%
New York:
15.0%
Students in private undergraduate colleges: 3
Here:
11.2%
New York:
39.2%
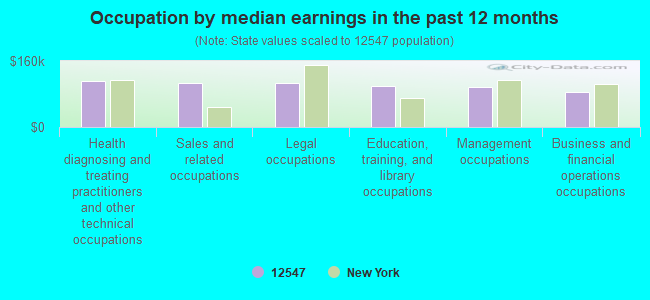
Occupation by median earnings in the past 12 months ($)
111,289Health diagnosing and treating practitioners and other technical occupations
106,548Sales and related occupations
105,831Legal occupations
99,043Education, training, and library occupations
96,459Management occupations
83,706Business and financial operations occupations
Companies with federal contracts located in this zip code:
ALLSTATE APPLE EXCHANGE INC (65 OLD INDIAN RD in MILTON, NY; small business) : $796,355 in 39 contractsfrom 2003 to 2006
Contracts for Fruits and Vegetables by Defense Logistics Agency, Agricultural Marketing Service Signed by year:2000: $0; 2001: $0; 2002: $0; 2003: $312,179; 2004: $31,806; 2005: $326,107; 2006: $126,263.
Biggest contracts:
$60,614 with Defense Logistics Agency for Fruits and Vegetables. Signed on 2003-11-06. Completion date: 2003-11-06.
$49,338, same as above.Signed on 2006-03-09. Completion date: 2006-03-09.
$41,984, same as above.Signed on 2005-04-02. Completion date: 2005-04-02.
$37,485, same as above.Signed on 2003-11-10. Completion date: 2003-11-10.
Top industries in this zip code by the number of employees in 2005:
Professional, Scientific, and Technical Services: Research and Development in the Physical, Engineering, and Life Sciences (250-499 employees: 1 establishment)
Health Care and Social Assistance: Child Day Care Services (20-49: 1, 10-19: 1, 1-4: 2)
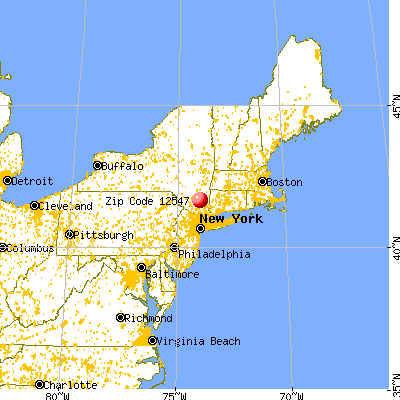


 Nearest zip codes: 12542, 12528, 12515, 12601, 12604, 12512.