Estimated zip code population in 2022: 1,056 Zip code population in 2010: 1,494 Zip code population in 2000: 1,528
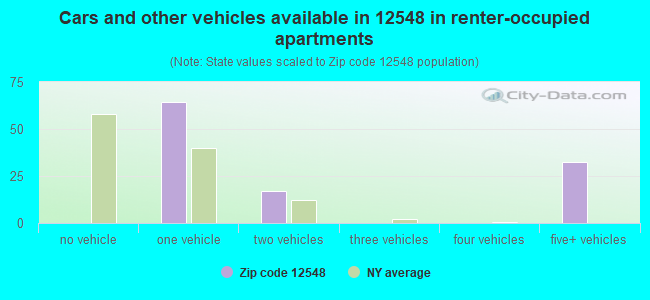
Houses and condos: 408 Renter-occupied apartments: 116
% of renters here:
30%
State:
46%
March 2022 cost of living index in zip code 12548: 98.3 (near average, U.S. average is 100)
Land area: 5.9 sq. mi. Water area: 0.2 sq. mi.
Population density: 180 people per square mile
(very low).
OSM Map
General Map
Google Map
MSN Map
OSM Map
General Map
Google Map
MSN Map
OSM Map
General Map
Google Map
MSN Map
OSM Map
General Map
Google Map
MSN Map
Please wait while loading the map...
Real estate property taxes paid for housing units in 2022:
This zip code:
2.8% ($8,877)
New York:
1.5% ($6,180)
Median real estate property taxes paid for housing units with mortgages in 2022: $8,504 Median real estate property taxes paid for housing units with no mortgage in 2022: $9,347
Business Search- 14 Million verified businesses
Males: 505
(47.8%)
Females: 551
(52.2%)
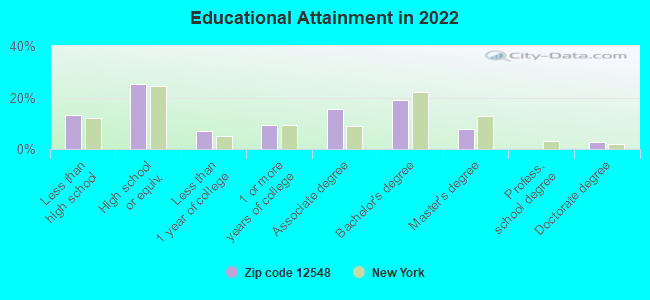
For population 25 years and over in 12548:
High school or higher: 87.2%
Bachelor's degree or higher: 30.2%
Graduate or professional degree: 10.9%
Unemployed: 1.0%
Mean travel time to work (commute): 24.9 minutes
For population 15 years and over in 12548:
Never married: 29.8%
Now married: 61.2%
Separated: 0.0%
Widowed: 6.1%
Divorced: 2.9%
Zip code 12548 compared to state average:
Unemployed percentage significantly below state average.
Black race population percentage significantly below state average.
Median age significantly above state average.
Foreign-born population percentage significantly below state average.
Renting percentage below state average.
Number of rooms per house above state average.
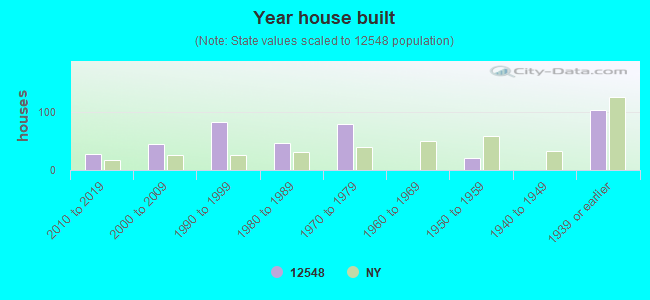
House age below state average.
Number of college students significantly below state average.
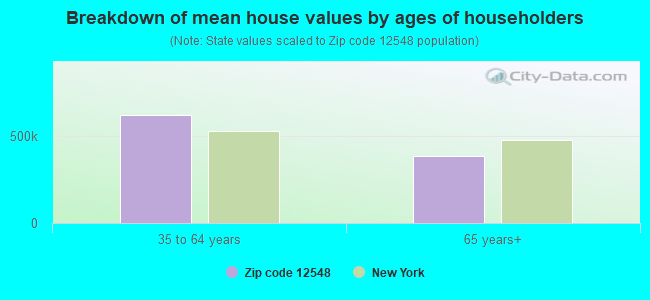
Estimated median house/condo value in 2022: $318,673
12548:
$318,673
New York:
$400,400
According to our research of New York and other state lists, there was 1 registered sex offender living in 12548 zip code as of April 27, 2024. The ratio of all residents to sex offenders in zip code 12548 is 1,439 to 1. The ratio of registered sex offenders to all residents in this zip code is lower than the state average.
Median resident age:
This zip code:
51.5 years
New York median age:
40.0 years
Average household size:
This zip code:
2.7 people
New York:
2.5 people
Averages for the 2020 tax year for zip code 12548, filed in 2021:
Average Adjusted Gross Income (AGI) in 2020: $73,636 (Individual Income Tax Returns)
Here:
$73,636
State:
$90,930
Salary/wage: $58,544 (reported on 82.5% of returns)
Here:
$58,544
State:
$72,104
(% of AGI for various income ranges: 1130.7% for AGIs below $25k, 3625.3% for AGIs $25k-50k, 5876.7% for AGIs $50k-75k, 7892.9% for AGIs $75k-100k, 16616.0% for AGIs $100k-200k)
Taxable interest for individuals: $659 (reported on 33.8% of returns)
This zip code:
$659
New York:
$3,075
(% of AGI for various income ranges: 7.1% for AGIs below $25k, 8.7% for AGIs $25k-50k, 31.1% for AGIs $50k-75k, 31.4% for AGIs $75k-100k, 105.0% for AGIs $100k-200k)
Ordinary dividends: $2,714 (reported on 17.5% of returns)
Here:
$2,714
State:
$11,095
(% of AGI for various income ranges: 14.3% for AGIs below $25k, 25.6% for AGIs $50k-75k, 65.7% for AGIs $75k-100k, 291.0% for AGIs $100k-200k)
Net capital gain/loss in AGI: +$8,254 (reported on 16.2% of returns)
Here:
+$8,254
State:
+$44,925
(% of AGI for various income ranges: 10.7% for AGIs $25k-50k, 50.0% for AGIs $50k-75k, 1012.0% for AGIs $100k-200k)
Profit/loss from business: +$4,625 (reported on 10.0% of returns)
Here:
+$4,625
State:
+$14,940
(% of AGI for various income ranges: 137.9% for AGIs below $25k, 173.3% for AGIs $25k-50k)
Taxable individual retirement arrangement distribution: $11,571 (reported on 8.8% of returns)
12548:
$11,571
New York:
$19,609
(% of AGI for various income ranges: 370.0% for AGIs $50k-75k, 477.0% for AGIs $100k-200k)
Total itemized deductions: $26,186 (reported on 8.8% of returns)
Here:
$26,186
State:
$39,326
(% of AGI for various income ranges: 995.7% for AGIs $75k-100k, 1136.0% for AGIs $100k-200k)
Charity contributions: $5,220 (reported on 6.2% of returns)
Here:
$5,220
State:
$15,420
(% of AGI for various income ranges: 64.4% for AGIs $50k-75k, 203.0% for AGIs $100k-200k)
Taxes paid: $9,143 (reported on 8.8% of returns)
12548:
$9,143
State:
$9,183
(% of AGI for various income ranges: 465.7% for AGIs $75k-100k, 314.0% for AGIs $100k-200k)
Earned income credit: $1,629 (reported on 8.8% of returns)
Here:
$1,629
State:
$2,138
(% of AGI for various income ranges: 53.6% for AGIs below $25k, 26.0% for AGIs $25k-50k)
Percentage of individuals using paid preparers for their 2020 taxes: 92.5%
Here:
92%
State:
95%
(% for various income ranges: 95.2% for AGIs below $25k, 94.4% for AGIs $25k-50k, 91.7% for AGIs $50k-75k, 90.0% for AGIs $75k-100k, 93.8% for AGIs $100k-200k, 66.7% for AGIs over 200k)
Averages for the 2012 tax year for zip code 12548, filed in 2013:
Average Adjusted Gross Income (AGI) in 2012: $54,573 (Individual Income Tax Returns)
Here:
$54,573
State:
$77,088
Salary/wage: $50,032 (reported on 86.1% of returns)
Here:
$50,032
State:
$60,593
(% of AGI for various income ranges: 71.5% for AGIs below $25k, 87.0% for AGIs $25k-50k, 75.2% for AGIs $50k-75k, 78.3% for AGIs $75k-100k, 79.1% for AGIs $100k-200k)
Taxable interest for individuals: $391 (reported on 40.5% of returns)
This zip code:
$391
New York:
$3,125
(% of AGI for various income ranges: 1.0% for AGIs below $25k, 0.1% for AGIs $25k-50k, 0.4% for AGIs $50k-75k, 0.2% for AGIs $75k-100k, 0.2% for AGIs $100k-200k)
Ordinary dividends: $1,927 (reported on 19.0% of returns)
Here:
$1,927
State:
$10,299
(% of AGI for various income ranges: 1.5% for AGIs below $25k, 0.8% for AGIs $50k-75k, 0.2% for AGIs $75k-100k, 0.9% for AGIs $100k-200k)
Net capital gain/loss in AGI: +$286 (reported on 8.9% of returns)
Here:
+$286
State:
+$42,474
(% of AGI for various income ranges: 0.1% for AGIs $100k-200k)
Profit/loss from business: +$3,538 (reported on 10.1% of returns)
Here:
+$3,538
State:
+$16,168
(% of AGI for various income ranges: 2.6% for AGIs below $25k, 1.9% for AGIs $25k-50k, 1.0% for AGIs $75k-100k)
Taxable individual retirement arrangement distribution: $6,700 (reported on 5.1% of returns)
12548:
$6,700
New York:
$17,621
Total itemized deductions: $22,372 (23% of AGI, reported on 36.7% of returns)
Here:
$22,372
State:
$34,985
Here:
23.2% of AGI
State:
21.3% of AGI
(% of AGI for various income ranges: 11.9% for AGIs $25k-50k, 16.0% for AGIs $50k-75k, 18.1% for AGIs $75k-100k, 17.0% for AGIs $100k-200k)
Charity contributions: $1,940 (reported on 31.6% of returns)
Here:
$1,940
State:
$5,572
(% of AGI for various income ranges: 0.7% for AGIs $25k-50k, 1.1% for AGIs $50k-75k, 2.0% for AGIs $75k-100k, 1.1% for AGIs $100k-200k)
Taxes paid: $11,272 (reported on 36.7% of returns)
12548:
$11,272
State:
$18,656
(% of AGI for various income ranges: 4.9% for AGIs $25k-50k, 7.5% for AGIs $50k-75k, 8.9% for AGIs $75k-100k, 9.2% for AGIs $100k-200k)
Earned income credit: $1,667 (reported on 11.4% of returns)
Here:
$1,667
State:
$2,230
(% of AGI for various income ranges: 2.7% for AGIs below $25k, 1.0% for AGIs $25k-50k)
Percentage of individuals using paid preparers for their 2012 taxes: 63.3%
Here:
63%
State:
66%
(% for various income ranges: 55.6% for AGIs below $25k, 61.1% for AGIs $25k-50k, 72.7% for AGIs $50k-75k, 70.0% for AGIs $75k-100k, 69.2% for AGIs $100k-200k)
Averages for the 2004 tax year for zip code 12548, filed in 2005:
Average Adjusted Gross Income (AGI) in 2004: $45,435 (Individual Income Tax Returns)
Here:
$45,435
State:
$59,519
Salary/wage: $44,355 (reported on 88.4% of returns)
Here:
$44,355
State:
$50,673
(% of AGI for various income ranges: 140.1% for AGIs below $10k, 79.3% for AGIs $10k-25k, 85.3% for AGIs $25k-50k, 86.7% for AGIs $50k-75k, 89.0% for AGIs $75k-100k, 84.7% for AGIs over 100k)
Taxable interest for individuals: $923 (reported on 50.6% of returns)
This zip code:
$923
New York:
$2,377
(% of AGI for various income ranges: 9.6% for AGIs below $10k, 2.4% for AGIs $10k-25k, 0.6% for AGIs $25k-50k, 0.3% for AGIs $50k-75k, 0.4% for AGIs $75k-100k, 1.6% for AGIs over 100k)
Taxable dividends: $1,128 (reported on 23.4% of returns)
Here:
$1,128
State:
$5,394
(% of AGI for various income ranges: 7.1% for AGIs below $10k, 2.1% for AGIs $10k-25k, 0.4% for AGIs $25k-50k, 0.2% for AGIs $50k-75k, 0.3% for AGIs $75k-100k, 0.5% for AGIs over 100k)
Profit/loss from business: +$6,404 (reported on 12.9% of returns)
Here:
+$6,404
State:
+$13,809
(% of AGI for various income ranges: 2.0% for AGIs below $10k, 2.2% for AGIs $10k-25k, 2.5% for AGIs $25k-50k, 1.0% for AGIs $50k-75k, 4.2% for AGIs $75k-100k)
IRA payment deduction: $2,733 (reported on 1.9% of returns)
12548:
$2,733
New York:
$3,115
Total itemized deductions: $19,483 (24% of AGI, reported on 37.9% of returns)
Here:
$19,483
State:
$25,864
Here:
24.0% of AGI
State:
21.9% of AGI
(% of AGI for various income ranges: 6.4% for AGIs $10k-25k, 11.4% for AGIs $25k-50k, 19.5% for AGIs $50k-75k, 19.1% for AGIs $75k-100k, 18.7% for AGIs over 100k)
Charity contributions deductions: $1,967 (2% of AGI, reported on 35.3% of returns)
Here:
$1,967
State:
$4,439
Here:
2.4% of AGI
State:
3.6% of AGI
(% of AGI for various income ranges: 0.5% for AGIs $10k-25k, 1.2% for AGIs $25k-50k, 2.0% for AGIs $50k-75k, 2.0% for AGIs $75k-100k, 1.4% for AGIs over 100k)
Total tax: $5,936 (reported on 77.5% of returns)
12548:
$5,936
State:
$11,730
(% of AGI for various income ranges: 3.8% for AGIs below $10k, 4.1% for AGIs $10k-25k, 7.4% for AGIs $25k-50k, 8.2% for AGIs $50k-75k, 10.3% for AGIs $75k-100k, 15.4% for AGIs over 100k)
Earned income credit: $1,622 (reported on 11.7% of returns)
Here:
$1,622
State:
$1,757
Percentage of individuals using paid preparers for their 2004 taxes: 67.8%
Here:
68%
State:
67%
(% for various income ranges: 62.1% for AGIs below $10k, 61.5% for AGIs $10k-25k, 71.0% for AGIs $25k-50k, 74.6% for AGIs $50k-75k, 73.6% for AGIs $75k-100k, 67.2% for AGIs over 100k)
Household received Food Stamps/SNAP in the past 12 months: 0 Household did not receive Food Stamps/SNAP in the past 12 months: 384
Women who had a birth in the past 12 months: 7 (7 now married, 0 unmarried) Women who did not have a birth in the past 12 months: 188 (61 now married, 128 unmarried)
Housing units in zip code 12548 with a mortgage: 136 (17 second mortgage, 17 both second mortgage and home equity loan) Median monthly owner costs for units with a mortgage: $2,181 Median monthly owner costs for units without a mortgage: $1,064
Residents with income below the poverty level in 2022:
This zip code:
8.6%
Whole state:
14.3%
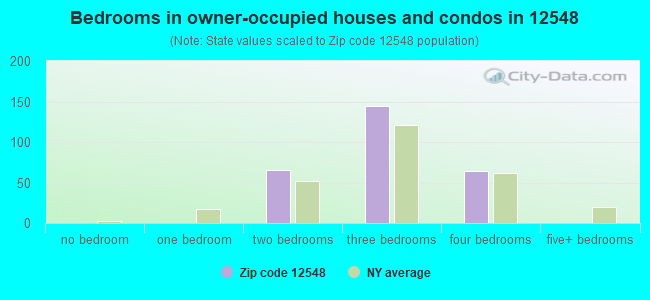
Median number of rooms in houses and condos:
Here:
7.0
State:
6.3
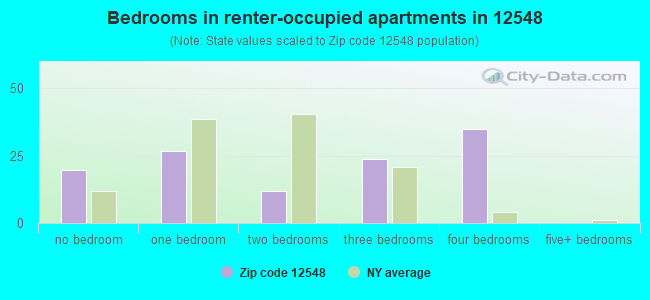
Median number of rooms in apartments:
Here:
4.6
State:
3.8
Notable locations in this zip code not listed on our city pages
Size of family households: 139 2-persons, 64 3-persons, 36 4-persons, 35 7-or-more-persons
Size of nonfamily households: 98 1-person, 17 2-persons
74 married couples with children.
0 single-parent households ().
97.0% of residents of 12548 zip code speak English at home.
2.7% of residents speak Spanish at home (100% very well).
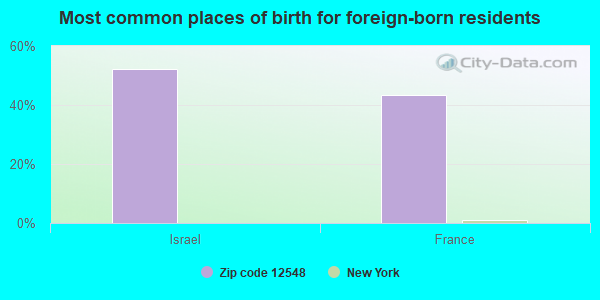
Foreign born population: 24 (2.3%) (100.0% of them are naturalized citizens)
This zip code:
2.3%
Whole state:
22.7%
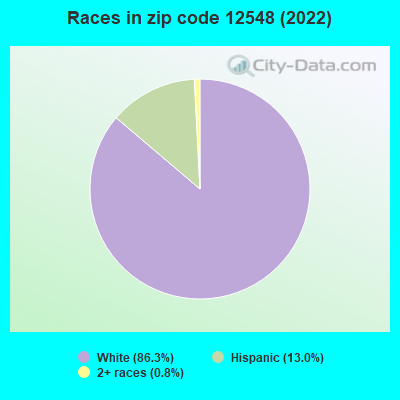
52%Israel
43%France
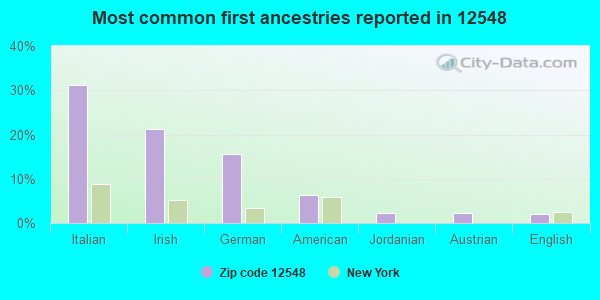
31%Italian
21%Irish
16%German
6%American
2%Jordanian
2%Austrian
2%English
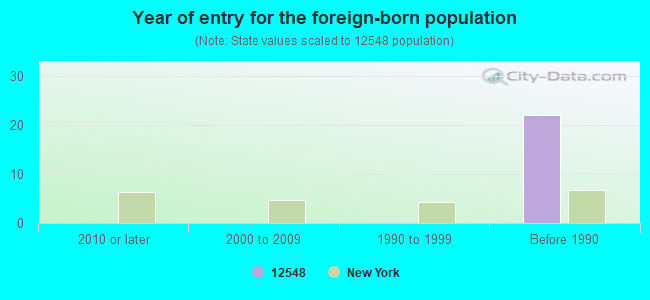
Year of entry for the foreign-born population
02010 or later
02000 to 2009
01990 to 1999
22Before 1990
Facilities with environmental interests located in this zip code:
IRELAND CORNERS COLLISION (2051 RTE 4455 in MODENA, NY)
Small Quantity Generators, between 100 kg and 1000 kg of hazardous waste/month (Resource Conservation and Recovery Act (tracking hazardous waste)) - notification Organizations: MICHAEL J EGGELTON (CONTACT/OWNER)
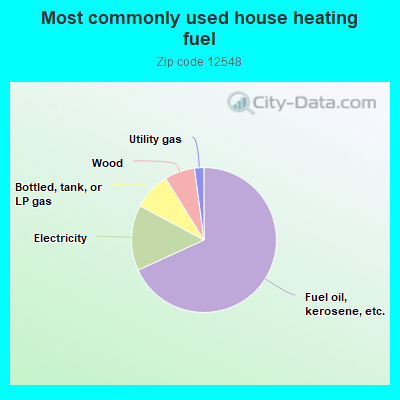
68.6%Fuel oil, kerosene, etc.
14.7%Electricity
8.4%Bottled, tank, or LP gas
6.8%Wood
2.1%Utility gas
Population in 1990: 810. Population change in the 1990s: +718 (+88.6%).
Place of birth for U.S.-born residents:
This state: 914
Northeast: 18
Midwest: 57
South: 22
West: 19
72% of the 12548 zip code residents lived in the same house 5 years ago. Out of people who lived in different houses, 47% lived in this county. Out of people who lived in different counties, 50% lived in New York.
90% of the 12548 zip code residents lived in the same house 1 year ago. Out of people who lived in different houses, 69% moved from this county. Out of people who lived in different houses, 28% moved from different county within same state.
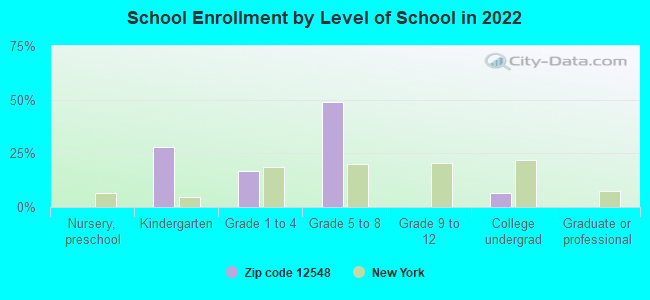
Private vs. public school enrollment:
Students in private schools in grades 1 to 8 (elementary and middle school):
Here:
0.0%
New York:
15.6%
Students in private undergraduate colleges:
Here:
0.0%
New York:
39.2%
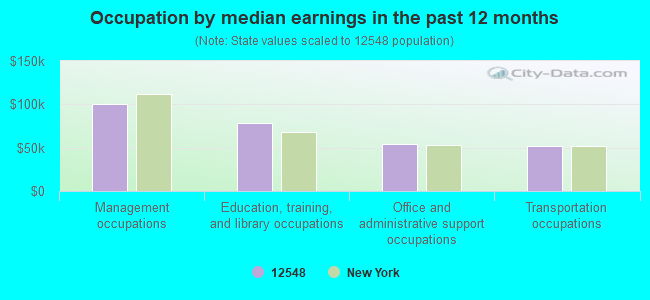
Occupation by median earnings in the past 12 months ($)
99,984Management occupations
78,583Education, training, and library occupations
54,439Office and administrative support occupations
52,405Transportation occupations
Companies with federal contracts located in this zip code:
STANLEY ORCHARDS INC (ORCHARD DR RR 32 in MODENA, NY; small business) 68 employees, $4300000 revenue.
$76,000 with Agricultural Marketing Service (disused code) for Dairy Foods and Eggs. Taking place in PA. Signed on 1999-12-15. Completion date: 2000-03-15.
Top industries in this zip code by the number of employees in 2005:
Administrative and Support and Waste Management and Remediation Services: Landscaping Services (10-19 employees: 1 establishment, 1-4 employees: 1 establishment)
Health Care and Social Assistance: Offices of Physicians (except Mental Health Specialists) (10-19: 1, 1-4: 1)
Professional, Scientific, and Technical Services: Computer Systems Design Services (10-19: 1)
Health Care and Social Assistance: Homes for the Elderly (10-19: 1)
Wholesale Trade: Fresh Fruit and Vegetable Merchant Wholesalers (10-19: 1)
Accommodation and Food Services: Limited-Service Restaurants (5-9: 1, 1-4: 1)
Information: Libraries and Archives (5-9: 1)
Construction: Drywall and Insulation Contractors (5-9: 1)
People in group quarters in 2010:
18 people in nursing facilities/skilled-nursing facilities
People in group quarters in 2000:
27 people in nursing homes
2 people in agriculture workers' dormitories on farms
Fatal accident statistics in 2012:
Fatal accident count: 1
Vehicles involved in fatal accidents: 2
Fatal accidents caused by drunken drivers: 1
Fatalities: 1
Persons involved in fatal accidents: 2
Pedestrians involved in fatal accidents: 0
Home Mortgage Disclosure Act Aggregated Statistics For Year 2009 (Based on 4 partial tracts)
A) FHA, FSA/RHS & VA Home Purchase Loans
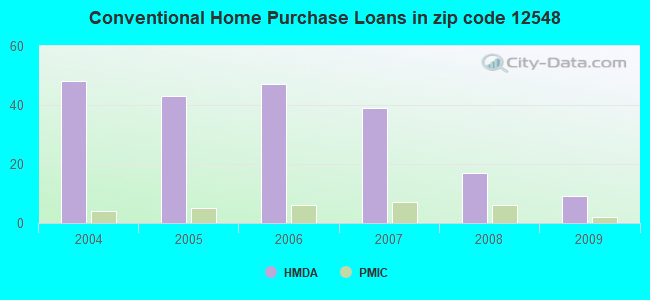
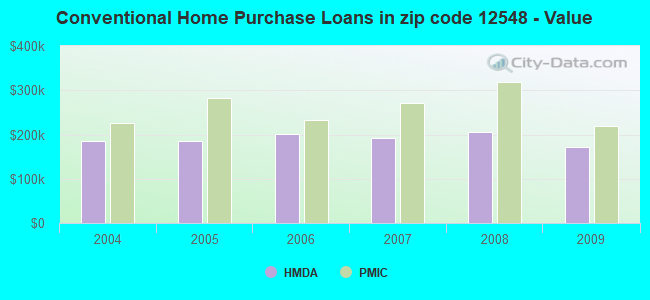
B) Conventional Home Purchase Loans
C) Refinancings
D) Home Improvement Loans
F) Non-occupant Loans on < 5 Family Dwellings (A B C & D)
G) Loans On Manufactured Home Dwelling (A B C & D)
Number
Average Value
Number
Average Value
Number
Average Value
Number
Average Value
Number
Average Value
Number
Average Value
LOANS ORIGINATED
7
$202,140
9
$171,227
44
$172,902
5
$54,356
1
$152,680
3
$35,050
APPLICATIONS APPROVED, NOT ACCEPTED
2
$216,630
1
$240,400
7
$216,210
0
$0
0
$0
0
$0
APPLICATIONS DENIED
4
$218,945
6
$131,990
15
$223,345
4
$57,402
1
$54,560
2
$68,625
APPLICATIONS WITHDRAWN
0
$0
2
$227,840
17
$219,559
0
$0
3
$127,257
0
$0
FILES CLOSED FOR INCOMPLETENESS
0
$0
1
$107,790
4
$237,212
0
$0
0
$0
1
$80,910
Aggregated Statistics For Year 2008 (Based on 4 partial tracts)
A) FHA, FSA/RHS & VA Home Purchase Loans
B) Conventional Home Purchase Loans
C) Refinancings
D) Home Improvement Loans
F) Non-occupant Loans on < 5 Family Dwellings (A B C & D)
G) Loans On Manufactured Home Dwelling (A B C & D)
Number
Average Value
Number
Average Value
Number
Average Value
Number
Average Value
Number
Average Value
Number
Average Value
LOANS ORIGINATED
2
$247,265
17
$206,657
33
$161,723
12
$60,277
2
$189,330
7
$72,624
APPLICATIONS APPROVED, NOT ACCEPTED
0
$0
3
$197,227
9
$173,840
1
$28,580
0
$0
2
$48,760
APPLICATIONS DENIED
2
$183,430
7
$102,304
34
$212,563
13
$81,929
2
$267,065
7
$60,771
APPLICATIONS WITHDRAWN
1
$209,030
3
$266,290
20
$226,476
1
$43,950
1
$219,410
0
$0
FILES CLOSED FOR INCOMPLETENESS
0
$0
0
$0
2
$234,385
0
$0
1
$130,500
0
$0
Aggregated Statistics For Year 2007 (Based on 4 partial tracts)
A) FHA, FSA/RHS & VA Home Purchase Loans
B) Conventional Home Purchase Loans
C) Refinancings
D) Home Improvement Loans
F) Non-occupant Loans on < 5 Family Dwellings (A B C & D)
G) Loans On Manufactured Home Dwelling (A B C & D)
Number
Average Value
Number
Average Value
Number
Average Value
Number
Average Value
Number
Average Value
Number
Average Value
LOANS ORIGINATED
1
$219,830
39
$191,726
55
$197,384
10
$87,972
8
$207,109
8
$54,510
APPLICATIONS APPROVED, NOT ACCEPTED
0
$0
6
$195,872
17
$174,278
4
$70,328
1
$225,430
4
$65,202
APPLICATIONS DENIED
0
$0
7
$268,013
56
$241,567
9
$73,513
5
$282,436
2
$89,600
APPLICATIONS WITHDRAWN
0
$0
4
$214,835
24
$192,217
2
$180,895
1
$185,680
1
$126,620
FILES CLOSED FOR INCOMPLETENESS
0
$0
1
$138,820
9
$242,221
1
$184,490
1
$135,960
1
$78,300
Aggregated Statistics For Year 2006 (Based on 4 partial tracts)
A) FHA, FSA/RHS & VA Home Purchase Loans
B) Conventional Home Purchase Loans
C) Refinancings
D) Home Improvement Loans
F) Non-occupant Loans on < 5 Family Dwellings (A B C & D)
G) Loans On Manufactured Home Dwelling (A B C & D)
Number
Average Value
Number
Average Value
Number
Average Value
Number
Average Value
Number
Average Value
Number
Average Value
LOANS ORIGINATED
2
$149,315
47
$200,311
72
$173,692
14
$94,050
6
$212,443
5
$50,824
APPLICATIONS APPROVED, NOT ACCEPTED
1
$122,670
7
$116,946
14
$174,069
2
$91,195
2
$165,375
1
$88,240
APPLICATIONS DENIED
0
$0
19
$181,404
68
$210,617
22
$63,340
4
$157,842
5
$64,038
APPLICATIONS WITHDRAWN
1
$127,520
6
$231,038
34
$204,387
4
$89,140
2
$234,815
2
$134,555
FILES CLOSED FOR INCOMPLETENESS
0
$0
2
$201,725
13
$212,017
1
$99,180
1
$86,560
1
$46,790
Aggregated Statistics For Year 2005 (Based on 4 partial tracts)
A) FHA, FSA/RHS & VA Home Purchase Loans
B) Conventional Home Purchase Loans
C) Refinancings
D) Home Improvement Loans
E) Loans on Dwellings For 5+ Families
F) Non-occupant Loans on < 5 Family Dwellings (A B C & D)
G) Loans On Manufactured Home Dwelling (A B C & D)
Number
Average Value
Number
Average Value
Number
Average Value
Number
Average Value
Number
Average Value
Number
Average Value
Number
Average Value
LOANS ORIGINATED
0
$0
43
$184,859
90
$173,847
23
$78,972
1
$222,600
9
$184,232
8
$67,594
APPLICATIONS APPROVED, NOT ACCEPTED
0
$0
6
$138,635
17
$158,269
3
$69,883
0
$0
1
$119,490
5
$55,912
APPLICATIONS DENIED
0
$0
11
$152,495
61
$183,593
22
$61,153
0
$0
4
$209,952
7
$44,783
APPLICATIONS WITHDRAWN
1
$80,390
7
$220,171
52
$185,247
9
$182,729
0
$0
3
$194,060
1
$168,890
FILES CLOSED FOR INCOMPLETENESS
0
$0
5
$146,504
20
$201,151
1
$148,770
0
$0
1
$268,480
1
$62,320
Aggregated Statistics For Year 2004 (Based on 4 partial tracts)
B) Conventional Home Purchase Loans
C) Refinancings
D) Home Improvement Loans
E) Loans on Dwellings For 5+ Families
F) Non-occupant Loans on < 5 Family Dwellings (A B C & D)
G) Loans On Manufactured Home Dwelling (A B C & D)

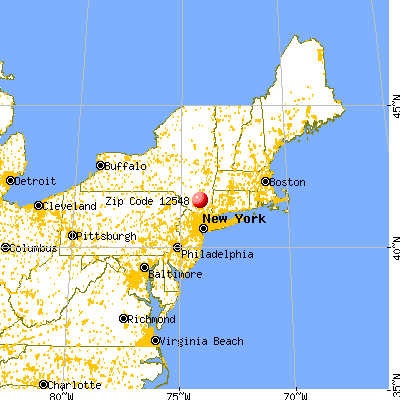


 Nearest zip codes: 12515, 12589, 12525, 12542, 12561, 12528.