Estimated zip code population in 2022: 4,500
Zip code population in 2010: 4,842
Zip code population in 2000: 4,801
Houses and condos: 3,525
Renter-occupied apartments: 462
% of renters here:
23%State:
46%
March 2022 cost of living index in zip code 12845: 96.7
(near average, U.S. average is 100)
Land area: 44.3
sq. mi.
Water area: 0.3
sq. mi.
Population density: 102 people per square mile (very low).
OSM Map
General Map
Google Map
MSN Map
OSM Map
General Map
Google Map
MSN Map
OSM Map
General Map
Google Map
MSN Map
OSM Map
General Map
Google Map
MSN Map
Please wait while loading the map...
Real estate property taxes paid for housing units in 2022:
This zip code:
1.0% ($3,573)New York:
1.5% ($6,180)
Median real estate property taxes paid for housing units with mortgages in 2022: $3,483 (1.0%)
Median real estate property taxes paid for housing units with no mortgage in 2022: $3,829 (1.1%)
Profiles of local businesses
Business Search - 14 Million verified businesses
Males: 2,227 Females: 2,272
For population 25 years and over in 12845:
High school or higher: 94.1%Bachelor's degree or higher: 36.8%Graduate or professional degree: 16.0%Unemployed: 1.5%Mean travel time to work (commute): 22.7 minutes
For population 15 years and over in 12845:
Never married: 25.7%Now married: 55.2%Separated: 0.7%Widowed: 6.8%Divorced: 11.5%
Zip code 12845 compared to state average:
Unemployed percentage significantly below state average. Black race population percentage significantly below state average. Hispanic race population percentage significantly below state average. Median age significantly above state average. Foreign-born population percentage significantly below state average. Renting percentage below state average. Length of stay since moving in significantly above state average. House age below state average. 4,107 91.3% White 207 4.6% Hispanic or Latino 98 2.2% Two or more races 54 1.2% Black 26 0.6% Asian 5 0.1% American Indian
Data:
Median household income ($)
Median household income (% change since 2000)
Household income diversity
Ratio of average income to average house value (%)
Ratio of average income to average rent
Median household income ($) - White
Median household income ($) - Black or African American
Median household income ($) - Asian
Median household income ($) - Hispanic or Latino
Median household income ($) - American Indian and Alaska Native
Median household income ($) - Multirace
Median household income ($) - Other Race
Median household income for houses/condos with a mortgage ($)
Median household income for apartments without a mortgage ($)
Races - White alone (%)
Races - White alone (% change since 2000)
Races - Black alone (%)
Races - Black alone (% change since 2000)
Races - American Indian alone (%)
Races - American Indian alone (% change since 2000)
Races - Asian alone (%)
Races - Asian alone (% change since 2000)
Races - Hispanic (%)
Races - Hispanic (% change since 2000)
Races - Native Hawaiian and Other Pacific Islander alone (%)
Races - Native Hawaiian and Other Pacific Islander alone (% change since 2000)
Races - Two or more races (%)
Races - Two or more races (% change since 2000)
Races - Other race alone (%)
Races - Other race alone (% change since 2000)
Racial diversity
Unemployment (%)
Unemployment (% change since 2000)
Unemployment (%) - White
Unemployment (%) - Black or African American
Unemployment (%) - Asian
Unemployment (%) - Hispanic or Latino
Unemployment (%) - American Indian and Alaska Native
Unemployment (%) - Multirace
Unemployment (%) - Other Race
Population density (people per square mile)
Population - Males (%)
Population - Females (%)
Population - Males (%) - White
Population - Males (%) - Black or African American
Population - Males (%) - Asian
Population - Males (%) - Hispanic or Latino
Population - Males (%) - American Indian and Alaska Native
Population - Males (%) - Multirace
Population - Males (%) - Other Race
Population - Females (%) - White
Population - Females (%) - Black or African American
Population - Females (%) - Asian
Population - Females (%) - Hispanic or Latino
Population - Females (%) - American Indian and Alaska Native
Population - Females (%) - Multirace
Population - Females (%) - Other Race
Coronavirus confirmed cases (May 12, 2024)
Deaths caused by coronavirus (May 12, 2024)
Coronavirus confirmed cases (per 100k population) (May 12, 2024)
Deaths caused by coronavirus (per 100k population) (May 12, 2024)
Daily increase in number of cases (May 12, 2024)
Weekly increase in number of cases (May 12, 2024)
Cases doubled (in days) (May 12, 2024)
Hospitalized patients (Apr 18, 2022)
Negative test results (Apr 18, 2022)
Total test results (Apr 18, 2022)
COVID Vaccine doses distributed (per 100k population) (Sep 19, 2023)
COVID Vaccine doses administered (per 100k population) (Sep 19, 2023)
COVID Vaccine doses distributed (Sep 19, 2023)
COVID Vaccine doses administered (Sep 19, 2023)
Likely homosexual households (%)
Likely homosexual households (% change since 2000)
Likely homosexual households - Lesbian couples (%)
Likely homosexual households - Lesbian couples (% change since 2000)
Likely homosexual households - Gay men (%)
Likely homosexual households - Gay men (% change since 2000)
Cost of living index
Median gross rent ($)
Median contract rent ($)
Median monthly housing costs ($)
Median house or condo value ($)
Median house or condo value ($ change since 2000)
Mean house or condo value by units in structure - 1, detached ($)
Mean house or condo value by units in structure - 1, attached ($)
Mean house or condo value by units in structure - 2 ($)
Mean house or condo value by units in structure by units in structure - 3 or 4 ($)
Mean house or condo value by units in structure - 5 or more ($)
Mean house or condo value by units in structure - Boat, RV, van, etc. ($)
Mean house or condo value by units in structure - Mobile home ($)
Median house or condo value ($) - White
Median house or condo value ($) - Black or African American
Median house or condo value ($) - Asian
Median house or condo value ($) - Hispanic or Latino
Median house or condo value ($) - American Indian and Alaska Native
Median house or condo value ($) - Multirace
Median house or condo value ($) - Other Race
Median resident age
Resident age diversity
Median resident age - Males
Median resident age - Females
Median resident age - White
Median resident age - Black or African American
Median resident age - Asian
Median resident age - Hispanic or Latino
Median resident age - American Indian and Alaska Native
Median resident age - Multirace
Median resident age - Other Race
Median resident age - Males - White
Median resident age - Males - Black or African American
Median resident age - Males - Asian
Median resident age - Males - Hispanic or Latino
Median resident age - Males - American Indian and Alaska Native
Median resident age - Males - Multirace
Median resident age - Males - Other Race
Median resident age - Females - White
Median resident age - Females - Black or African American
Median resident age - Females - Asian
Median resident age - Females - Hispanic or Latino
Median resident age - Females - American Indian and Alaska Native
Median resident age - Females - Multirace
Median resident age - Females - Other Race
Commute - mean travel time to work (minutes)
Travel time to work - Less than 5 minutes (%)
Travel time to work - Less than 5 minutes (% change since 2000)
Travel time to work - 5 to 9 minutes (%)
Travel time to work - 5 to 9 minutes (% change since 2000)
Travel time to work - 10 to 19 minutes (%)
Travel time to work - 10 to 19 minutes (% change since 2000)
Travel time to work - 20 to 29 minutes (%)
Travel time to work - 20 to 29 minutes (% change since 2000)
Travel time to work - 30 to 39 minutes (%)
Travel time to work - 30 to 39 minutes (% change since 2000)
Travel time to work - 40 to 59 minutes (%)
Travel time to work - 40 to 59 minutes (% change since 2000)
Travel time to work - 60 to 89 minutes (%)
Travel time to work - 60 to 89 minutes (% change since 2000)
Travel time to work - 90 or more minutes (%)
Travel time to work - 90 or more minutes (% change since 2000)
Marital status - Never married (%)
Marital status - Now married (%)
Marital status - Separated (%)
Marital status - Widowed (%)
Marital status - Divorced (%)
Median family income ($)
Median family income (% change since 2000)
Median non-family income ($)
Median non-family income (% change since 2000)
Median per capita income ($)
Median per capita income (% change since 2000)
Median family income ($) - White
Median family income ($) - Black or African American
Median family income ($) - Asian
Median family income ($) - Hispanic or Latino
Median family income ($) - American Indian and Alaska Native
Median family income ($) - Multirace
Median family income ($) - Other Race
Median year house/condo built
Median year apartment built
Year house built - Built 2005 or later (%)
Year house built - Built 2000 to 2004 (%)
Year house built - Built 1990 to 1999 (%)
Year house built - Built 1980 to 1989 (%)
Year house built - Built 1970 to 1979 (%)
Year house built - Built 1960 to 1969 (%)
Year house built - Built 1950 to 1959 (%)
Year house built - Built 1940 to 1949 (%)
Year house built - Built 1939 or earlier (%)
Average household size
Household density (households per square mile)
Average household size - White
Average household size - Black or African American
Average household size - Asian
Average household size - Hispanic or Latino
Average household size - American Indian and Alaska Native
Average household size - Multirace
Average household size - Other Race
Occupied housing units (%)
Vacant housing units (%)
Owner occupied housing units (%)
Renter occupied housing units (%)
Vacancy status - For rent (%)
Vacancy status - For sale only (%)
Vacancy status - Rented or sold, not occupied (%)
Vacancy status - For seasonal, recreational, or occasional use (%)
Vacancy status - For migrant workers (%)
Vacancy status - Other vacant (%)
Residents with income below the poverty level (%)
Residents with income below 50% of the poverty level (%)
Children below poverty level (%)
Poor families by family type - Married-couple family (%)
Poor families by family type - Male, no wife present (%)
Poor families by family type - Female, no husband present (%)
Poverty status for native-born residents (%)
Poverty status for foreign-born residents (%)
Poverty among high school graduates not in families (%)
Poverty among people who did not graduate high school not in families (%)
Residents with income below the poverty level (%) - White
Residents with income below the poverty level (%) - Black or African American
Residents with income below the poverty level (%) - Asian
Residents with income below the poverty level (%) - Hispanic or Latino
Residents with income below the poverty level (%) - American Indian and Alaska Native
Residents with income below the poverty level (%) - Multirace
Residents with income below the poverty level (%) - Other Race
Air pollution - Air Quality Index (AQI)
Air pollution - CO
Air pollution - NO2
Air pollution - SO2
Air pollution - Ozone
Air pollution - PM10
Air pollution - PM25
Air pollution - Pb
Crime - Murders per 100,000 population
Crime - Rapes per 100,000 population
Crime - Robberies per 100,000 population
Crime - Assaults per 100,000 population
Crime - Burglaries per 100,000 population
Crime - Thefts per 100,000 population
Crime - Auto thefts per 100,000 population
Crime - Arson per 100,000 population
Crime - City-data.com crime index
Crime - Violent crime index
Crime - Property crime index
Crime - Murders per 100,000 population (5 year average)
Crime - Rapes per 100,000 population (5 year average)
Crime - Robberies per 100,000 population (5 year average)
Crime - Assaults per 100,000 population (5 year average)
Crime - Burglaries per 100,000 population (5 year average)
Crime - Thefts per 100,000 population (5 year average)
Crime - Auto thefts per 100,000 population (5 year average)
Crime - Arson per 100,000 population (5 year average)
Crime - City-data.com crime index (5 year average)
Crime - Violent crime index (5 year average)
Crime - Property crime index (5 year average)
1996 Presidential Elections Results (%) - Democratic Party (Clinton)
1996 Presidential Elections Results (%) - Republican Party (Dole)
1996 Presidential Elections Results (%) - Other
2000 Presidential Elections Results (%) - Democratic Party (Gore)
2000 Presidential Elections Results (%) - Republican Party (Bush)
2000 Presidential Elections Results (%) - Other
2004 Presidential Elections Results (%) - Democratic Party (Kerry)
2004 Presidential Elections Results (%) - Republican Party (Bush)
2004 Presidential Elections Results (%) - Other
2008 Presidential Elections Results (%) - Democratic Party (Obama)
2008 Presidential Elections Results (%) - Republican Party (McCain)
2008 Presidential Elections Results (%) - Other
2012 Presidential Elections Results (%) - Democratic Party (Obama)
2012 Presidential Elections Results (%) - Republican Party (Romney)
2012 Presidential Elections Results (%) - Other
2016 Presidential Elections Results (%) - Democratic Party (Clinton)
2016 Presidential Elections Results (%) - Republican Party (Trump)
2016 Presidential Elections Results (%) - Other
2020 Presidential Elections Results (%) - Democratic Party (Biden)
2020 Presidential Elections Results (%) - Republican Party (Trump)
2020 Presidential Elections Results (%) - Other
Ancestries Reported - Arab (%)
Ancestries Reported - Czech (%)
Ancestries Reported - Danish (%)
Ancestries Reported - Dutch (%)
Ancestries Reported - English (%)
Ancestries Reported - French (%)
Ancestries Reported - French Canadian (%)
Ancestries Reported - German (%)
Ancestries Reported - Greek (%)
Ancestries Reported - Hungarian (%)
Ancestries Reported - Irish (%)
Ancestries Reported - Italian (%)
Ancestries Reported - Lithuanian (%)
Ancestries Reported - Norwegian (%)
Ancestries Reported - Polish (%)
Ancestries Reported - Portuguese (%)
Ancestries Reported - Russian (%)
Ancestries Reported - Scotch-Irish (%)
Ancestries Reported - Scottish (%)
Ancestries Reported - Slovak (%)
Ancestries Reported - Subsaharan African (%)
Ancestries Reported - Swedish (%)
Ancestries Reported - Swiss (%)
Ancestries Reported - Ukrainian (%)
Ancestries Reported - United States (%)
Ancestries Reported - Welsh (%)
Ancestries Reported - West Indian (%)
Ancestries Reported - Other (%)
Educational Attainment - No schooling completed (%)
Educational Attainment - Less than high school (%)
Educational Attainment - High school or equivalent (%)
Educational Attainment - Less than 1 year of college (%)
Educational Attainment - 1 or more years of college (%)
Educational Attainment - Associate degree (%)
Educational Attainment - Bachelor's degree (%)
Educational Attainment - Master's degree (%)
Educational Attainment - Professional school degree (%)
Educational Attainment - Doctorate degree (%)
School Enrollment - Nursery, preschool (%)
School Enrollment - Kindergarten (%)
School Enrollment - Grade 1 to 4 (%)
School Enrollment - Grade 5 to 8 (%)
School Enrollment - Grade 9 to 12 (%)
School Enrollment - College undergrad (%)
School Enrollment - Graduate or professional (%)
School Enrollment - Not enrolled in school (%)
School enrollment - Public schools (%)
School enrollment - Private schools (%)
School enrollment - Not enrolled (%)
Median number of rooms in houses and condos
Median number of rooms in apartments
Housing units lacking complete plumbing facilities (%)
Housing units lacking complete kitchen facilities (%)
Density of houses
Urban houses (%)
Rural houses (%)
Households with people 60 years and over (%)
Households with people 65 years and over (%)
Households with people 75 years and over (%)
Households with one or more nonrelatives (%)
Households with no nonrelatives (%)
Population in households (%)
Family households (%)
Nonfamily households (%)
Population in families (%)
Family households with own children (%)
Median number of bedrooms in owner occupied houses
Mean number of bedrooms in owner occupied houses
Median number of bedrooms in renter occupied houses
Mean number of bedrooms in renter occupied houses
Median number of vehichles in owner occupied houses
Mean number of vehichles in owner occupied houses
Median number of vehichles in renter occupied houses
Mean number of vehichles in renter occupied houses
Mortgage status - with mortgage (%)
Mortgage status - with second mortgage (%)
Mortgage status - with home equity loan (%)
Mortgage status - with both second mortgage and home equity loan (%)
Mortgage status - without a mortgage (%)
Average family size
Average family size - White
Average family size - Black or African American
Average family size - Asian
Average family size - Hispanic or Latino
Average family size - American Indian and Alaska Native
Average family size - Multirace
Average family size - Other Race
Geographical mobility - Same house 1 year ago (%)
Geographical mobility - Moved within same county (%)
Geographical mobility - Moved from different county within same state (%)
Geographical mobility - Moved from different state (%)
Geographical mobility - Moved from abroad (%)
Place of birth - Born in state of residence (%)
Place of birth - Born in other state (%)
Place of birth - Native, outside of US (%)
Place of birth - Foreign born (%)
Housing units in structures - 1, detached (%)
Housing units in structures - 1, attached (%)
Housing units in structures - 2 (%)
Housing units in structures - 3 or 4 (%)
Housing units in structures - 5 to 9 (%)
Housing units in structures - 10 to 19 (%)
Housing units in structures - 20 to 49 (%)
Housing units in structures - 50 or more (%)
Housing units in structures - Mobile home (%)
Housing units in structures - Boat, RV, van, etc. (%)
House/condo owner moved in on average (years ago)
Renter moved in on average (years ago)
Year householder moved into unit - Moved in 1999 to March 2000 (%)
Year householder moved into unit - Moved in 1995 to 1998 (%)
Year householder moved into unit - Moved in 1990 to 1994 (%)
Year householder moved into unit - Moved in 1980 to 1989 (%)
Year householder moved into unit - Moved in 1970 to 1979 (%)
Year householder moved into unit - Moved in 1969 or earlier (%)
Means of transportation to work - Drove car alone (%)
Means of transportation to work - Carpooled (%)
Means of transportation to work - Public transportation (%)
Means of transportation to work - Bus or trolley bus (%)
Means of transportation to work - Streetcar or trolley car (%)
Means of transportation to work - Subway or elevated (%)
Means of transportation to work - Railroad (%)
Means of transportation to work - Ferryboat (%)
Means of transportation to work - Taxicab (%)
Means of transportation to work - Motorcycle (%)
Means of transportation to work - Bicycle (%)
Means of transportation to work - Walked (%)
Means of transportation to work - Other means (%)
Working at home (%)
Industry diversity
Most Common Industries - Agriculture, forestry, fishing and hunting, and mining (%)
Most Common Industries - Agriculture, forestry, fishing and hunting (%)
Most Common Industries - Mining, quarrying, and oil and gas extraction (%)
Most Common Industries - Construction (%)
Most Common Industries - Manufacturing (%)
Most Common Industries - Wholesale trade (%)
Most Common Industries - Retail trade (%)
Most Common Industries - Transportation and warehousing, and utilities (%)
Most Common Industries - Transportation and warehousing (%)
Most Common Industries - Utilities (%)
Most Common Industries - Information (%)
Most Common Industries - Finance and insurance, and real estate and rental and leasing (%)
Most Common Industries - Finance and insurance (%)
Most Common Industries - Real estate and rental and leasing (%)
Most Common Industries - Professional, scientific, and management, and administrative and waste management services (%)
Most Common Industries - Professional, scientific, and technical services (%)
Most Common Industries - Management of companies and enterprises (%)
Most Common Industries - Administrative and support and waste management services (%)
Most Common Industries - Educational services, and health care and social assistance (%)
Most Common Industries - Educational services (%)
Most Common Industries - Health care and social assistance (%)
Most Common Industries - Arts, entertainment, and recreation, and accommodation and food services (%)
Most Common Industries - Arts, entertainment, and recreation (%)
Most Common Industries - Accommodation and food services (%)
Most Common Industries - Other services, except public administration (%)
Most Common Industries - Public administration (%)
Occupation diversity
Most Common Occupations - Management, business, science, and arts occupations (%)
Most Common Occupations - Management, business, and financial occupations (%)
Most Common Occupations - Management occupations (%)
Most Common Occupations - Business and financial operations occupations (%)
Most Common Occupations - Computer, engineering, and science occupations (%)
Most Common Occupations - Computer and mathematical occupations (%)
Most Common Occupations - Architecture and engineering occupations (%)
Most Common Occupations - Life, physical, and social science occupations (%)
Most Common Occupations - Education, legal, community service, arts, and media occupations (%)
Most Common Occupations - Community and social service occupations (%)
Most Common Occupations - Legal occupations (%)
Most Common Occupations - Education, training, and library occupations (%)
Most Common Occupations - Arts, design, entertainment, sports, and media occupations (%)
Most Common Occupations - Healthcare practitioners and technical occupations (%)
Most Common Occupations - Health diagnosing and treating practitioners and other technical occupations (%)
Most Common Occupations - Health technologists and technicians (%)
Most Common Occupations - Service occupations (%)
Most Common Occupations - Healthcare support occupations (%)
Most Common Occupations - Protective service occupations (%)
Most Common Occupations - Fire fighting and prevention, and other protective service workers including supervisors (%)
Most Common Occupations - Law enforcement workers including supervisors (%)
Most Common Occupations - Food preparation and serving related occupations (%)
Most Common Occupations - Building and grounds cleaning and maintenance occupations (%)
Most Common Occupations - Personal care and service occupations (%)
Most Common Occupations - Sales and office occupations (%)
Most Common Occupations - Sales and related occupations (%)
Most Common Occupations - Office and administrative support occupations (%)
Most Common Occupations - Natural resources, construction, and maintenance occupations (%)
Most Common Occupations - Farming, fishing, and forestry occupations (%)
Most Common Occupations - Construction and extraction occupations (%)
Most Common Occupations - Installation, maintenance, and repair occupations (%)
Most Common Occupations - Production, transportation, and material moving occupations (%)
Most Common Occupations - Production occupations (%)
Most Common Occupations - Transportation occupations (%)
Most Common Occupations - Material moving occupations (%)
People in Group quarters - Institutionalized population (%)
People in Group quarters - Correctional institutions (%)
People in Group quarters - Federal prisons and detention centers (%)
People in Group quarters - Halfway houses (%)
People in Group quarters - Local jails and other confinement facilities (including police lockups) (%)
People in Group quarters - Military disciplinary barracks (%)
People in Group quarters - State prisons (%)
People in Group quarters - Other types of correctional institutions (%)
People in Group quarters - Nursing homes (%)
People in Group quarters - Hospitals/wards, hospices, and schools for the handicapped (%)
People in Group quarters - Hospitals/wards and hospices for chronically ill (%)
People in Group quarters - Hospices or homes for chronically ill (%)
People in Group quarters - Military hospitals or wards for chronically ill (%)
People in Group quarters - Other hospitals or wards for chronically ill (%)
People in Group quarters - Hospitals or wards for drug/alcohol abuse (%)
People in Group quarters - Mental (Psychiatric) hospitals or wards (%)
People in Group quarters - Schools, hospitals, or wards for the mentally retarded (%)
People in Group quarters - Schools, hospitals, or wards for the physically handicapped (%)
People in Group quarters - Institutions for the deaf (%)
People in Group quarters - Institutions for the blind (%)
People in Group quarters - Orthopedic wards and institutions for the physically handicapped (%)
People in Group quarters - Wards in general hospitals for patients who have no usual home elsewhere (%)
People in Group quarters - Wards in military hospitals for patients who have no usual home elsewhere (%)
People in Group quarters - Juvenile institutions (%)
People in Group quarters - Long-term care (%)
People in Group quarters - Homes for abused, dependent, and neglected children (%)
People in Group quarters - Residential treatment centers for emotionally disturbed children (%)
People in Group quarters - Training schools for juvenile delinquents (%)
People in Group quarters - Short-term care, detention or diagnostic centers for delinquent children (%)
People in Group quarters - Type of juvenile institution unknown (%)
People in Group quarters - Noninstitutionalized population (%)
People in Group quarters - College dormitories (includes college quarters off campus) (%)
People in Group quarters - Military quarters (%)
People in Group quarters - On base (%)
People in Group quarters - Barracks, unaccompanied personnel housing (UPH), (Enlisted/Officer), ;and similar group living quarters for military personnel (%)
People in Group quarters - Transient quarters for temporary residents (%)
People in Group quarters - Military ships (%)
People in Group quarters - Group homes (%)
People in Group quarters - Homes or halfway houses for drug/alcohol abuse (%)
People in Group quarters - Homes for the mentally ill (%)
People in Group quarters - Homes for the mentally retarded (%)
People in Group quarters - Homes for the physically handicapped (%)
People in Group quarters - Other group homes (%)
People in Group quarters - Religious group quarters (%)
People in Group quarters - Dormitories (%)
People in Group quarters - Agriculture workers' dormitories on farms (%)
People in Group quarters - Job Corps and vocational training facilities (%)
People in Group quarters - Other workers' dormitories (%)
People in Group quarters - Crews of maritime vessels (%)
People in Group quarters - Other nonhousehold living situations (%)
People in Group quarters - Other noninstitutional group quarters (%)
Residents speaking English at home (%)
Residents speaking English at home - Born in the United States (%)
Residents speaking English at home - Native, born elsewhere (%)
Residents speaking English at home - Foreign born (%)
Residents speaking Spanish at home (%)
Residents speaking Spanish at home - Born in the United States (%)
Residents speaking Spanish at home - Native, born elsewhere (%)
Residents speaking Spanish at home - Foreign born (%)
Residents speaking other language at home (%)
Residents speaking other language at home - Born in the United States (%)
Residents speaking other language at home - Native, born elsewhere (%)
Residents speaking other language at home - Foreign born (%)
Class of Workers - Employee of private company (%)
Class of Workers - Self-employed in own incorporated business (%)
Class of Workers - Private not-for-profit wage and salary workers (%)
Class of Workers - Local government workers (%)
Class of Workers - State government workers (%)
Class of Workers - Federal government workers (%)
Class of Workers - Self-employed workers in own not incorporated business and Unpaid family workers (%)
House heating fuel used in houses and condos - Utility gas (%)
House heating fuel used in houses and condos - Bottled, tank, or LP gas (%)
House heating fuel used in houses and condos - Electricity (%)
House heating fuel used in houses and condos - Fuel oil, kerosene, etc. (%)
House heating fuel used in houses and condos - Coal or coke (%)
House heating fuel used in houses and condos - Wood (%)
House heating fuel used in houses and condos - Solar energy (%)
House heating fuel used in houses and condos - Other fuel (%)
House heating fuel used in houses and condos - No fuel used (%)
House heating fuel used in apartments - Utility gas (%)
House heating fuel used in apartments - Bottled, tank, or LP gas (%)
House heating fuel used in apartments - Electricity (%)
House heating fuel used in apartments - Fuel oil, kerosene, etc. (%)
House heating fuel used in apartments - Coal or coke (%)
House heating fuel used in apartments - Wood (%)
House heating fuel used in apartments - Solar energy (%)
House heating fuel used in apartments - Other fuel (%)
House heating fuel used in apartments - No fuel used (%)
Armed forces status - In Armed Forces (%)
Armed forces status - Civilian (%)
Armed forces status - Civilian - Veteran (%)
Armed forces status - Civilian - Nonveteran (%)
Fatal accidents locations in years 2005-2021
Fatal accidents locations in 2005
Fatal accidents locations in 2006
Fatal accidents locations in 2007
Fatal accidents locations in 2008
Fatal accidents locations in 2009
Fatal accidents locations in 2010
Fatal accidents locations in 2011
Fatal accidents locations in 2012
Fatal accidents locations in 2013
Fatal accidents locations in 2014
Fatal accidents locations in 2015
Fatal accidents locations in 2016
Fatal accidents locations in 2017
Fatal accidents locations in 2018
Fatal accidents locations in 2019
Fatal accidents locations in 2020
Fatal accidents locations in 2021
Alcohol use - People drinking some alcohol every month (%)
Alcohol use - People not drinking at all (%)
Alcohol use - Average days/month drinking alcohol
Alcohol use - Average drinks/week
Alcohol use - Average days/year people drink much
Audiometry - Average condition of hearing (%)
Audiometry - People that can hear a whisper from across a quiet room (%)
Audiometry - People that can hear normal voice from across a quiet room (%)
Audiometry - Ears ringing, roaring, buzzing (%)
Audiometry - Had a job exposure to loud noise (%)
Audiometry - Had off-work exposure to loud noise (%)
Blood Pressure & Cholesterol - Has high blood pressure (%)
Blood Pressure & Cholesterol - Checking blood pressure at home (%)
Blood Pressure & Cholesterol - Frequently checking blood cholesterol (%)
Blood Pressure & Cholesterol - Has high cholesterol level (%)
Consumer Behavior - Money monthly spent on food at supermarket/grocery store
Consumer Behavior - Money monthly spent on food at other stores
Consumer Behavior - Money monthly spent on eating out
Consumer Behavior - Money monthly spent on carryout/delivered foods
Consumer Behavior - Income spent on food at supermarket/grocery store (%)
Consumer Behavior - Income spent on food at other stores (%)
Consumer Behavior - Income spent on eating out (%)
Consumer Behavior - Income spent on carryout/delivered foods (%)
Current Health Status - General health condition (%)
Current Health Status - Blood donors (%)
Current Health Status - Has blood ever tested for HIV virus (%)
Current Health Status - Left-handed people (%)
Dermatology - People using sunscreen (%)
Diabetes - Diabetics (%)
Diabetes - Had a blood test for high blood sugar (%)
Diabetes - People taking insulin (%)
Diet Behavior & Nutrition - Diet health (%)
Diet Behavior & Nutrition - Milk product consumption (# of products/month)
Diet Behavior & Nutrition - Meals not home prepared (#/week)
Diet Behavior & Nutrition - Meals from fast food or pizza place (#/week)
Diet Behavior & Nutrition - Ready-to-eat foods (#/month)
Diet Behavior & Nutrition - Frozen meals/pizza (#/month)
Drug Use - People that ever used marijuana or hashish (%)
Drug Use - Ever used hard drugs (%)
Drug Use - Ever used any form of cocaine (%)
Drug Use - Ever used heroin (%)
Drug Use - Ever used methamphetamine (%)
Health Insurance - People covered by health insurance (%)
Kidney Conditions-Urology - Avg. # of times urinating at night
Medical Conditions - People with asthma (%)
Medical Conditions - People with anemia (%)
Medical Conditions - People with psoriasis (%)
Medical Conditions - People with overweight (%)
Medical Conditions - Elderly people having difficulties in thinking or remembering (%)
Medical Conditions - People who ever received blood transfusion (%)
Medical Conditions - People having trouble seeing even with glass/contacts (%)
Medical Conditions - People with arthritis (%)
Medical Conditions - People with gout (%)
Medical Conditions - People with congestive heart failure (%)
Medical Conditions - People with coronary heart disease (%)
Medical Conditions - People with angina pectoris (%)
Medical Conditions - People who ever had heart attack (%)
Medical Conditions - People who ever had stroke (%)
Medical Conditions - People with emphysema (%)
Medical Conditions - People with thyroid problem (%)
Medical Conditions - People with chronic bronchitis (%)
Medical Conditions - People with any liver condition (%)
Medical Conditions - People who ever had cancer or malignancy (%)
Mental Health - People who have little interest in doing things (%)
Mental Health - People feeling down, depressed, or hopeless (%)
Mental Health - People who have trouble sleeping or sleeping too much (%)
Mental Health - People feeling tired or having little energy (%)
Mental Health - People with poor appetite or overeating (%)
Mental Health - People feeling bad about themself (%)
Mental Health - People who have trouble concentrating on things (%)
Mental Health - People moving or speaking slowly or too fast (%)
Mental Health - People having thoughts they would be better off dead (%)
Oral Health - Average years since last visit a dentist
Oral Health - People embarrassed because of mouth (%)
Oral Health - People with gum disease (%)
Oral Health - General health of teeth and gums (%)
Oral Health - Average days a week using dental floss/device
Oral Health - Average days a week using mouthwash for dental problem
Oral Health - Average number of teeth
Pesticide Use - Households using pesticides to control insects (%)
Pesticide Use - Households using pesticides to kill weeds (%)
Physical Activity - People doing vigorous-intensity work activities (%)
Physical Activity - People doing moderate-intensity work activities (%)
Physical Activity - People walking or bicycling (%)
Physical Activity - People doing vigorous-intensity recreational activities (%)
Physical Activity - People doing moderate-intensity recreational activities (%)
Physical Activity - Average hours a day doing sedentary activities
Physical Activity - Average hours a day watching TV or videos
Physical Activity - Average hours a day using computer
Physical Functioning - People having limitations keeping them from working (%)
Physical Functioning - People limited in amount of work they can do (%)
Physical Functioning - People that need special equipment to walk (%)
Physical Functioning - People experiencing confusion/memory problems (%)
Physical Functioning - People requiring special healthcare equipment (%)
Prescription Medications - Average number of prescription medicines taking
Preventive Aspirin Use - Adults 40+ taking low-dose aspirin (%)
Reproductive Health - Vaginal deliveries (%)
Reproductive Health - Cesarean deliveries (%)
Reproductive Health - Deliveries resulted in a live birth (%)
Reproductive Health - Pregnancies resulted in a delivery (%)
Reproductive Health - Women breastfeeding newborns (%)
Reproductive Health - Women that had a hysterectomy (%)
Reproductive Health - Women that had both ovaries removed (%)
Reproductive Health - Women that have ever taken birth control pills (%)
Reproductive Health - Women taking birth control pills (%)
Reproductive Health - Women that have ever used Depo-Provera or injectables (%)
Reproductive Health - Women that have ever used female hormones (%)
Sexual Behavior - People 18+ that ever had sex (vaginal, anal, or oral) (%)
Sexual Behavior - Males 18+ that ever had vaginal sex with a woman (%)
Sexual Behavior - Males 18+ that ever performed oral sex on a woman (%)
Sexual Behavior - Males 18+ that ever had anal sex with a woman (%)
Sexual Behavior - Males 18+ that ever had any sex with a man (%)
Sexual Behavior - Females 18+ that ever had vaginal sex with a man (%)
Sexual Behavior - Females 18+ that ever performed oral sex on a man (%)
Sexual Behavior - Females 18+ that ever had anal sex with a man (%)
Sexual Behavior - Females 18+ that ever had any kind of sex with a woman (%)
Sexual Behavior - Average age people first had sex
Sexual Behavior - Average number of female sex partners in lifetime (males 18+)
Sexual Behavior - Average number of female vaginal sex partners in lifetime (males 18+)
Sexual Behavior - Average age people first performed oral sex on a woman (18+)
Sexual Behavior - Average number of woman performed oral sex on in lifetime (18+)
Sexual Behavior - Average number of male sex partners in lifetime (males 18+)
Sexual Behavior - Average number of male anal sex partners in lifetime (males 18+)
Sexual Behavior - Average age people first performed oral sex on a man (18+)
Sexual Behavior - Average number of male oral sex partners in lifetime (18+)
Sexual Behavior - People using protection when performing oral sex (%)
Sexual Behavior - Average number of times people have vaginal or anal sex a year
Sexual Behavior - People having sex without condom (%)
Sexual Behavior - Average number of male sex partners in lifetime (females 18+)
Sexual Behavior - Average number of male vaginal sex partners in lifetime (females 18+)
Sexual Behavior - Average number of female sex partners in lifetime (females 18+)
Sexual Behavior - Circumcised males 18+ (%)
Sleep Disorders - Average hours sleeping at night
Sleep Disorders - People that has trouble sleeping (%)
Smoking-Cigarette Use - People smoking cigarettes (%)
Taste & Smell - People 40+ having problems with smell (%)
Taste & Smell - People 40+ having problems with taste (%)
Taste & Smell - People 40+ that ever had wisdom teeth removed (%)
Taste & Smell - People 40+ that ever had tonsils teeth removed (%)
Taste & Smell - People 40+ that ever had a loss of consciousness because of a head injury (%)
Taste & Smell - People 40+ that ever had a broken nose or other serious injury to face or skull (%)
Taste & Smell - People 40+ that ever had two or more sinus infections (%)
Weight - Average height (inches)
Weight - Average weight (pounds)
Weight - Average BMI
Weight - People that are obese (%)
Weight - People that ever were obese (%)
Weight - People trying to lose weight (%)
Urban population: 341
Rural population: 4,158
Estimated median house/condo value in 2022: $359,953
12845:
$359,953New York:
$400,400
Median resident age: This zip code:
51.7 yearsNew York median age:
40.0 years
Average household size: This zip code:
2.1 peopleNew York:
2.5 people
Averages for the 2020 tax year for zip code 12845, filed in 2021:
Average Adjusted Gross Income (AGI) in 2020: $90,453 (Individual Income Tax Returns) Here:
$90,453State:
$90,930
Salary/wage: $59,451 (reported on 77.6% of returns )Here:
$59,451State:
$72,104
(% of AGI for various income ranges: 1209.6% for AGIs below $25k , 3367.3% for AGIs $25k-50k , 5613.9% for AGIs $50k-75k , 9052.9% for AGIs $75k-100k , 14836.4% for AGIs $100k-200k , 83414.0% for AGIs over 200k ) Taxable interest for individuals: $2,657 (reported on 42.6% of returns )This zip code:
$2,657New York:
$3,075
(% of AGI for various income ranges: 21.9% for AGIs below $25k , 57.5% for AGIs $25k-50k , 89.6% for AGIs $50k-75k , 172.1% for AGIs $75k-100k , 268.6% for AGIs $100k-200k , 3134.0% for AGIs over 200k ) Ordinary dividends: $10,807 (reported on 28.9% of returns )Here:
$10,807State:
$11,095
(% of AGI for various income ranges: 42.4% for AGIs below $25k , 52.3% for AGIs $25k-50k , 218.3% for AGIs $50k-75k , 322.1% for AGIs $75k-100k , 744.1% for AGIs $100k-200k , 10328.0% for AGIs over 200k ) Net capital gain/loss in AGI: +$30,325 (reported on 25.5% of returns )Here:
+$30,325State:
+$44,925
(% of AGI for various income ranges: 38.7% for AGIs below $25k , 66.1% for AGIs $25k-50k , 225.7% for AGIs $50k-75k , 499.3% for AGIs $75k-100k , 1080.9% for AGIs $100k-200k , 32444.0% for AGIs over 200k ) Profit/loss from business: +$19,517 (reported on 16.0% of returns )Here:
+$19,517State:
+$14,940
(% of AGI for various income ranges: 126.5% for AGIs below $25k , 110.2% for AGIs $25k-50k , 357.4% for AGIs $50k-75k , 342.1% for AGIs $75k-100k , 950.9% for AGIs $100k-200k , 7272.0% for AGIs over 200k ) Taxable individual retirement arrangement distribution: $18,903 (reported on 13.7% of returns )12845:
$18,903New York:
$19,609
(% of AGI for various income ranges: 69.6% for AGIs below $25k , 150.0% for AGIs $25k-50k , 253.9% for AGIs $50k-75k , 500.0% for AGIs $75k-100k , 1030.5% for AGIs $100k-200k , 4436.0% for AGIs over 200k ) Self-employed (Keogh) retirement plans: $23,850 (reported on 0.8% of returns )12845:
$23,850New York:
$32,497
(% of AGI for various income ranges: 207.4% for AGIs $50k-75k ) Total itemized deductions: $30,238 (reported on 8.0% of returns )Here:
$30,238State:
$39,326
(% of AGI for various income ranges: 134.1% for AGIs below $25k , 271.7% for AGIs $50k-75k , 674.3% for AGIs $75k-100k , 955.5% for AGIs $100k-200k , 3910.0% for AGIs over 200k ) Charity contributions: $6,806 (reported on 6.5% of returns )(% of AGI for various income ranges: 9.5% for AGIs $25k-50k , 62.1% for AGIs $75k-100k , 197.3% for AGIs $100k-200k , 1188.0% for AGIs over 200k ) Taxes paid: $8,248 (reported on 8.0% of returns )(% of AGI for various income ranges: 24.4% for AGIs below $25k , 60.4% for AGIs $50k-75k , 187.9% for AGIs $75k-100k , 299.1% for AGIs $100k-200k , 1080.0% for AGIs over 200k ) Earned income credit: $1,452 (reported on 10.3% of returns )(% of AGI for various income ranges: 40.0% for AGIs below $25k , 40.0% for AGIs $25k-50k ) Percentage of individuals using paid preparers for their 2020 taxes: 93.9%(% for various income ranges: 92.7% for AGIs below $25k , 94.8% for AGIs $25k-50k , 91.4% for AGIs $50k-75k , 96.0% for AGIs $75k-100k , 95.5% for AGIs $100k-200k , 94.7% for AGIs over 200k )
Averages for the 2012 tax year for zip code 12845, filed in 2013:
Average Adjusted Gross Income (AGI) in 2012: $77,917 (Individual Income Tax Returns) Here:
$77,917State:
$77,088
Salary/wage: $51,971 (reported on 80.2% of returns )Here:
$51,971State:
$60,593
(% of AGI for various income ranges: 76.1% for AGIs below $25k , 70.5% for AGIs $25k-50k , 64.6% for AGIs $50k-75k , 59.1% for AGIs $75k-100k , 61.8% for AGIs $100k-200k , 39.4% for AGIs over 200k ) Taxable interest for individuals: $2,688 (reported on 42.2% of returns )This zip code:
$2,688New York:
$3,125
(% of AGI for various income ranges: 2.5% for AGIs below $25k , 1.4% for AGIs $25k-50k , 1.8% for AGIs $50k-75k , 1.7% for AGIs $75k-100k , 1.7% for AGIs $100k-200k , 1.1% for AGIs over 200k ) Ordinary dividends: $6,903 (reported on 28.7% of returns )(% of AGI for various income ranges: 2.8% for AGIs below $25k , 2.5% for AGIs $25k-50k , 2.0% for AGIs $50k-75k , 2.5% for AGIs $75k-100k , 2.8% for AGIs $100k-200k , 2.5% for AGIs over 200k ) Net capital gain/loss in AGI: +$10,808 (reported on 22.9% of returns )Here:
+$10,808State:
+$42,474
(% of AGI for various income ranges: 0.9% for AGIs $25k-50k , 2.7% for AGIs $75k-100k , 2.7% for AGIs $100k-200k , 5.2% for AGIs over 200k ) Profit/loss from business: +$10,937 (reported on 16.7% of returns )Here:
+$10,937State:
+$16,168
(% of AGI for various income ranges: 6.3% for AGIs below $25k , 4.4% for AGIs $25k-50k , 2.4% for AGIs $50k-75k , 3.6% for AGIs $75k-100k , 2.6% for AGIs $100k-200k , 1.0% for AGIs over 200k ) Taxable individual retirement arrangement distribution: $14,356 (reported on 13.2% of returns )12845:
$14,356New York:
$17,621
(% of AGI for various income ranges: 2.9% for AGIs below $25k , 2.5% for AGIs $25k-50k , 2.9% for AGIs $50k-75k , 4.3% for AGIs $75k-100k , 2.6% for AGIs $100k-200k , 1.8% for AGIs over 200k ) Self-employment retirement plans: $15,700 (reported on 0.8% of returns )12845:
$15,700New York:
$27,330
(% of AGI for various income ranges: 1.7% for AGIs $75k-100k ) Total itemized deductions: $33,060 (18% of AGI, reported on 31.8% of returns )Here:
$33,060State:
$34,985
Here:
18.1% of AGIState:
21.3% of AGI
(% of AGI for various income ranges: 11.3% for AGIs below $25k , 11.1% for AGIs $25k-50k , 14.3% for AGIs $50k-75k , 14.0% for AGIs $75k-100k , 16.0% for AGIs $100k-200k , 12.9% for AGIs over 200k ) Charity contributions: $3,021 (reported on 26.4% of returns )(% of AGI for various income ranges: 0.7% for AGIs below $25k , 0.8% for AGIs $25k-50k , 1.2% for AGIs $50k-75k , 1.0% for AGIs $75k-100k , 1.8% for AGIs $100k-200k , 0.7% for AGIs over 200k ) Taxes paid: $14,294 (reported on 31.4% of returns )12845:
$14,294State:
$18,656
(% of AGI for various income ranges: 4.3% for AGIs below $25k , 3.3% for AGIs $25k-50k , 4.8% for AGIs $50k-75k , 5.9% for AGIs $75k-100k , 7.5% for AGIs $100k-200k , 5.9% for AGIs over 200k ) Earned income credit: $1,750 (reported on 14.0% of returns )(% of AGI for various income ranges: 4.1% for AGIs below $25k , 0.7% for AGIs $25k-50k ) Percentage of individuals using paid preparers for their 2012 taxes: 57.0%(% for various income ranges: 47.7% for AGIs below $25k , 55.6% for AGIs $25k-50k , 64.5% for AGIs $50k-75k , 66.7% for AGIs $75k-100k , 71.0% for AGIs $100k-200k , 80.0% for AGIs over 200k )
Averages for the 2004 tax year for zip code 12845, filed in 2005:
Average Adjusted Gross Income (AGI) in 2004: $59,064 (Individual Income Tax Returns) Here:
$59,064State:
$59,519
Salary/wage: $42,083 (reported on 79.2% of returns )Here:
$42,083State:
$50,673
(% of AGI for various income ranges: 100.6% for AGIs below $10k , 71.0% for AGIs $10k-25k , 71.7% for AGIs $25k-50k , 68.6% for AGIs $50k-75k , 67.2% for AGIs $75k-100k , 43.9% for AGIs over 100k ) Taxable interest for individuals: $3,347 (reported on 55.9% of returns )This zip code:
$3,347New York:
$2,377
(% of AGI for various income ranges: 6.0% for AGIs below $10k , 3.8% for AGIs $10k-25k , 1.7% for AGIs $25k-50k , 2.3% for AGIs $50k-75k , 1.2% for AGIs $75k-100k , 4.0% for AGIs over 100k ) Taxable dividends: $5,078 (reported on 32.3% of returns )(% of AGI for various income ranges: 6.5% for AGIs below $10k , 2.7% for AGIs $10k-25k , 1.4% for AGIs $25k-50k , 2.7% for AGIs $50k-75k , 2.1% for AGIs $75k-100k , 3.2% for AGIs over 100k ) Net capital gain/loss: +$11,882 (reported on 26.8% of returns )Here:
+$11,882State:
+$23,581
(% of AGI for various income ranges: -2.2% for AGIs below $10k , 2.6% for AGIs $10k-25k , 2.3% for AGIs $25k-50k , 2.4% for AGIs $50k-75k , 2.3% for AGIs $75k-100k , 8.2% for AGIs over 100k ) Profit/loss from business: +$9,068 (reported on 18.2% of returns )Here:
+$9,068State:
+$13,809
(% of AGI for various income ranges: 1.0% for AGIs below $10k , 4.8% for AGIs $10k-25k , 4.0% for AGIs $25k-50k , 3.3% for AGIs $50k-75k , 2.7% for AGIs $75k-100k , 2.2% for AGIs over 100k ) IRA payment deduction: $3,196 (reported on 3.7% of returns )12845:
$3,196New York:
$3,115
(% of AGI for various income ranges: 0.4% for AGIs $10k-25k , 0.4% for AGIs $25k-50k , 0.3% for AGIs $50k-75k , 0.2% for AGIs $75k-100k , 0.1% for AGIs over 100k ) Self-employed pension: $11,095 (reported on 0.8% of returns )Here:
$11,095New York:
$19,016
Total itemized deductions: $24,587 (19% of AGI, reported on 33.5% of returns )Here:
$24,587State:
$25,864
Here:
19.1% of AGIState:
21.9% of AGI
(% of AGI for various income ranges: 11.4% for AGIs below $10k , 11.5% for AGIs $10k-25k , 12.1% for AGIs $25k-50k , 15.5% for AGIs $50k-75k , 14.0% for AGIs $75k-100k , 14.4% for AGIs over 100k ) Charity contributions deductions: $2,937 (2% of AGI, reported on 31.3% of returns )Here:
2.2% of AGIState:
3.6% of AGI
(% of AGI for various income ranges: 0.4% for AGIs below $10k , 1.0% for AGIs $10k-25k , 1.0% for AGIs $25k-50k , 1.8% for AGIs $50k-75k , 1.3% for AGIs $75k-100k , 1.8% for AGIs over 100k ) Total tax: $11,885 (reported on 75.2% of returns )12845:
$11,885State:
$11,730
(% of AGI for various income ranges: 3.1% for AGIs below $10k , 4.6% for AGIs $10k-25k , 7.4% for AGIs $25k-50k , 8.8% for AGIs $50k-75k , 10.9% for AGIs $75k-100k , 21.4% for AGIs over 100k ) Earned income credit: $1,481 (reported on 12.6% of returns )Percentage of individuals using paid preparers for their 2004 taxes: 61.2%(% for various income ranges: 49.5% for AGIs below $10k , 60.2% for AGIs $10k-25k , 62.8% for AGIs $25k-50k , 65.0% for AGIs $50k-75k , 64.6% for AGIs $75k-100k , 79.0% for AGIs over 100k )
Estimated median household income in 2022: This zip code:
$88,588New York:
$79,557
Nearest zip codes: 12804 ,
12824 ,
12846 ,
12844 ,
12801 ,
12885 .
Warrensburg Zip Code Map
Percentage of family households: This zip code:
32.6%New York:
41.3%
Percentage of households with unmarried partners: This zip code:
5.4%New York:
42.3%
No gay or lesbian households reported
Household received Food Stamps/SNAP in the past 12 months: 107Household did not receive Food Stamps/SNAP in the past 12 months: 1,904
Women who had a birth in the past 12 months: 43 (43 now married , 0 unmarried) Women who did not have a birth in the past 12 months: 726 (302 now married , 421 unmarried)
Housing units in zip code 12845 with a mortgage: 804 (118
second mortgage , 2
home equity loan , 111
both second mortgage and home equity loan )
Houses without a mortgage: 65
Median monthly owner costs for units with a mortgage: $1,795
Median monthly owner costs for units without a mortgage: $693
Residents with income below the poverty level in 2022:
This zip code:
5.6%Whole state:
14.3%
Residents with income below 50% of the poverty level in 2022:
This zip code:
1.9%Whole state:
6.8%
Median number of rooms in houses and condos: Median number of rooms in apartments: Notable locations in this zip code not listed on our city pages
Click to draw/clear zip code borders Notable locations in zip code 12845: (A) , Hearthstone Point State Campsite (B) , Top of The World Golf Course (C) , Ledgeview Village Recreational Vehicle Park (D) , Lake George Recreational Vehicle Park (E) , Veterans Memorial Toll Plaza (F) , Lake George Village Wastewater Treatment Plant (G) , Adirondack Camping Village (H) , Caldwell - Lake George Library (I) , Fort William Henry Museum (J) , Lake George Town Hall (K) , Bay - Ridge Volunteer Fire Company (L) , Lake George Volunteer Fire Department (M) , Bay Ridge Volunteer Fire Company (N) . Display/hide their locations on the map
Churches in zip code 12845 include: (A) , Sacred Heart Roman Catholic Church (B) , Saint James Episcopal Church (C) , Bay Road Presbyterian Church (D) . Display/hide their locations on the map
Cemeteries: (1) , Evergreen Cemetery (2) , Scotch Cemetery (3) . Display/hide their locations on the map
Lakes and reservoirs: (A) , Berry Pond (B) , Bloody Pond (C) , Dream Lake (D) , Hidden Lake (E) , Big Hollow Reservoir (F) . Display/hide their locations on the map
Streams, rivers, and creeks: (A) , Big Hollow Branch (B) , West Brook (C) . Display/hide their locations on the map
Parks in zip code 12845 include: (1) , Lake George Battlefield Park (2) , Lake George Battlefield Park Historic District (3) , Colonel Williams Monument (4) . Display/hide their locations on the map
Year house built (houses)
0 2020 or later370 2010 to 2019332 2000 to 2009366 1990 to 1999416 1980 to 1989509 1970 to 1979499 1960 to 1969396 1950 to 1959203 1940 to 1949469 1939 or earlier
Zip code 12845 household income distribution in 2022 75 Less than $10,00022 $10,000 to $14,999116 $15,000 to $19,99975 $20,000 to $24,99973 $25,000 to $29,99971 $30,000 to $34,99982 $35,000 to $39,99923 $40,000 to $44,99929 $45,000 to $49,999129 $50,000 to $59,999138 $60,000 to $74,999289 $75,000 to $99,999348 $100,000 to $124,999163 $125,000 to $149,999197 $150,000 to $199,999184 $200,000 or moreEstimate of home value of owner-occupied houses/condos in 2022 in zip code 12845 4 $25,000 to $29,9996 $30,000 to $34,9994 $50,000 to $59,9999 $70,000 to $79,9994 $80,000 to $89,99911 $90,000 to $99,99928 $100,000 to $124,9998 $125,000 to $149,999111 $150,000 to $174,99973 $175,000 to $199,999132 $200,000 to $249,999236 $250,000 to $299,999310 $300,000 to $399,999126 $400,000 to $499,999236 $500,000 to $749,999102 $750,000 to $999,99978 $1,000,000 to $1,499,99946 $1,500,000 to $1,999,99954 $2,000,000 or moreRent paid by renters in 2022 in zip code 12845 8 $350 to $3999 $400 to $4497 $450 to $4996 $500 to $5493 $550 to $5997 $600 to $64926 $700 to $74941 $750 to $79970 $800 to $899115 $900 to $999104 $1,000 to $1,24923 $1,250 to $1,4995 $2,500 to $2,99928 No cash rent
Median gross rent in 2022: $1,061.
Median price asked for vacant for-sale houses and condos in 2022: $5,118,924.
Estimated median house (or condo) value in 2022 for: White Non-Hispanic householders: $358,453Asian householders: $549,828Two or more races householders: $284,963Estimated median house or condo value in 2022: $359,953
12845:
$359,953New York:
$400,400
Lower value quartile - upper value quartile: $258,494 - $626,294
Mean price in 2022: Detached houses: $458,877Here:
$458,877State:
$476,719
In 3-to-4-unit structures: $1,889,027Here:
$1,889,027State:
$764,568
Housing units in structures:
One, detached: 2,740One, attached: 228Two: 1433 or 4: 2685 to 9: 610 to 19: 920 to 49: 2950 or more: 2Mobile homes: 70Unemployment : 1.5%
Means of transportation to work in zip code 12845 76.3% 1,549 Drove a car alone6.5% 132 Carpooled0.1% 3 Bus or trolley bus0.5% 10 Streetcar or trolley car0.4% 9 Taxi6.3% 128 Walked9.2% 187 Worked at homeTravel time to work (commute) in zip code 12845 28 Less than 5 minutes263 5 to 9 minutes246 10 to 14 minutes365 15 to 19 minutes344 20 to 24 minutes73 25 to 29 minutes168 30 to 34 minutes27 35 to 39 minutes30 40 to 44 minutes151 45 to 59 minutes85 60 to 89 minutes32 90 or more minutes
Percentage of zip code residents living and working in this county: 77.3%
Household type by relationship:
Households: 4,500
Male householders: 1,051 (275 living alone ), Female householders: 986 (247 living alone )1,012 spouses (993 opposite-sex spouses ), 231 unmarried partners , (212 opposite-sex unmarried partners ), 960 children (865 natural , 56 adopted , 36 stepchildren ), 37 grandchildren , 20 brothers or sisters , 14 parents , 0 foster children , 10 other relatives , 71 non-relatives In group quarters: 171 (-1 institutionalized population )
Size of family households: 744 2-persons , 302 3-persons , 204 4-persons , 71 5-persons , 2 6-persons , 4 7-or-more-persons
Size of nonfamily households: 522 1-person , 164 2-persons , 27 3-persons
558 married couples with children. single-parent households (7 men , 40 women ).
96.4% of residents of 12845 zip code speak English at home. of residents speak Spanish at home (91% very well, 9% well ).of residents speak other Indo-European language at home (81% very well, 19% well ).of residents speak Asian or Pacific Island language at home (100% very well ).
Foreign born population: 125 (2.8%)
(65.7%
of them are naturalized citizens )
This zip code:
2.8%Whole state:
22.7%
23% France 23% Greece 10% North Macedonia (Macedonia) 6% Nepal 6% Malaysia 5% Honduras 3% Poland 22% American 13% Italian 12% English 8% European 7% Irish 6% German 3% Norwegian
Year of entry for the foreign-born population
32 2010 or later 3 2000 to 2009 11 1990 to 1999 100 Before 1990
Facilities with environmental interests located in this zip code:
HALLS BOAT CORP (RACAWANA RD BOX 312 BLDG A in LAKE GEORGE, NY)
Conditionally Exempt Small Quantity Generators, less than 100 kg/month of hazardous waste (Resource Conservation and Recovery Act (tracking hazardous waste)) - notification Organizations: HIBBARD W HALL TRUST (CONTACT/OWNER)
GEORGE E. DEJONG (441 LOCKHART MOUNT RD #16 in LAKE GEORGE, NY)
COMPLIANCE ACTIVITY (Tracking inspections of insecticide, fungicide, and rodenticide, and toxic substances)
Housing units lacking complete plumbing facilities: 1.4%
Housing units lacking complete kitchen facilities: 2.8%
30.8% Fuel oil, kerosene, etc. 27.2% Bottled, tank, or LP gas 24.9% Utility gas 14.3% Electricity 1.3% Wood 0.8% Other fuel
Population in 1990: 4,677. Population change in the 1990s: +124 (+2.7%).
Place of birth for U.S.-born residents:
This state: 3,373Northeast: 610Midwest: 224South: 105West: 29
65% of the 12845 zip code residents lived in the same house 5 years ago.
Out of people who lived in different houses, 55% lived in this county.
Out of people who lived in different counties, 50% lived in New York.
94% of the 12845 zip code residents lived in the same house 1 year ago.
Out of people who lived in different houses, 39% moved from this county.
Out of people who lived in different houses, 27% moved from different county within same state.
Out of people who lived in different houses, 29% moved from different state.
Out of people who lived in different houses, 6% moved from abroad.
Private vs. public school enrollment:
Students in private schools in grades 1 to 8 (elementary and middle school): 2
Students in private schools in grades 9 to 12 (high school): 9
Students in private undergraduate colleges: 66
Occupation by median earnings in the past 12 months ($)
113,038 Law enforcement workers including supervisors 108,447 Computer and mathematical occupations 76,286 Community and social service occupations 71,221 Transportation occupations 69,265 Arts, design, entertainment, sports, and media occupations 67,415 Business and financial operations occupations
Companies with federal contracts located in this zip code:
BARTON MINES COMPANY, L L C (1557 STATE ROUTE 9 in LAKE GEORGE, NY; small business) in 148 contracts from 2000 to 2006
Contracts for Abrasive Materials, Machine Shop Sets, Kits, and Outfits, Miscellaneous Items, Miscellaneous Construction Equipment, and more by Army, Navy, Federal Supply Service, NASA, and others Signed by year: 2000: $72,450; 2001: $73,899; 2002: $113,999; 2003: $533,441; 2004: $568,980; 2005: $701,796; 2006: $231,082.
Biggest contracts: with Army for Abrasive Materials. Signed on 2005-04-26. Completion date: 2006-06-18.
, same as above. Signed on 2003-06-03. Completion date: 2004-06-18.
, same as above. Signed on 2004-04-01. Completion date: 2004-06-18.
, same as above. Signed on 2006-03-06. Completion date: 2007-03-06.
Top industries in this zip code by the number of employees in 2005:
Accommodation and Food Services: Hotels (except Casino Hotels) and Motels (50-99 employees: 1 establishment, 20-49 employees: 3 establishments, 10-19 employees: 4 establishments, 5-9 employees: 3 establishments, 1-4 employees: 53 establishments)Accommodation and Food Services: Full-Service Restaurants (50-99: 1, 20-49: 4, 10-19: 3, 5-9: 6, 1-4: 29)Accommodation and Food Services: Limited-Service Restaurants (20-49: 1, 5-9: 2, 1-4: 5)Arts, Entertainment, and Recreation: All Other Amusement and Recreation Industries (20-49: 1, 1-4: 7)Construction: New Single-Family Housing Construction (except Operative Builders) (10-19: 1, 5-9: 2, 1-4: 8)
People in group quarters in 2010:
157 people in local jails and other municipal confinement facilities
15 people in group homes intended for adults
People in group quarters in 2000:
67 people in local jails and other confinement facilities (including police lockups)
8 people in homes for the mentally retarded
3 people in other noninstitutional group quarters
Fatal accident statistics in 2014:
Fatal accident count: 2Vehicles involved in fatal accidents: 3Fatal accidents caused by drunken drivers: 0Fatalities: 2Persons involved in fatal accidents: 3Pedestrians involved in fatal accidents: 0
Fatal accident statistics in 2013:
Fatal accident count: 1Vehicles involved in fatal accidents: 2Fatal accidents caused by drunken drivers: 1Fatalities: 1Persons involved in fatal accidents: 2Pedestrians involved in fatal accidents: 0
Home Mortgage Disclosure Act Aggregated Statistics For Year 2009(Based on 8 partial tracts) A) FHA, FSA/RHS & VA B) Conventional C) Refinancings D) Home Improvement Loans E) Loans on Dwellings For 5+ Families F) Non-occupant Loans on G) Loans On Manufactured Number Average Value Number Average Value Number Average Value Number Average Value Number Average Value Number Average Value Number Average Value
LOANS ORIGINATED 18 $171,745 88 $235,726 236 $207,362 31 $122,620 2 $356,485 84 $308,467 1 $27,310 APPLICATIONS APPROVED, NOT ACCEPTED 2 $143,595 10 $165,057 19 $215,887 3 $243,840 0 $0 7 $334,351 2 $70,190 APPLICATIONS DENIED 4 $183,010 15 $271,775 98 $238,330 18 $64,570 0 $0 26 $320,233 1 $34,840 APPLICATIONS WITHDRAWN 3 $182,293 9 $201,648 64 $208,756 8 $80,614 0 $0 19 $261,534 0 $0 FILES CLOSED FOR INCOMPLETENESS 0 $0 5 $180,774 15 $193,042 1 $96,380 0 $0 7 $186,406 0 $0
Aggregated Statistics For Year 2008(Based on 8 partial tracts) A) FHA, FSA/RHS & VA B) Conventional C) Refinancings D) Home Improvement Loans E) Loans on Dwellings For 5+ Families F) Non-occupant Loans on G) Loans On Manufactured Number Average Value Number Average Value Number Average Value Number Average Value Number Average Value Number Average Value Number Average Value
LOANS ORIGINATED 12 $203,896 94 $242,417 138 $205,508 48 $100,846 2 $467,595 72 $289,703 3 $91,933 APPLICATIONS APPROVED, NOT ACCEPTED 4 $155,928 22 $287,001 40 $204,052 5 $69,274 0 $0 14 $291,952 1 $129,620 APPLICATIONS DENIED 3 $117,393 16 $229,676 118 $209,146 38 $82,999 0 $0 27 $253,123 1 $88,080 APPLICATIONS WITHDRAWN 2 $151,865 11 $237,428 60 $184,106 16 $88,839 0 $0 7 $205,756 0 $0 FILES CLOSED FOR INCOMPLETENESS 0 $0 1 $179,080 19 $230,794 3 $49,893 0 $0 4 $335,378 0 $0
Aggregated Statistics For Year 2007(Based on 8 partial tracts) A) FHA, FSA/RHS & VA B) Conventional C) Refinancings D) Home Improvement Loans E) Loans on Dwellings For 5+ Families F) Non-occupant Loans on G) Loans On Manufactured Number Average Value Number Average Value Number Average Value Number Average Value Number Average Value Number Average Value Number Average Value
LOANS ORIGINATED 6 $138,470 155 $276,012 201 $193,361 73 $71,739 2 $2,660,400 100 $293,038 4 $118,468 APPLICATIONS APPROVED, NOT ACCEPTED 0 $0 24 $191,907 63 $215,277 14 $152,427 0 $0 15 $203,601 5 $68,960 APPLICATIONS DENIED 2 $208,585 33 $305,395 161 $183,286 66 $75,703 0 $0 27 $291,299 13 $102,881 APPLICATIONS WITHDRAWN 3 $125,723 16 $427,176 72 $189,169 9 $91,031 0 $0 5 $544,452 2 $117,810 FILES CLOSED FOR INCOMPLETENESS 0 $0 3 $518,363 30 $317,391 6 $125,937 0 $0 3 $517,103 0 $0
Aggregated Statistics For Year 2006(Based on 8 partial tracts) A) FHA, FSA/RHS & VA B) Conventional C) Refinancings D) Home Improvement Loans F) Non-occupant Loans on G) Loans On Manufactured Number Average Value Number Average Value Number Average Value Number Average Value Number Average Value Number Average Value
LOANS ORIGINATED 4 $116,975 177 $232,888 241 $181,302 96 $67,519 114 $264,148 2 $63,220 APPLICATIONS APPROVED, NOT ACCEPTED 1 $63,480 19 $258,264 46 $131,440 18 $98,683 13 $217,914 0 $0 APPLICATIONS DENIED 1 $43,950 37 $160,405 165 $171,518 84 $52,520 50 $158,792 17 $48,825 APPLICATIONS WITHDRAWN 0 $0 28 $250,503 109 $189,262 9 $92,359 18 $285,456 0 $0 FILES CLOSED FOR INCOMPLETENESS 0 $0 6 $187,662 35 $204,727 5 $163,764 2 $312,615 0 $0
Aggregated Statistics For Year 2005(Based on 8 partial tracts) A) FHA, FSA/RHS & VA B) Conventional C) Refinancings D) Home Improvement Loans E) Loans on Dwellings For 5+ Families F) Non-occupant Loans on G) Loans On Manufactured Number Average Value Number Average Value Number Average Value Number Average Value Number Average Value Number Average Value Number Average Value
LOANS ORIGINATED 4 $122,602 204 $253,875 232 $161,039 85 $67,023 2 $229,225 101 $294,475 2 $106,285 APPLICATIONS APPROVED, NOT ACCEPTED 0 $0 25 $245,614 56 $131,138 7 $36,866 0 $0 12 $245,669 3 $47,767 APPLICATIONS DENIED 1 $124,540 47 $238,076 210 $138,390 74 $59,524 0 $0 57 $157,423 10 $69,113 APPLICATIONS WITHDRAWN 1 $155,760 22 $280,259 146 $140,100 21 $160,120 0 $0 18 $254,189 0 $0 FILES CLOSED FOR INCOMPLETENESS 0 $0 10 $208,884 48 $177,532 2 $84,925 0 $0 7 $238,476 0 $0
Aggregated Statistics For Year 2004(Based on 8 partial tracts) A) FHA, FSA/RHS & VA B) Conventional C) Refinancings D) Home Improvement Loans E) Loans on Dwellings For 5+ Families F) Non-occupant Loans on G) Loans On Manufactured Number Average Value Number Average Value Number Average Value Number Average Value Number Average Value Number Average Value Number Average Value
LOANS ORIGINATED 16 $124,722 230 $190,746 278 $134,495 69 $55,764 2 $151,815 126 $198,263 5 $63,728 APPLICATIONS APPROVED, NOT ACCEPTED 1 $73,900 18 $160,356 57 $113,964 9 $50,104 0 $0 8 $133,141 2 $51,795 APPLICATIONS DENIED 0 $0 40 $144,636 142 $107,453 45 $41,456 3 $273,483 23 $117,767 5 $54,460 APPLICATIONS WITHDRAWN 2 $116,935 17 $160,736 108 $132,014 8 $87,738 2 $5,774,585 7 $264,153 1 $62,280 FILES CLOSED FOR INCOMPLETENESS 0 $0 3 $125,660 33 $114,585 8 $95,219 0 $0 5 $122,416 0 $0
Aggregated Statistics For Year 2003(Based on 8 partial tracts) A) FHA, FSA/RHS & VA B) Conventional C) Refinancings D) Home Improvement Loans E) Loans on Dwellings For 5+ Families F) Non-occupant Loans on Number Average Value Number Average Value Number Average Value Number Average Value Number Average Value Number Average Value
LOANS ORIGINATED 16 $108,285 192 $165,585 501 $147,393 33 $18,098 4 $247,058 140 $223,269 APPLICATIONS APPROVED, NOT ACCEPTED 0 $0 28 $178,291 95 $130,740 3 $44,370 0 $0 24 $220,141 APPLICATIONS DENIED 2 $84,580 34 $136,819 160 $123,325 32 $42,036 0 $0 20 $198,734 APPLICATIONS WITHDRAWN 1 $121,270 11 $113,495 97 $124,712 3 $18,537 0 $0 7 $194,547 FILES CLOSED FOR INCOMPLETENESS 2 $61,575 5 $97,582 22 $144,569 3 $34,577 0 $0 5 $152,136
Aggregated Statistics For Year 2002(Based on 8 partial tracts) A) FHA, FSA/RHS & VA B) Conventional C) Refinancings D) Home Improvement Loans E) Loans on Dwellings For 5+ Families F) Non-occupant Loans on Number Average Value Number Average Value Number Average Value Number Average Value Number Average Value Number Average Value
LOANS ORIGINATED 13 $79,756 179 $173,819 258 $132,703 27 $25,574 1 $1,073,340 93 $216,011 APPLICATIONS APPROVED, NOT ACCEPTED 0 $0 18 $162,300 48 $122,796 4 $14,380 0 $0 15 $129,517 APPLICATIONS DENIED 5 $64,092 24 $90,251 97 $101,800 28 $17,691 0 $0 14 $98,427 APPLICATIONS WITHDRAWN 4 $93,610 10 $121,547 55 $102,445 3 $25,687 0 $0 12 $109,462 FILES CLOSED FOR INCOMPLETENESS 0 $0 1 $146,060 18 $162,454 0 $0 0 $0 3 $134,847
Aggregated Statistics For Year 2001(Based on 8 partial tracts) A) FHA, FSA/RHS & VA B) Conventional C) Refinancings D) Home Improvement Loans E) Loans on Dwellings For 5+ Families F) Non-occupant Loans on Number Average Value Number Average Value Number Average Value Number Average Value Number Average Value Number Average Value
LOANS ORIGINATED 17 $90,498 172 $148,051 221 $115,259 38 $24,758 1 $142,040 76 $170,939 APPLICATIONS APPROVED, NOT ACCEPTED 3 $82,360 25 $123,172 47 $124,146 7 $27,630 0 $0 7 $128,811 APPLICATIONS DENIED 2 $81,725 30 $133,941 115 $85,852 26 $21,858 0 $0 11 $175,885 APPLICATIONS WITHDRAWN 2 $137,785 11 $149,345 67 $87,946 11 $29,644 0 $0 9 $50,253 FILES CLOSED FOR INCOMPLETENESS 0 $0 7 $66,036 17 $109,929 1 $58,750 0 $0 7 $153,820
Aggregated Statistics For Year 2000(Based on 8 partial tracts) A) FHA, FSA/RHS & VA B) Conventional C) Refinancings D) Home Improvement Loans E) Loans on Dwellings For 5+ Families F) Non-occupant Loans on Number Average Value Number Average Value Number Average Value Number Average Value Number Average Value Number Average Value
LOANS ORIGINATED 10 $77,252 162 $161,946 83 $96,817 39 $15,392 1 $837,500 56 $225,832 APPLICATIONS APPROVED, NOT ACCEPTED 0 $0 30 $106,766 22 $81,048 10 $13,907 0 $0 3 $103,473 APPLICATIONS DENIED 4 $106,590 56 $84,468 102 $112,550 26 $18,212 0 $0 16 $104,644 APPLICATIONS WITHDRAWN 1 $84,000 22 $97,657 75 $137,890 6 $31,203 0 $0 7 $99,181 FILES CLOSED FOR INCOMPLETENESS 0 $0 3 $81,183 8 $76,446 0 $0 0 $0 0 $0
Aggregated Statistics For Year 1999(Based on 4 partial tracts) A) FHA, FSA/RHS & VA B) Conventional C) Refinancings D) Home Improvement Loans F) Non-occupant Loans on Number Average Value Number Average Value Number Average Value Number Average Value Number Average Value
LOANS ORIGINATED 15 $75,815 81 $140,673 87 $100,940 22 $17,372 37 $184,699 APPLICATIONS APPROVED, NOT ACCEPTED 1 $61,530 9 $99,874 33 $99,249 5 $22,920 6 $155,590 APPLICATIONS DENIED 1 $55,140 23 $73,989 58 $74,014 14 $31,023 7 $90,741 APPLICATIONS WITHDRAWN 2 $82,985 9 $106,994 54 $87,766 1 $21,360 6 $102,582 FILES CLOSED FOR INCOMPLETENESS 0 $0 2 $301,530 13 $76,067 0 $0 3 $114,173
Detailed HMDA statistics for the following Tracts:
0706.00
,
0720.00 ,
0730.00 ,
0780.00
Private Mortgage Insurance Companies Aggregated Statistics For Year 2009(Based on 8 partial tracts) A) Conventional B) Refinancings C) Non-occupant Loans on Number Average Value Number Average Value Number Average Value
LOANS ORIGINATED 7 $261,876 3 $226,333 0 $0 APPLICATIONS APPROVED, NOT ACCEPTED 2 $245,100 1 $235,170 0 $0 APPLICATIONS DENIED 7 $264,271 2 $124,815 5 $236,650 APPLICATIONS WITHDRAWN 2 $249,920 0 $0 2 $134,800 FILES CLOSED FOR INCOMPLETENESS 0 $0 2 $295,395 0 $0
Aggregated Statistics For Year 2008(Based on 8 partial tracts) A) Conventional B) Refinancings C) Non-occupant Loans on Number Average Value Number Average Value Number Average Value
LOANS ORIGINATED 17 $199,626 9 $254,412 10 $182,991 APPLICATIONS APPROVED, NOT ACCEPTED 3 $151,993 9 $224,944 2 $145,305 APPLICATIONS DENIED 3 $163,710 1 $146,060 1 $146,060 APPLICATIONS WITHDRAWN 2 $124,815 0 $0 0 $0 FILES CLOSED FOR INCOMPLETENESS 0 $0 2 $231,095 2 $188,885
Aggregated Statistics For Year 2007(Based on 8 partial tracts) A) Conventional B) Refinancings C) Non-occupant Loans on D) Loans On Manufactured Number Average Value Number Average Value Number Average Value Number Average Value
LOANS ORIGINATED 22 $222,595 15 $226,712 5 $192,564 2 $169,750 APPLICATIONS APPROVED, NOT ACCEPTED 4 $205,725 2 $221,585 0 $0 0 $0 APPLICATIONS DENIED 1 $102,510 2 $130,640 2 $130,640 0 $0 APPLICATIONS WITHDRAWN 1 $89,080 0 $0 1 $41,540 0 $0 FILES CLOSED FOR INCOMPLETENESS 0 $0 0 $0 0 $0 0 $0
Aggregated Statistics For Year 2006(Based on 8 partial tracts) A) Conventional B) Refinancings C) Non-occupant Loans on Number Average Value Number Average Value Number Average Value
LOANS ORIGINATED 17 $168,834 11 $220,702 4 $171,498 APPLICATIONS APPROVED, NOT ACCEPTED 7 $154,267 1 $255,360 2 $101,515 APPLICATIONS DENIED 0 $0 0 $0 0 $0 APPLICATIONS WITHDRAWN 0 $0 0 $0 0 $0 FILES CLOSED FOR INCOMPLETENESS 0 $0 0 $0 0 $0
Aggregated Statistics For Year 2005(Based on 8 partial tracts) A) Conventional B) Refinancings C) Non-occupant Loans on Number Average Value Number Average Value Number Average Value
LOANS ORIGINATED 33 $190,164 13 $179,890 10 $178,164 APPLICATIONS APPROVED, NOT ACCEPTED 6 $156,053 1 $338,350 1 $400,540 APPLICATIONS DENIED 1 $105,190 0 $0 0 $0 APPLICATIONS WITHDRAWN 0 $0 0 $0 0 $0 FILES CLOSED FOR INCOMPLETENESS 1 $207,030 0 $0 1 $207,030
Aggregated Statistics For Year 2004(Based on 8 partial tracts) A) Conventional B) Refinancings C) Non-occupant Loans on Number Average Value Number Average Value Number Average Value
LOANS ORIGINATED 36 $216,808 7 $167,607 13 $208,778 APPLICATIONS APPROVED, NOT ACCEPTED 7 $213,641 2 $114,125 0 $0 APPLICATIONS DENIED 1 $253,930 0 $0 0 $0 APPLICATIONS WITHDRAWN 1 $308,380 0 $0 1 $307,530 FILES CLOSED FOR INCOMPLETENESS 1 $78,390 0 $0 0 $0
Aggregated Statistics For Year 2003(Based on 8 partial tracts) A) Conventional B) Refinancings C) Non-occupant Loans on Number Average Value Number Average Value Number Average Value
LOANS ORIGINATED 36 $143,934 25 $139,167 11 $213,165 APPLICATIONS APPROVED, NOT ACCEPTED 7 $136,273 13 $178,552 2 $86,820 APPLICATIONS DENIED 6 $114,048 0 $0 0 $0 APPLICATIONS WITHDRAWN 0 $0 4 $125,442 0 $0 FILES CLOSED FOR INCOMPLETENESS 0 $0 0 $0 0 $0
Aggregated Statistics For Year 2002(Based on 8 partial tracts) A) Conventional B) Refinancings C) Non-occupant Loans on Number Average Value Number Average Value Number Average Value
LOANS ORIGINATED 36 $124,795 19 $131,233 13 $106,213 APPLICATIONS APPROVED, NOT ACCEPTED 10 $136,098 8 $105,890 0 $0 APPLICATIONS DENIED 2 $84,085 0 $0 1 $45,560 APPLICATIONS WITHDRAWN 2 $129,650 1 $110,500 1 $77,130 FILES CLOSED FOR INCOMPLETENESS 0 $0 0 $0 0 $0
Aggregated Statistics For Year 2001(Based on 8 partial tracts) A) Conventional B) Refinancings C) Non-occupant Loans on Number Average Value Number Average Value Number Average Value
LOANS ORIGINATED 33 $136,560 17 $152,276 5 $230,050 APPLICATIONS APPROVED, NOT ACCEPTED 1 $174,430 9 $114,591 1 $28,470 APPLICATIONS DENIED 2 $284,580 2 $94,025 2 $284,580 APPLICATIONS WITHDRAWN 0 $0 3 $110,947 0 $0 FILES CLOSED FOR INCOMPLETENESS 0 $0 2 $94,025 0 $0
Aggregated Statistics For Year 2000(Based on 8 partial tracts) A) Conventional B) Refinancings C) Non-occupant Loans on Number Average Value Number Average Value Number Average Value
LOANS ORIGINATED 30 $90,050 2 $238,385 9 $75,292 APPLICATIONS APPROVED, NOT ACCEPTED 3 $155,187 1 $59,110 0 $0 APPLICATIONS DENIED 0 $0 0 $0 0 $0 APPLICATIONS WITHDRAWN 0 $0 0 $0 0 $0 FILES CLOSED FOR INCOMPLETENESS 0 $0 0 $0 0 $0
Aggregated Statistics For Year 1999(Based on 4 partial tracts) A) Conventional B) Refinancings C) Non-occupant Loans on Number Average Value Number Average Value Number Average Value
LOANS ORIGINATED 10 $133,575 3 $109,050 6 $114,695 APPLICATIONS APPROVED, NOT ACCEPTED 2 $50,930 0 $0 0 $0 APPLICATIONS DENIED 0 $0 0 $0 0 $0 APPLICATIONS WITHDRAWN 0 $0 0 $0 0 $0 FILES CLOSED FOR INCOMPLETENESS 0 $0 0 $0 0 $0
Detailed PMIC statistics for the following Tracts:
0706.00
,
0720.00 ,
0730.00 ,
0780.00
2002 - 2018 National Fire Incident Reporting System (NFIRS) incidents See full 2006 National Fire Incident Reporting System statistics for zip code 12845, New York
Most common first names in zip code 12845 among deceased individuals Name Count Lived (average)
John 41 72.3 years Mary 37 79.1 years Robert 35 72.8 years William 34 74.7 years Charles 33 74.6 years George 33 73.9 years Joseph 29 77.1 years James 27 76.3 years Ruth 23 79.2 years Edward 22 74.3 years
Most common last names in zip code 12845 among deceased individuals Last name Count Lived (average)
Smith 13 69.2 years Moon 10 78.8 years Ross 9 71.8 years Sullivan 8 78.9 years Williams 7 74.0 years Palmer 7 80.3 years Wood 7 78.3 years Higgins 6 71.5 years Monroe 6 82.4 years Fish 6 69.3 years
Businesses in zip code 12845
Name Count Name Count
Banana Republic 1 Holiday Inn 1 Ben & Jerry's 1 IZOD 1 Best Western 1 J.Crew 1 Brooks Brothers 1 Jones New York 1 Casual Male XL 1 Lane Bryant 1 Chevrolet 1 McDonald's 1 Clarion 1 New Balance 1 Comfort Suites 1 Nike 2 DressBarn 1 Pac Sun 1 Dressbarn 1 Quality 1 Dunkin Donuts 2 Rite Aid 1 Econo Lodge 1 Rodeway Inn 1 Eddie Bauer 1 Super 8 2 Famous Footwear 1 Travelodge 1 FedEx 2 UPS 1 Gap 1 Vans 1 Gymboree 1 Wingate 1 Hilton 1
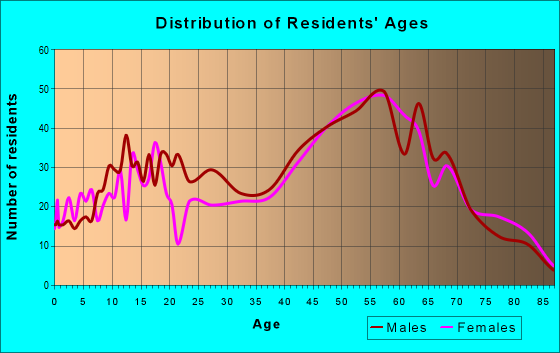
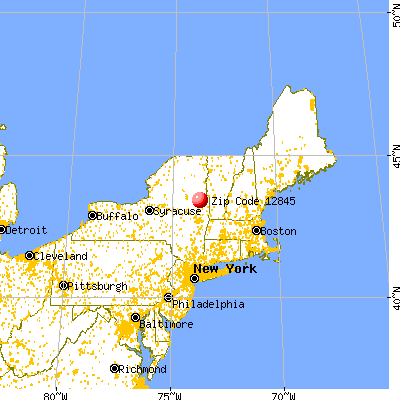


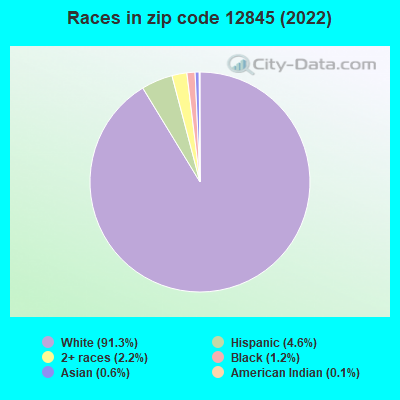


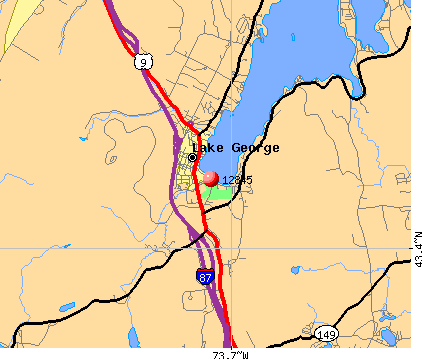 Nearest zip codes: 12804, 12824, 12846, 12844, 12801, 12885.
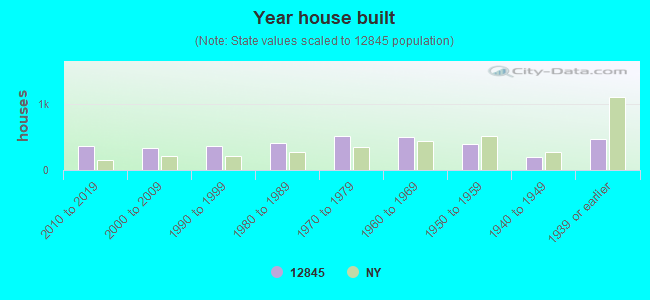
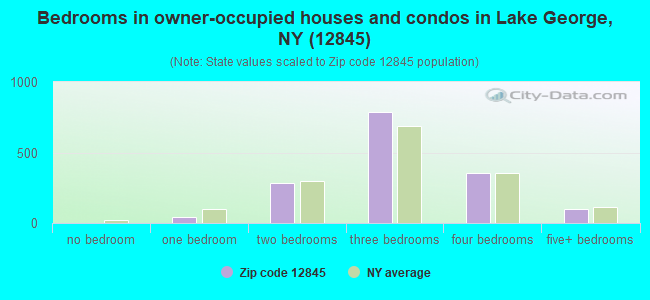
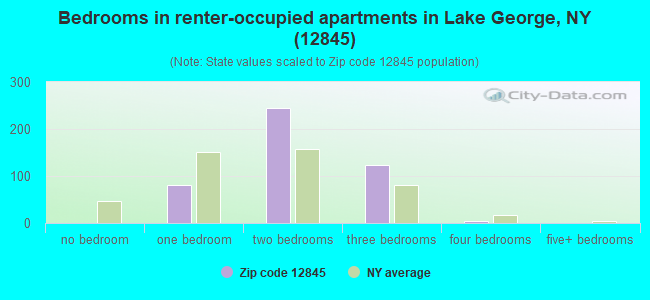
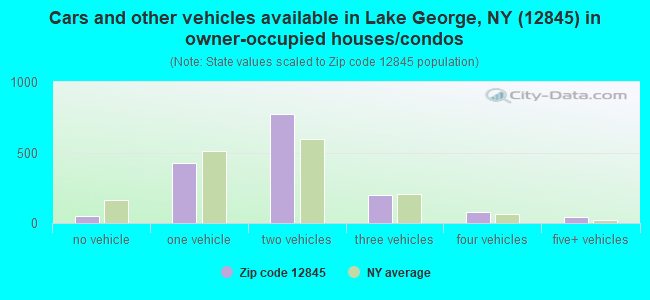
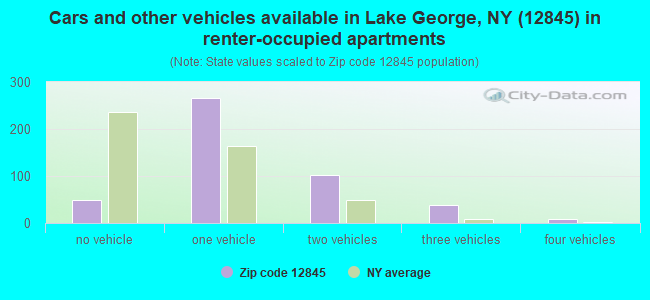


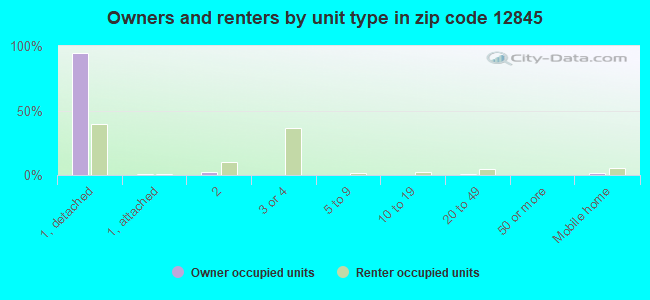
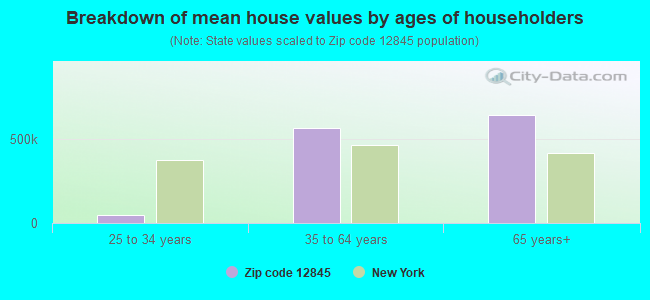


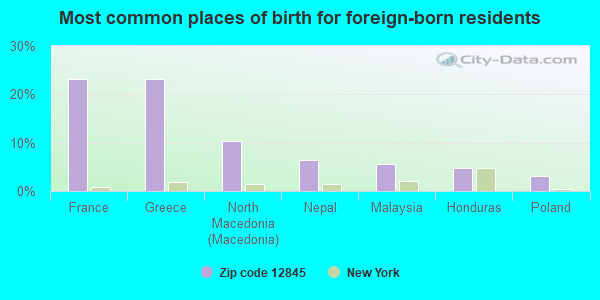
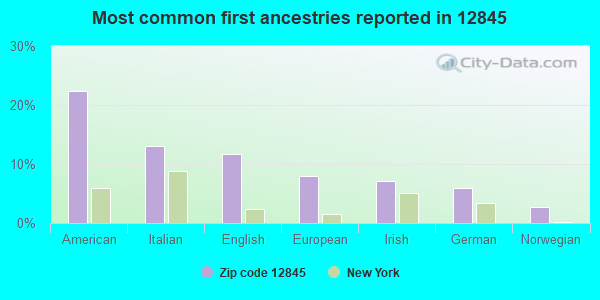
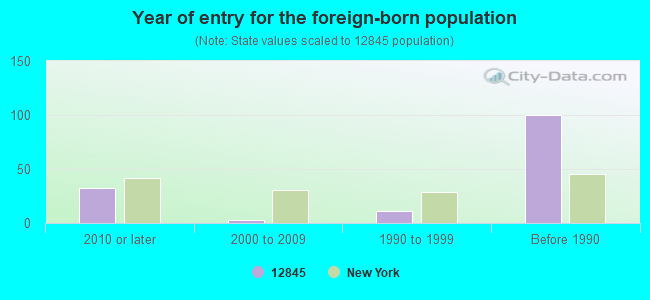
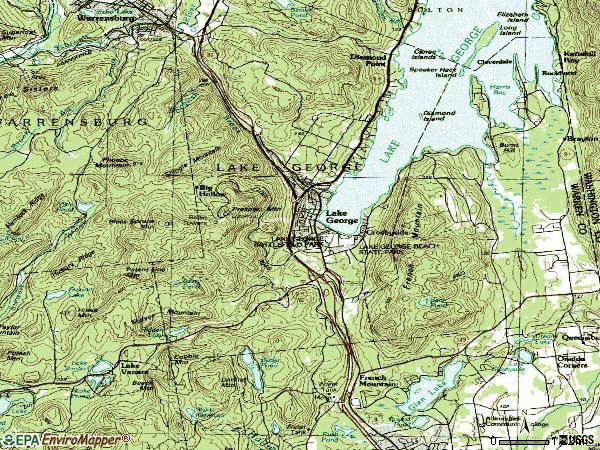

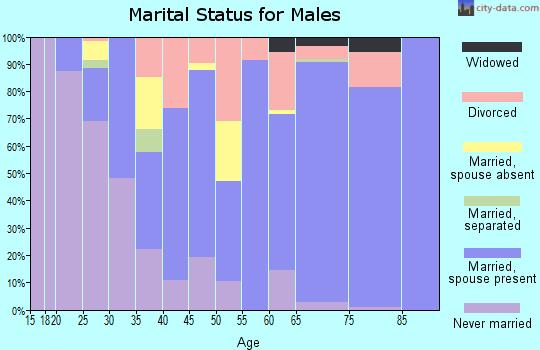
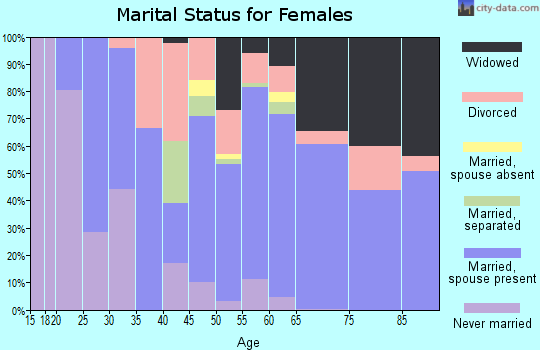
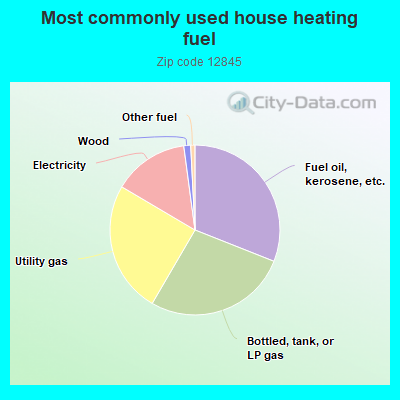
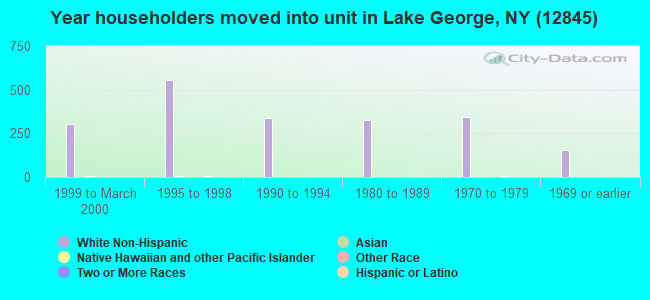
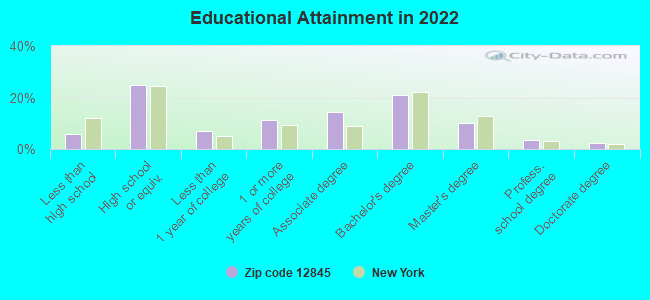
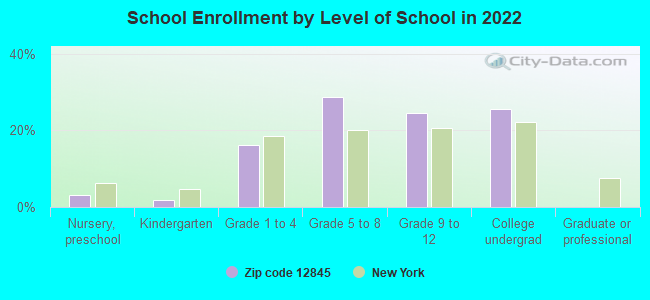
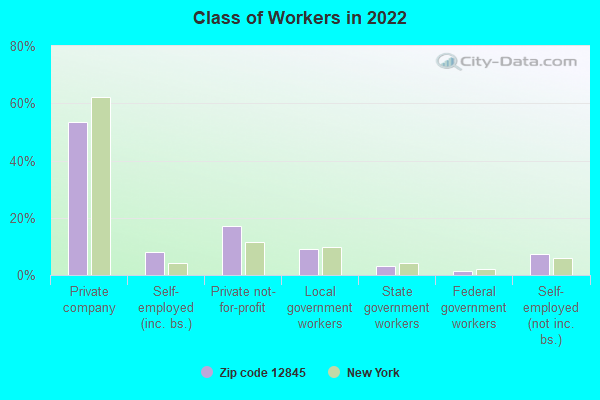
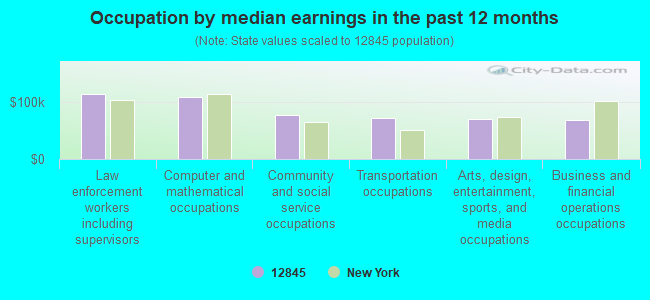
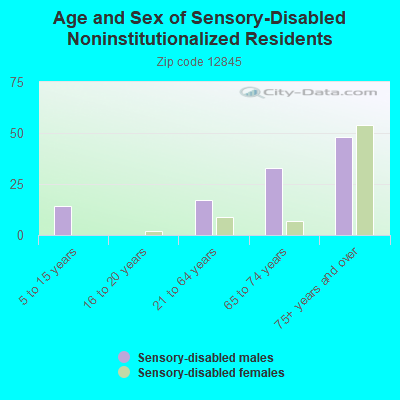
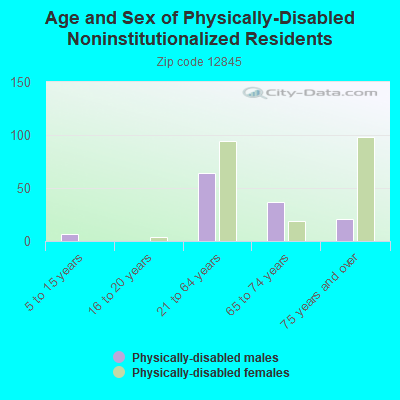
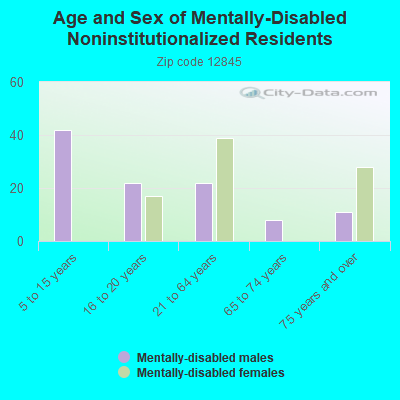
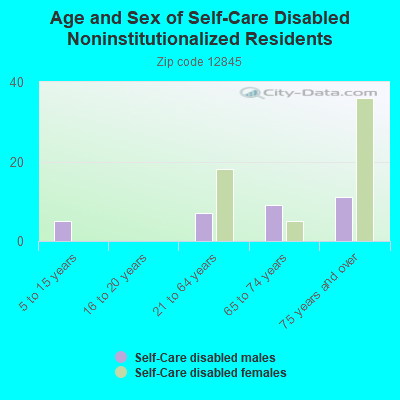
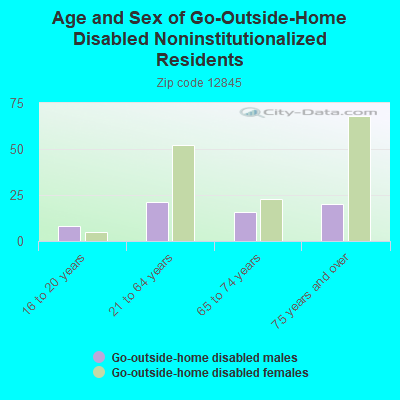
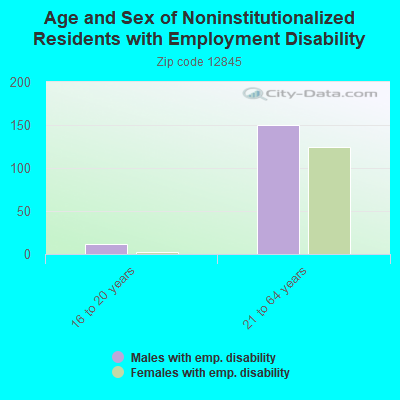
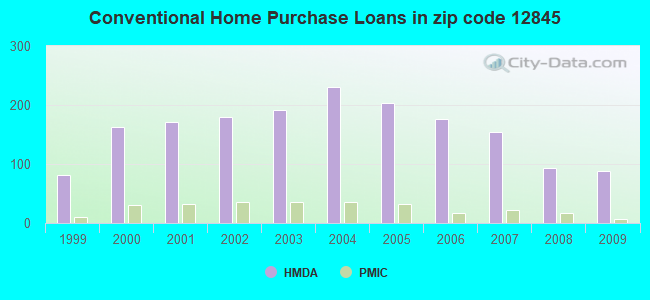
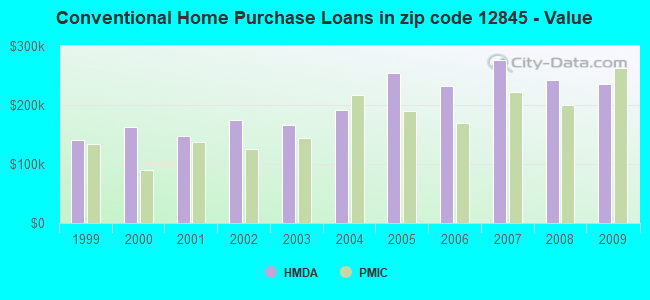
 According to the data from the years 2002 - 2018 the average number of fire incidents per year is 39. The highest number of reported fires - 61 took place in 2006, and the least - 13 in 2018. The data has a decreasing trend.
 When looking into fire subcategories, the most incidents belonged to: Structure Fires (51.6%), and Outside Fires (28.1%).