Estimated zip code population in 2022: 3,602 Zip code population in 2010: 3,556 Zip code population in 2000: 4,544
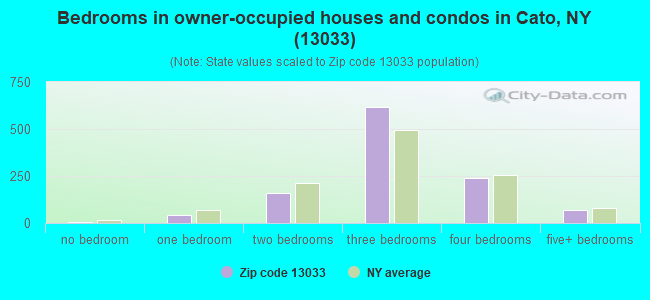
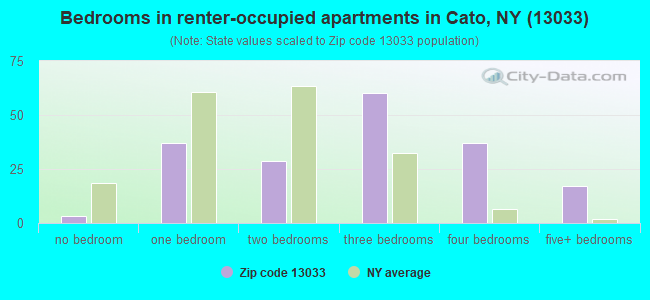
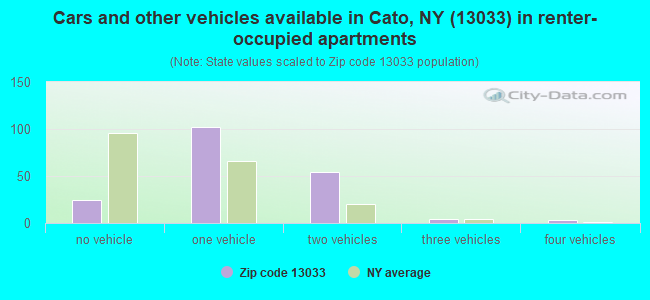
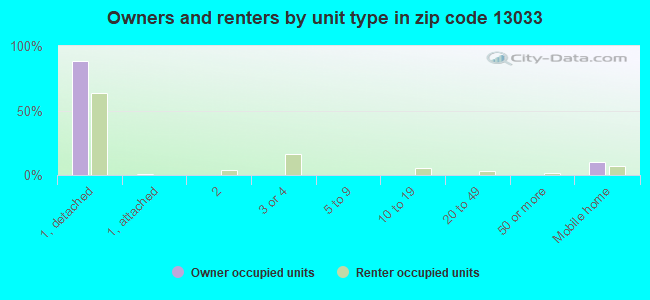
Houses and condos: 1,448 Renter-occupied apartments: 186
% of renters here:
14%
State:
46%
March 2022 cost of living index in zip code 13033: 94.8 (less than average, U.S. average is 100)
Land area: 61.6 sq. mi. Water area: 0.5 sq. mi.
Population density: 58 people per square mile
(very low).
OSM Map
General Map
Google Map
MSN Map
OSM Map
General Map
Google Map
MSN Map
OSM Map
General Map
Google Map
MSN Map
OSM Map
General Map
Google Map
MSN Map
Please wait while loading the map...
Real estate property taxes paid for housing units in 2022:
This zip code:
1.9% ($3,017)
New York:
1.5% ($6,180)
Median real estate property taxes paid for housing units with mortgages in 2022: $3,561 (2.1%) Median real estate property taxes paid for housing units with no mortgage in 2022: $2,431 (1.7%)
Business Search- 14 Million verified businesses
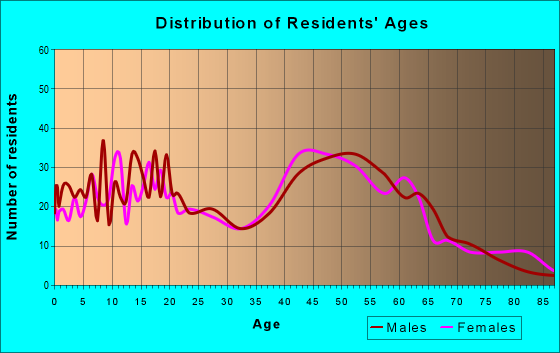
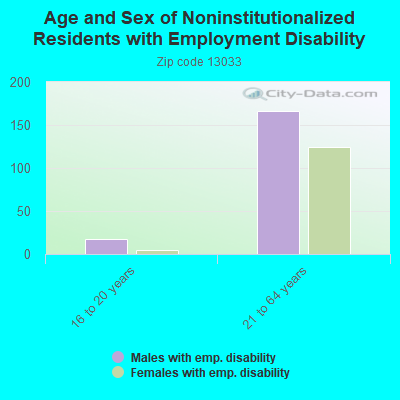
Males: 1,842
(51.1%)
Females: 1,760
(48.9%)
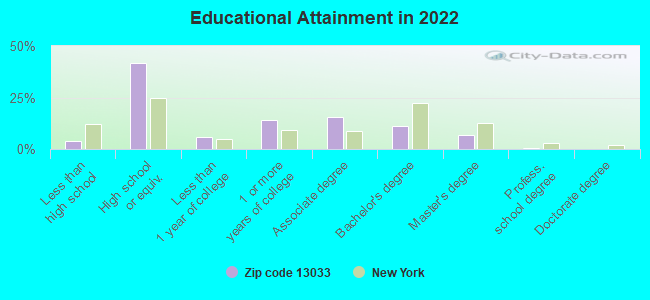
For population 25 years and over in 13033:
High school or higher: 94.7%
Bachelor's degree or higher: 18.5%
Graduate or professional degree: 7.3%
Unemployed: 3.9%
Mean travel time to work (commute): 28.5 minutes
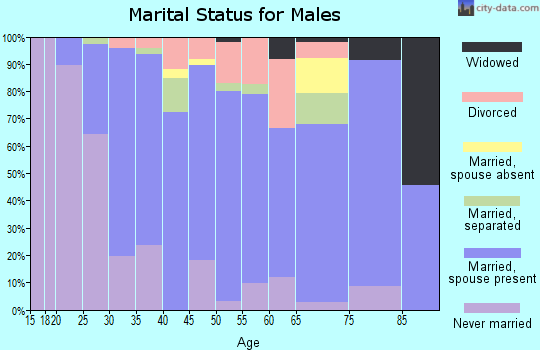
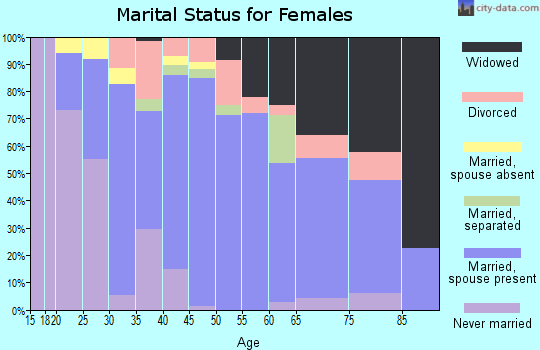
For population 15 years and over in 13033:
Never married: 26.0%
Now married: 60.6%
Separated: 2.4%
Widowed: 3.5%
Divorced: 7.5%
Zip code 13033 compared to state average:
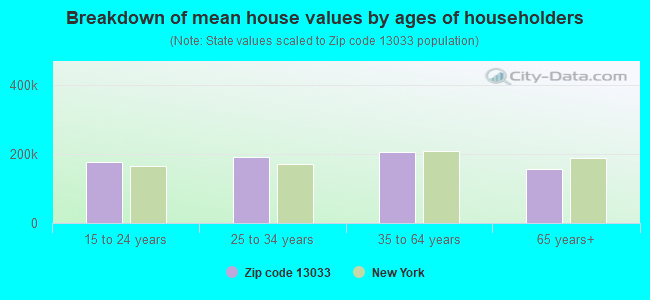
Median house value significantly below state average.
Black race population percentage significantly below state average.
Hispanic race population percentage significantly below state average.
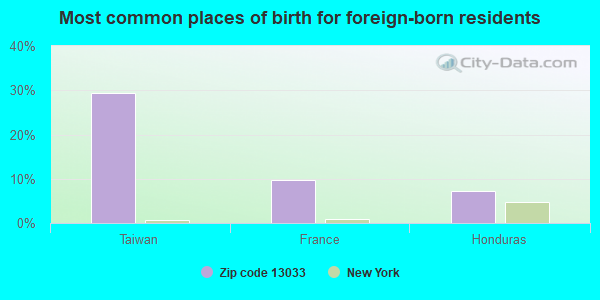
Foreign-born population percentage significantly below state average.
Renting percentage significantly below state average.
Length of stay since moving in above state average.
Number of rooms per house above state average.
Percentage of population with a bachelor's degree or higher significantly below state average.
Averages for the 2020 tax year for zip code 13033, filed in 2021:
Average Adjusted Gross Income (AGI) in 2020: $59,354 (Individual Income Tax Returns)
Here:
$59,354
State:
$90,930
Salary/wage: $52,153 (reported on 83.0% of returns)
Here:
$52,153
State:
$72,104
(% of AGI for various income ranges: 1074.6% for AGIs below $25k, 3498.4% for AGIs $25k-50k, 6190.0% for AGIs $50k-75k, 9725.7% for AGIs $75k-100k, 14377.4% for AGIs $100k-200k)
Taxable interest for individuals: $514 (reported on 33.5% of returns)
This zip code:
$514
New York:
$3,075
(% of AGI for various income ranges: 12.3% for AGIs below $25k, 11.4% for AGIs $25k-50k, 11.7% for AGIs $50k-75k, 47.1% for AGIs $75k-100k, 53.2% for AGIs $100k-200k)
Ordinary dividends: $1,954 (reported on 14.8% of returns)
Here:
$1,954
State:
$11,095
(% of AGI for various income ranges: 14.9% for AGIs below $25k, 12.4% for AGIs $25k-50k, 43.9% for AGIs $50k-75k, 102.1% for AGIs $75k-100k, 87.4% for AGIs $100k-200k)
Net capital gain/loss in AGI: +$4,730 (reported on 11.4% of returns)
Here:
+$4,730
State:
+$44,925
(% of AGI for various income ranges: 8.9% for AGIs below $25k, 21.4% for AGIs $25k-50k, 73.0% for AGIs $50k-75k, 123.6% for AGIs $75k-100k, 260.5% for AGIs $100k-200k)
Profit/loss from business: +$6,919 (reported on 11.9% of returns)
Here:
+$6,919
State:
+$14,940
(% of AGI for various income ranges: 75.4% for AGIs below $25k, 87.8% for AGIs $25k-50k, 87.0% for AGIs $50k-75k, 236.4% for AGIs $75k-100k, 175.3% for AGIs $100k-200k)
Taxable individual retirement arrangement distribution: $14,844 (reported on 9.1% of returns)
13033:
$14,844
New York:
$19,609
(% of AGI for various income ranges: 84.9% for AGIs below $25k, 80.8% for AGIs $25k-50k, 204.3% for AGIs $50k-75k, 253.6% for AGIs $75k-100k, 502.1% for AGIs $100k-200k)
Total itemized deductions: $21,660 (reported on 2.8% of returns)
Here:
$21,660
State:
$39,326
(% of AGI for various income ranges: 773.6% for AGIs $75k-100k)
Charity contributions: $2,100 (reported on 1.7% of returns)
Here:
$2,100
State:
$15,420
(% of AGI for various income ranges: 27.4% for AGIs $50k-75k)
Taxes paid: $7,620 (reported on 2.8% of returns)
13033:
$7,620
State:
$9,183
(% of AGI for various income ranges: 52.7% for AGIs $25k-50k, 97.9% for AGIs $100k-200k)
Earned income credit: $2,164 (reported on 14.2% of returns)
Here:
$2,164
State:
$2,138
(% of AGI for various income ranges: 74.0% for AGIs below $25k, 76.2% for AGIs $25k-50k)
Percentage of individuals using paid preparers for their 2020 taxes: 97.2%
Here:
97%
State:
95%
(% for various income ranges: 93.8% for AGIs below $25k, 97.8% for AGIs $25k-50k, 100.0% for AGIs $50k-75k, 100.0% for AGIs $75k-100k, 96.3% for AGIs $100k-200k, 100.0% for AGIs over 200k)
Averages for the 2012 tax year for zip code 13033, filed in 2013:
Average Adjusted Gross Income (AGI) in 2012: $46,830 (Individual Income Tax Returns)
Here:
$46,830
State:
$77,088
Salary/wage: $42,309 (reported on 85.0% of returns)
Here:
$42,309
State:
$60,593
(% of AGI for various income ranges: 69.4% for AGIs below $25k, 80.7% for AGIs $25k-50k, 78.0% for AGIs $50k-75k, 85.2% for AGIs $75k-100k, 70.2% for AGIs $100k-200k)
Taxable interest for individuals: $406 (reported on 35.8% of returns)
This zip code:
$406
New York:
$3,125
(% of AGI for various income ranges: 0.7% for AGIs below $25k, 0.2% for AGIs $25k-50k, 0.1% for AGIs $50k-75k, 0.3% for AGIs $75k-100k, 0.4% for AGIs $100k-200k)
Ordinary dividends: $1,186 (reported on 16.8% of returns)
Here:
$1,186
State:
$10,299
(% of AGI for various income ranges: 0.8% for AGIs below $25k, 0.5% for AGIs $25k-50k, 0.6% for AGIs $50k-75k, 0.1% for AGIs $75k-100k, 0.3% for AGIs $100k-200k)
Net capital gain/loss in AGI: +$3,933 (reported on 10.4% of returns)
Here:
+$3,933
State:
+$42,474
(% of AGI for various income ranges: 0.1% for AGIs $25k-50k, 0.8% for AGIs $50k-75k, 0.8% for AGIs $75k-100k, 1.8% for AGIs $100k-200k)
Profit/loss from business: +$7,543 (reported on 13.3% of returns)
Here:
+$7,543
State:
+$16,168
(% of AGI for various income ranges: 4.1% for AGIs below $25k, 1.3% for AGIs $25k-50k, 0.9% for AGIs $50k-75k, 1.4% for AGIs $75k-100k, 3.5% for AGIs $100k-200k)
Taxable individual retirement arrangement distribution: $14,225 (reported on 9.2% of returns)
13033:
$14,225
New York:
$17,621
(% of AGI for various income ranges: 5.1% for AGIs below $25k, 2.5% for AGIs $25k-50k, 4.0% for AGIs $50k-75k, 3.1% for AGIs $100k-200k)
Total itemized deductions: $16,800 (20% of AGI, reported on 26.0% of returns)
Here:
$16,800
State:
$34,985
Here:
19.8% of AGI
State:
21.3% of AGI
(% of AGI for various income ranges: 4.8% for AGIs below $25k, 6.7% for AGIs $25k-50k, 8.4% for AGIs $50k-75k, 10.7% for AGIs $75k-100k, 12.4% for AGIs $100k-200k)
Charity contributions: $2,009 (reported on 19.7% of returns)
Here:
$2,009
State:
$5,572
(% of AGI for various income ranges: 0.7% for AGIs $25k-50k, 0.8% for AGIs $50k-75k, 0.9% for AGIs $75k-100k, 1.2% for AGIs $100k-200k)
Taxes paid: $8,040 (reported on 26.0% of returns)
13033:
$8,040
State:
$18,656
(% of AGI for various income ranges: 1.5% for AGIs below $25k, 2.4% for AGIs $25k-50k, 3.7% for AGIs $50k-75k, 5.1% for AGIs $75k-100k, 7.0% for AGIs $100k-200k)
Earned income credit: $2,059 (reported on 18.5% of returns)
Here:
$2,059
State:
$2,230
(% of AGI for various income ranges: 5.9% for AGIs below $25k, 1.2% for AGIs $25k-50k)
Percentage of individuals using paid preparers for their 2012 taxes: 57.2%
Here:
57%
State:
66%
(% for various income ranges: 50.8% for AGIs below $25k, 57.8% for AGIs $25k-50k, 62.1% for AGIs $50k-75k, 58.8% for AGIs $75k-100k, 70.6% for AGIs $100k-200k)
Averages for the 2004 tax year for zip code 13033, filed in 2005:
Average Adjusted Gross Income (AGI) in 2004: $37,802 (Individual Income Tax Returns)
Here:
$37,802
State:
$59,519
Salary/wage: $35,489 (reported on 87.6% of returns)
Here:
$35,489
State:
$50,673
(% of AGI for various income ranges: 104.5% for AGIs below $10k, 74.4% for AGIs $10k-25k, 82.7% for AGIs $25k-50k, 85.0% for AGIs $50k-75k, 88.6% for AGIs $75k-100k, 69.7% for AGIs over 100k)
Taxable interest for individuals: $620 (reported on 46.2% of returns)
This zip code:
$620
New York:
$2,377
(% of AGI for various income ranges: 4.1% for AGIs below $10k, 1.5% for AGIs $10k-25k, 0.6% for AGIs $25k-50k, 0.5% for AGIs $50k-75k, 0.4% for AGIs $75k-100k, 1.0% for AGIs over 100k)
Taxable dividends: $775 (reported on 19.8% of returns)
Here:
$775
State:
$5,394
(% of AGI for various income ranges: 1.1% for AGIs below $10k, 0.5% for AGIs $10k-25k, 0.4% for AGIs $25k-50k, 0.4% for AGIs $50k-75k, 0.1% for AGIs $75k-100k, 0.7% for AGIs over 100k)
Net capital gain/loss: +$3,275 (reported on 14.0% of returns)
Here:
+$3,275
State:
+$23,581
(% of AGI for various income ranges: 3.1% for AGIs below $10k, 0.7% for AGIs $10k-25k, 1.0% for AGIs $25k-50k, 0.2% for AGIs $50k-75k, 0.8% for AGIs $75k-100k, 4.3% for AGIs over 100k)
Profit/loss from business: +$4,291 (reported on 13.5% of returns)
Here:
+$4,291
State:
+$13,809
(% of AGI for various income ranges: 10.9% for AGIs below $10k, 5.0% for AGIs $10k-25k, 1.4% for AGIs $25k-50k, 0.8% for AGIs $50k-75k, 0.3% for AGIs $75k-100k, 0.9% for AGIs over 100k)
IRA payment deduction: $2,381 (reported on 2.5% of returns)
13033:
$2,381
New York:
$3,115
Total itemized deductions: $15,090 (22% of AGI, reported on 27.2% of returns)
Here:
$15,090
State:
$25,864
Here:
22.3% of AGI
State:
21.9% of AGI
(% of AGI for various income ranges: 7.2% for AGIs below $10k, 4.6% for AGIs $10k-25k, 8.2% for AGIs $25k-50k, 10.2% for AGIs $50k-75k, 13.6% for AGIs $75k-100k, 18.2% for AGIs over 100k)
Charity contributions deductions: $2,130 (3% of AGI, reported on 23.8% of returns)
Here:
$2,130
State:
$4,439
Here:
3.0% of AGI
State:
3.6% of AGI
(% of AGI for various income ranges: 0.7% for AGIs $10k-25k, 0.9% for AGIs $25k-50k, 1.1% for AGIs $50k-75k, 1.5% for AGIs $75k-100k, 3.2% for AGIs over 100k)
Total tax: $4,152 (reported on 75.4% of returns)
13033:
$4,152
State:
$11,730
(% of AGI for various income ranges: 3.4% for AGIs below $10k, 4.1% for AGIs $10k-25k, 6.2% for AGIs $25k-50k, 8.4% for AGIs $50k-75k, 9.6% for AGIs $75k-100k, 13.9% for AGIs over 100k)
Earned income credit: $1,602 (reported on 14.8% of returns)
Here:
$1,602
State:
$1,757
Percentage of individuals using paid preparers for their 2004 taxes: 57.6%
Here:
58%
State:
67%
(% for various income ranges: 43.2% for AGIs below $10k, 64.2% for AGIs $10k-25k, 59.9% for AGIs $25k-50k, 57.3% for AGIs $50k-75k, 65.1% for AGIs $75k-100k, 62.7% for AGIs over 100k)
Likely homosexual households (counted as self-reported same-sex unmarried-partner households)
Lesbian couples: 0.0% of all households
Gay men: 1.3% of all households
Household received Food Stamps/SNAP in the past 12 months: 143 Household did not receive Food Stamps/SNAP in the past 12 months: 1,167
Women who had a birth in the past 12 months: 31 (31 now married, 0 unmarried) Women who did not have a birth in the past 12 months: 712 (401 now married, 304 unmarried)
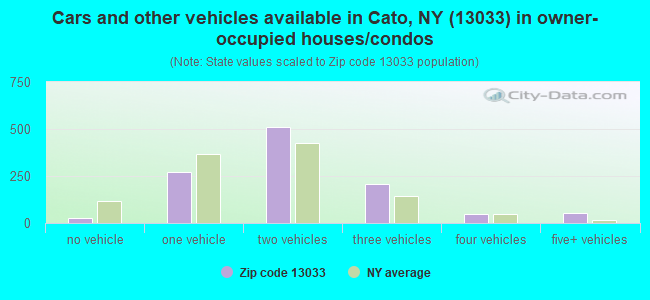
Housing units in zip code 13033 with a mortgage: 670 (71 second mortgage, 62 both second mortgage and home equity loan) Houses without a mortgage: 26
Median monthly owner costs for units with a mortgage: $1,525 Median monthly owner costs for units without a mortgage: $533
Residents with income below the poverty level in 2022:
This zip code:
11.4%
Whole state:
14.3%
Residents with income below 50% of the poverty level in 2022:
This zip code:
3.7%
Whole state:
6.8%
Median number of rooms in houses and condos:
Here:
6.8
State:
6.3
Median number of rooms in apartments:
Here:
6.4
State:
3.8
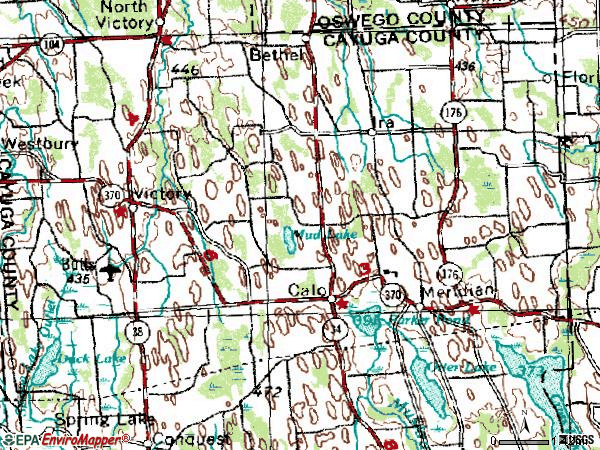
Notable locations in this zip code not listed on our city pages
Notable locations in zip code 13033: Cross Lake Marina (A), Benton Corners (B), Joyful Acres (C), Stewart B Lang Memorial Library (D), Cato Fire Department (E). Display/hide their locations on the map
Churches in zip code 13033 include: Armour of Light Baptist Church (A), Cato Union Church (B), Saint Patrick's Church (C). Display/hide their locations on the map
Cemeteries: Victory Union Cemetery (1), Cummings Cemetery (2), Meridian Village Cemetery (3), Union Hill Cemetery (4), Dutton Cemetery (5), Marble Ridge Cemetery (6), White Cemetery (7). Display/hide their locations on the map
635 married couples with children.
156 single-parent households (105 men, 51 women).
97.4% of residents of 13033 zip code speak English at home.
0.7% of residents speak Spanish at home (92% very well, 8% well).
0.9% of residents speak other Indo-European language at home (100% very well).
0.4% of residents speak Asian or Pacific Island language at home (100% well).
Foreign born population: 40 (1.1%) (22.3% of them are naturalized citizens)
This zip code:
1.1%
Whole state:
22.7%
29%Taiwan
10%France
7%Honduras
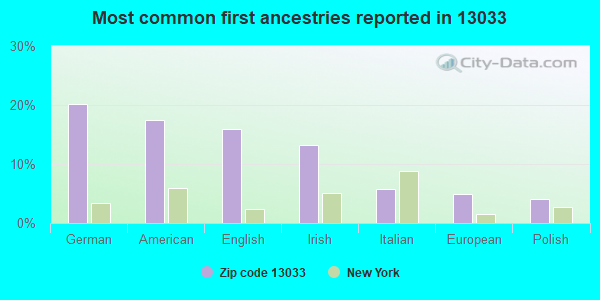
20%German
18%American
16%English
13%Irish
6%Italian
5%European
4%Polish
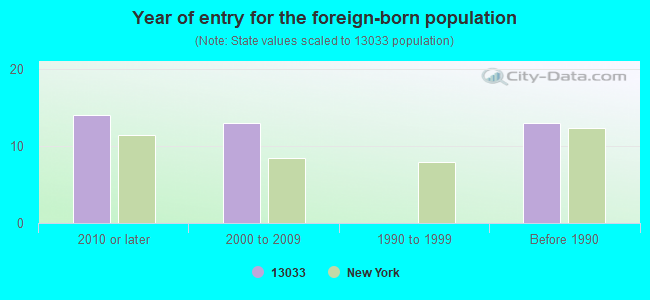
Year of entry for the foreign-born population
142010 or later
132000 to 2009
01990 to 1999
13Before 1990
Facilities with environmental interests located in this zip code:
EDWARD E PRIMOSE FARM (10765 COOPER STREET in CATO, NY)
STATE MASTER (New York facility tracking) - National Pollutant Discharge Elimination System Permit National Pollutant Discharge Elimination System NON-MAJOR (Tracking pollutant discharge elimination systems) - permit Business SIC classification: GENERAL FARMS, PRIMARILY LIVESTOCK AND ANIMAL SPECIALTIES Organizations: EDWARD E. PRIMROSE (CONTACT/OWNER)
Alternative names: EDWARD E. PRIMOSE, EDWARD J. PRIMROSE
CATO-MERIDIAN CENTRAL SCHOOL (2851 RTE 370 EAST in CATO, NY)
STATE MASTER (New York facility tracking) - National Pollutant Discharge Elimination System Permit, (Resource Conservation and Recovery Act (tracking hazardous waste)) Business SIC classification: SERVICES Organizations: CATO-MERIDIAN CTL SCH DIST (LEGALLY RESPONSIBLE PARTY)
CATO-MERIDIAN ES ( in CATO, NY)
(National Center for Education Statistics) - STATE ID-050401040001 Organizations: CATO-MERIDIAN CSD (SCHOOL DISTRICT)
CATO-MERIDIAN MS ( in CATO, NY)
(National Center for Education Statistics) - STATE ID-050401040002 Organizations: CATO-MERIDIAN CSD (SCHOOL DISTRICT)
CATO-MERIDIAN SHS ( in CATO, NY)
(National Center for Education Statistics) - STATE ID-050401040003 Organizations: CATO-MERIDIAN CSD (SCHOOL DISTRICT)
FARMERS HOME ADMIN DRICE PROPERTY (3140 DALTON RD in CATO, NY) . Federal Facility. DEPARTMENT OF AGRICULTURE
(Resource Conservation and Recovery Act (tracking hazardous waste))
CATO SHOW PRINTING CO INC (2562 E MAIN ST in CATO, NY)
(Resource Conservation and Recovery Act (tracking hazardous waste)) Business NAICS classification: COMMERCIAL LITHOGRAPHIC PRINTING.
CAYUGA COUNTY HIGHWAY DEPT (IRA HILL RD in CATO, NY)
(Resource Conservation and Recovery Act (tracking hazardous waste))
CATO PUMP & WELL DRILLING INC (13104 SOUTH ST in CATO, NY)
TRANSPORTER (Resource Conservation and Recovery Act (tracking hazardous waste)) - notification Organizations: THOMAS & DIANNE BEGLEY (CONTACT/OWNER)
BART TRANSPORTATION, INC. (12000 SOUTHARD ROAD in CATO, NY)
ENFORCEMENT/COMPLIANCE ACTIVITY (Integrated Compliance Information System)
Housing units lacking complete plumbing facilities: 1.7% Housing units lacking complete kitchen facilities: 0.3%
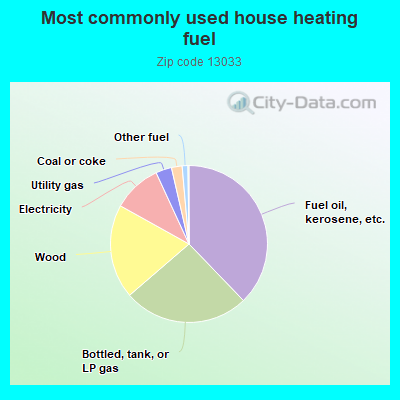
38.0%Fuel oil, kerosene, etc.
26.0%Bottled, tank, or LP gas
19.5%Wood
10.1%Electricity
3.3%Utility gas
2.2%Coal or coke
1.2%Other fuel
Population in 1990: 3,873. Population change in the 1990s: +671 (+17.3%).
Place of birth for U.S.-born residents:
This state: 3,164
Northeast: 108
Midwest: 50
South: 168
West: 56
70% of the 13033 zip code residents lived in the same house 5 years ago. Out of people who lived in different houses, 56% lived in this county. Out of people who lived in different counties, 50% lived in New York.
95% of the 13033 zip code residents lived in the same house 1 year ago. Out of people who lived in different houses, 50% moved from this county. Out of people who lived in different houses, 48% moved from different county within same state.
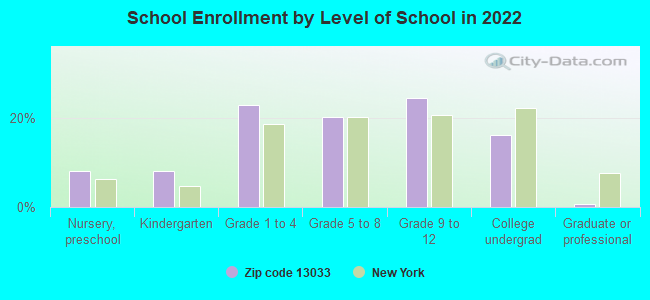
Private vs. public school enrollment:
Students in private schools in grades 1 to 8 (elementary and middle school): 37
Here:
10.0%
New York:
15.6%
Students in private schools in grades 9 to 12 (high school): 10
Here:
4.8%
New York:
15.0%
Students in private undergraduate colleges: 29
Here:
20.8%
New York:
39.2%
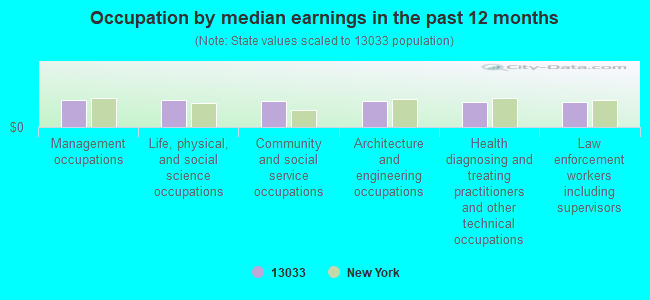
Occupation by median earnings in the past 12 months ($)
74,489Management occupations
73,390Life, physical, and social science occupations
71,778Community and social service occupations
71,200Architecture and engineering occupations
69,600Health diagnosing and treating practitioners and other technical occupations
68,482Law enforcement workers including supervisors
Companies with federal contracts located in this zip code:
INCREDA-MEAL INC (RR 34 in CATO, NY; small business)
$145,233 with Army for Bakery and Cereal Products. Signed on 2000-02-02. Completion date: 2000-03-28.
Top industries in this zip code by the number of employees in 2005:
2002 - 2018 National Fire Incident Reporting System (NFIRS) incidents
According to the data from the years 2002 - 2018 the average number of fires per year is 22. The highest number of fires - 45 took place in 2002, and the least - 9 in 2004. The data has a declining trend.
When looking into fire subcategories, the most reports belonged to: Structure Fires (58.5%), and Outside Fires (17.6%).
Fire incident types reported to NFIRS in Zip Code 13033
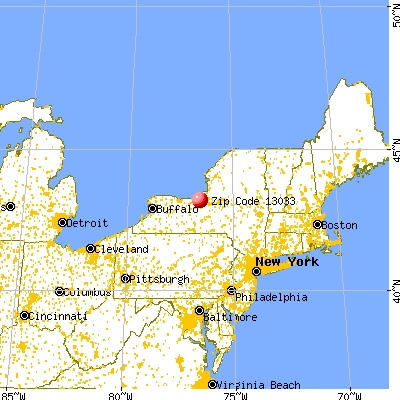


 Nearest zip codes: 13113, 13111, 13166, 13080, 13074, 13140.


 According to the data from the years 2002 - 2018 the average number of fires per year is 22. The highest number of fires - 45 took place in 2002, and the least - 9 in 2004. The data has a declining trend.
 When looking into fire subcategories, the most reports belonged to: Structure Fires (58.5%), and Outside Fires (17.6%).