Estimated zip code population in 2022: 2,134 Zip code population in 2010: 2,000 Zip code population in 2000: 2,313
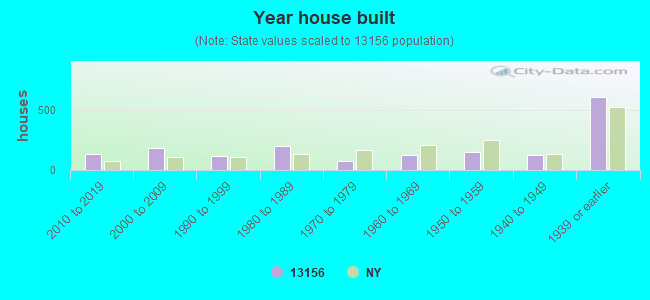
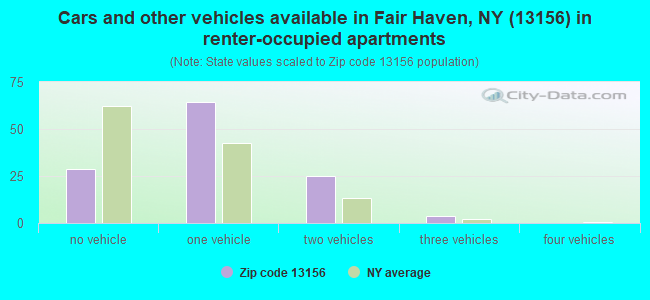
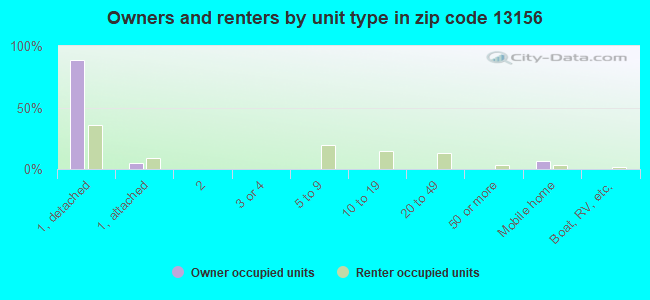
Houses and condos: 1,701 Renter-occupied apartments: 121
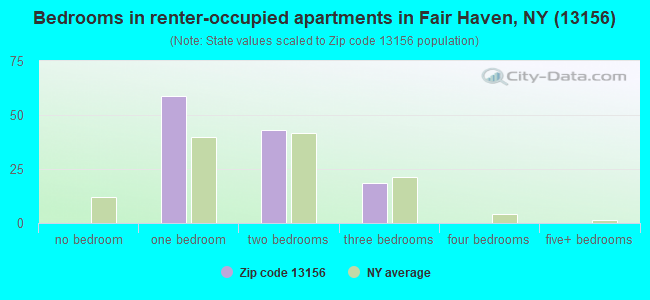
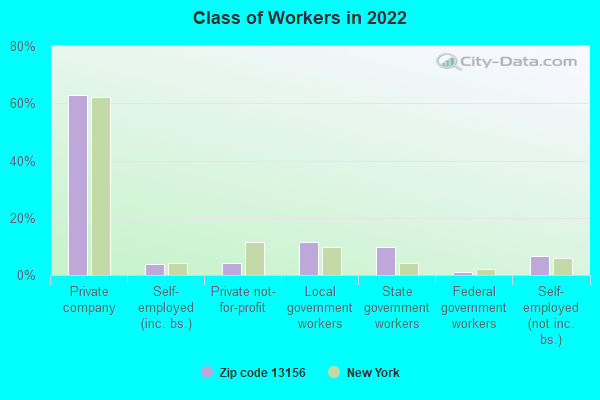
% of renters here:
12%
State:
46%
March 2022 cost of living index in zip code 13156: 93.7 (less than average, U.S. average is 100)
Land area: 30.0 sq. mi. Water area: 1.2 sq. mi.
Population density: 71 people per square mile
(very low).
OSM Map
General Map
Google Map
MSN Map
OSM Map
General Map
Google Map
MSN Map
OSM Map
General Map
Google Map
MSN Map
OSM Map
General Map
Google Map
MSN Map
Please wait while loading the map...
Real estate property taxes paid for housing units in 2022:
This zip code:
1.6% ($2,527)
New York:
1.5% ($6,180)
Median real estate property taxes paid for housing units with mortgages in 2022: $2,350 (1.5%) Median real estate property taxes paid for housing units with no mortgage in 2022: $3,316 (2.4%)
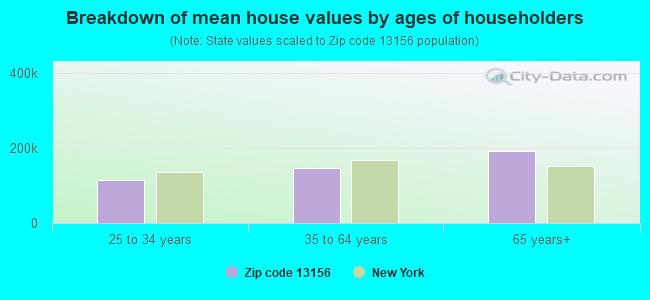
Estimated median house/condo value in 2022: $156,366
13156:
$156,366
New York:
$400,400
According to our research of New York and other state lists, there were 2 registered sex offenders living in 13156 zip code as of April 27, 2024. The ratio of all residents to sex offenders in zip code 13156 is 1,132 to 1. The ratio of registered sex offenders to all residents in this zip code is near the state average.
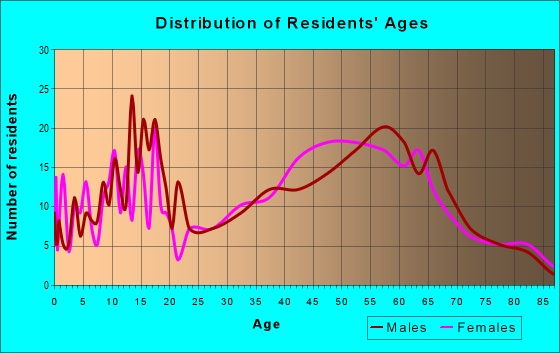
Median resident age:
This zip code:
56.3 years
New York median age:
40.0 years
Average household size:
This zip code:
2.1 people
New York:
2.5 people
Averages for the 2020 tax year for zip code 13156, filed in 2021:
Average Adjusted Gross Income (AGI) in 2020: $61,399 (Individual Income Tax Returns)
Here:
$61,399
State:
$90,930
Salary/wage: $56,948 (reported on 76.7% of returns)
Here:
$56,948
State:
$72,104
(% of AGI for various income ranges: 1126.5% for AGIs below $25k, 3749.4% for AGIs $25k-50k, 6291.0% for AGIs $50k-75k, 8875.7% for AGIs $75k-100k, 14586.0% for AGIs $100k-200k)
Taxable interest for individuals: $564 (reported on 40.0% of returns)
This zip code:
$564
New York:
$3,075
(% of AGI for various income ranges: 30.6% for AGIs below $25k, 11.9% for AGIs $25k-50k, 26.0% for AGIs $50k-75k, 42.9% for AGIs $75k-100k, 54.0% for AGIs $100k-200k)
Ordinary dividends: $2,053 (reported on 21.1% of returns)
Here:
$2,053
State:
$11,095
(% of AGI for various income ranges: 20.6% for AGIs below $25k, 46.2% for AGIs $25k-50k, 43.0% for AGIs $50k-75k, 125.7% for AGIs $75k-100k, 150.0% for AGIs $100k-200k)
Net capital gain/loss in AGI: +$4,300 (reported on 16.7% of returns)
Here:
+$4,300
State:
+$44,925
(% of AGI for various income ranges: 9.4% for AGIs below $25k, 63.1% for AGIs $25k-50k, 115.0% for AGIs $50k-75k, 413.0% for AGIs $100k-200k)
Profit/loss from business: +$5,375 (reported on 13.3% of returns)
Here:
+$5,375
State:
+$14,940
(% of AGI for various income ranges: 84.1% for AGIs below $25k, 116.9% for AGIs $25k-50k, 291.4% for AGIs $75k-100k, 111.0% for AGIs $100k-200k)
Taxable individual retirement arrangement distribution: $19,600 (reported on 11.1% of returns)
13156:
$19,600
New York:
$19,609
(% of AGI for various income ranges: 60.0% for AGIs below $25k, 246.2% for AGIs $25k-50k, 532.0% for AGIs $50k-75k, 932.0% for AGIs $100k-200k)
Total itemized deductions: $23,133 (reported on 3.3% of returns)
Here:
$23,133
State:
$39,326
(% of AGI for various income ranges: 694.0% for AGIs $100k-200k)
Taxes paid: $9,400 (reported on 3.3% of returns)
13156:
$9,400
State:
$9,183
(% of AGI for various income ranges: 282.0% for AGIs $100k-200k)
Earned income credit: $2,230 (reported on 11.1% of returns)
Here:
$2,230
State:
$2,138
(% of AGI for various income ranges: 78.8% for AGIs below $25k, 55.6% for AGIs $25k-50k)
Percentage of individuals using paid preparers for their 2020 taxes: 96.7%
Here:
97%
State:
95%
(% for various income ranges: 92.3% for AGIs below $25k, 95.5% for AGIs $25k-50k, 100.0% for AGIs $50k-75k, 100.0% for AGIs $75k-100k, 100.0% for AGIs $100k-200k, 100.0% for AGIs over 200k)
Averages for the 2012 tax year for zip code 13156, filed in 2013:
Average Adjusted Gross Income (AGI) in 2012: $47,837 (Individual Income Tax Returns)
Here:
$47,837
State:
$77,088
Salary/wage: $41,898 (reported on 84.6% of returns)
Here:
$41,898
State:
$60,593
(% of AGI for various income ranges: 67.0% for AGIs below $25k, 74.5% for AGIs $25k-50k, 74.2% for AGIs $50k-75k, 77.5% for AGIs $75k-100k, 74.1% for AGIs $100k-200k)
Taxable interest for individuals: $367 (reported on 42.3% of returns)
This zip code:
$367
New York:
$3,125
(% of AGI for various income ranges: 0.6% for AGIs below $25k, 0.6% for AGIs $25k-50k, 0.3% for AGIs $50k-75k, 0.3% for AGIs $75k-100k, 0.1% for AGIs $100k-200k)
Ordinary dividends: $1,640 (reported on 19.2% of returns)
Here:
$1,640
State:
$10,299
(% of AGI for various income ranges: 1.2% for AGIs below $25k, 0.8% for AGIs $25k-50k, 0.5% for AGIs $50k-75k, 1.1% for AGIs $75k-100k, 0.3% for AGIs $100k-200k)
Net capital gain/loss in AGI: +$418 (reported on 14.1% of returns)
Here:
+$418
State:
+$42,474
(% of AGI for various income ranges: 0.4% for AGIs $25k-50k, 0.5% for AGIs $75k-100k)
Profit/loss from business: +$4,890 (reported on 12.8% of returns)
Here:
+$4,890
State:
+$16,168
(% of AGI for various income ranges: 8.6% for AGIs below $25k, 0.4% for AGIs $50k-75k, 1.9% for AGIs $75k-100k)
Taxable individual retirement arrangement distribution: $12,680 (reported on 12.8% of returns)
13156:
$12,680
New York:
$17,621
(% of AGI for various income ranges: 3.3% for AGIs below $25k, 5.0% for AGIs $25k-50k, 9.6% for AGIs $50k-75k)
Total itemized deductions: $18,248 (22% of AGI, reported on 26.9% of returns)
Here:
$18,248
State:
$34,985
Here:
22.1% of AGI
State:
21.3% of AGI
(% of AGI for various income ranges: 9.6% for AGIs below $25k, 7.2% for AGIs $25k-50k, 10.1% for AGIs $50k-75k, 8.1% for AGIs $75k-100k, 13.7% for AGIs $100k-200k)
Charity contributions: $2,538 (reported on 20.5% of returns)
Here:
$2,538
State:
$5,572
(% of AGI for various income ranges: 1.7% for AGIs below $25k, 1.1% for AGIs $50k-75k, 1.2% for AGIs $75k-100k, 1.5% for AGIs $100k-200k)
Taxes paid: $8,248 (reported on 26.9% of returns)
13156:
$8,248
State:
$18,656
(% of AGI for various income ranges: 3.4% for AGIs below $25k, 2.8% for AGIs $25k-50k, 4.1% for AGIs $50k-75k, 3.6% for AGIs $75k-100k, 7.1% for AGIs $100k-200k)
Earned income credit: $1,983 (reported on 15.4% of returns)
Here:
$1,983
State:
$2,230
(% of AGI for various income ranges: 4.3% for AGIs below $25k, 1.2% for AGIs $25k-50k)
Percentage of individuals using paid preparers for their 2012 taxes: 59.0%
Here:
59%
State:
66%
(% for various income ranges: 50.0% for AGIs below $25k, 55.6% for AGIs $25k-50k, 71.4% for AGIs $50k-75k, 75.0% for AGIs $75k-100k, 62.5% for AGIs $100k-200k)
Averages for the 2004 tax year for zip code 13156, filed in 2005:
Average Adjusted Gross Income (AGI) in 2004: $36,738 (Individual Income Tax Returns)
Here:
$36,738
State:
$59,519
Salary/wage: $35,294 (reported on 84.4% of returns)
Here:
$35,294
State:
$50,673
(% of AGI for various income ranges: 119.3% for AGIs below $10k, 67.6% for AGIs $10k-25k, 80.4% for AGIs $25k-50k, 81.0% for AGIs $50k-75k, 80.0% for AGIs $75k-100k, 89.5% for AGIs over 100k)
Taxable interest for individuals: $743 (reported on 48.9% of returns)
This zip code:
$743
New York:
$2,377
(% of AGI for various income ranges: 5.0% for AGIs below $10k, 3.1% for AGIs $10k-25k, 0.6% for AGIs $25k-50k, 0.7% for AGIs $50k-75k, 0.5% for AGIs $75k-100k, 0.5% for AGIs over 100k)
Taxable dividends: $1,123 (reported on 21.6% of returns)
Here:
$1,123
State:
$5,394
(% of AGI for various income ranges: 1.9% for AGIs below $10k, 1.4% for AGIs $10k-25k, 0.8% for AGIs $25k-50k, 0.7% for AGIs $50k-75k, 0.2% for AGIs $75k-100k, 0.2% for AGIs over 100k)
Net capital gain/loss: +$184 (reported on 13.6% of returns)
Here:
+$184
State:
+$23,581
(% of AGI for various income ranges: 1.1% for AGIs below $10k, -0.2% for AGIs $10k-25k, 0.2% for AGIs $25k-50k, -0.1% for AGIs $50k-75k, 0.2% for AGIs $75k-100k, 0.0% for AGIs over 100k)
Profit/loss from business: +$2,970 (reported on 13.1% of returns)
Here:
+$2,970
State:
+$13,809
(% of AGI for various income ranges: 1.1% for AGIs below $10k, 3.7% for AGIs $10k-25k, 1.0% for AGIs $25k-50k, 1.5% for AGIs $50k-75k, -0.3% for AGIs $75k-100k)
Total itemized deductions: $15,087 (23% of AGI, reported on 27.3% of returns)
Here:
$15,087
State:
$25,864
Here:
22.9% of AGI
State:
21.9% of AGI
(% of AGI for various income ranges: 7.9% for AGIs $10k-25k, 10.5% for AGIs $25k-50k, 10.4% for AGIs $50k-75k, 12.3% for AGIs $75k-100k, 16.6% for AGIs over 100k)
Charity contributions deductions: $2,267 (3% of AGI, reported on 23.8% of returns)
Here:
$2,267
State:
$4,439
Here:
3.3% of AGI
State:
3.6% of AGI
(% of AGI for various income ranges: 1.0% for AGIs $10k-25k, 1.2% for AGIs $25k-50k, 1.4% for AGIs $50k-75k, 1.5% for AGIs $75k-100k, 2.5% for AGIs over 100k)
Total tax: $4,279 (reported on 73.5% of returns)
13156:
$4,279
State:
$11,730
(% of AGI for various income ranges: 3.9% for AGIs below $10k, 3.7% for AGIs $10k-25k, 6.0% for AGIs $25k-50k, 8.5% for AGIs $50k-75k, 10.4% for AGIs $75k-100k, 14.7% for AGIs over 100k)
Earned income credit: $1,661 (reported on 16.8% of returns)
Here:
$1,661
State:
$1,757
Percentage of individuals using paid preparers for their 2004 taxes: 63.8%
Here:
64%
State:
67%
(% for various income ranges: 59.6% for AGIs below $10k, 61.3% for AGIs $10k-25k, 63.1% for AGIs $25k-50k, 68.0% for AGIs $50k-75k, 66.7% for AGIs $75k-100k, 81.8% for AGIs over 100k)
Household received Food Stamps/SNAP in the past 12 months: 155 Household did not receive Food Stamps/SNAP in the past 12 months: 847
Women who had a birth in the past 12 months: 39 (27 now married, 12 unmarried) Women who did not have a birth in the past 12 months: 330 (115 now married, 214 unmarried)
Housing units in zip code 13156 with a mortgage: 508 (61 second mortgage, 61 both second mortgage and home equity loan) Houses without a mortgage: 104
Median monthly owner costs for units with a mortgage: $1,070 Median monthly owner costs for units without a mortgage: $765
Residents with income below the poverty level in 2022:
This zip code:
6.7%
Whole state:
14.3%
Residents with income below 50% of the poverty level in 2022:
This zip code:
3.7%
Whole state:
6.8%
Median number of rooms in houses and condos:
Here:
6.1
State:
6.3
Median number of rooms in apartments:
Here:
4.5
State:
3.8
Notable locations in this zip code not listed on our city pages
In group quarters: 10 (-1 institutionalized population)
Size of family households: 445 2-persons, 49 3-persons, 108 4-persons, 16 5-persons, 35 6-persons
Size of nonfamily households: 274 1-person, 81 2-persons
198 married couples with children.
40 single-parent households (40 women).
96.0% of residents of 13156 zip code speak English at home.
4.5% of residents speak other Indo-European language at home (52% very well, 48% well).
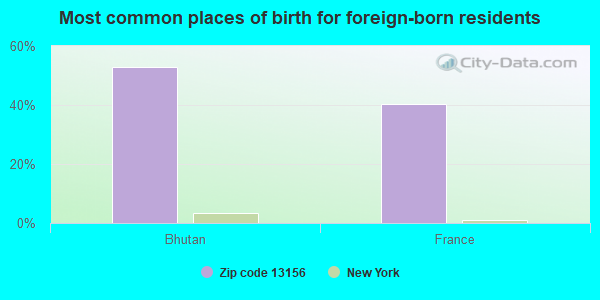
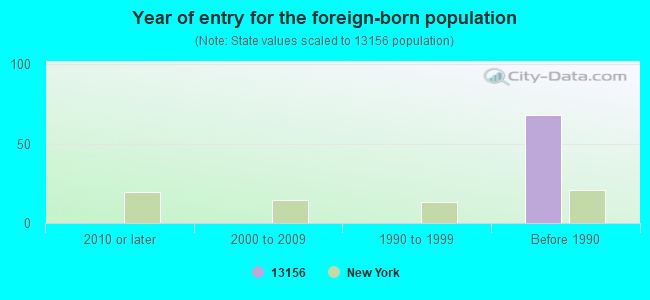
Foreign born population: 73 (3.5%) (100.0% of them are naturalized citizens)
This zip code:
3.5%
Whole state:
22.7%
53%Bhutan
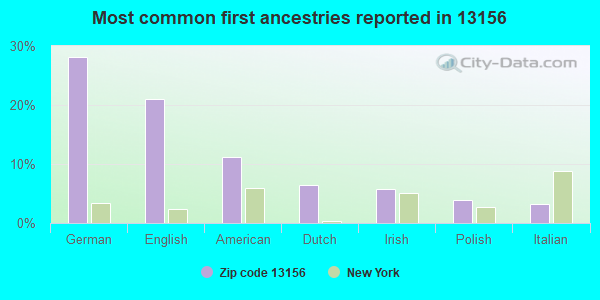
40%France
28%German
21%English
11%American
6%Dutch
6%Irish
4%Polish
3%Italian
Year of entry for the foreign-born population
02010 or later
02000 to 2009
01990 to 1999
68Before 1990
Housing units lacking complete plumbing facilities: 3.3% Housing units lacking complete kitchen facilities: 3.9%
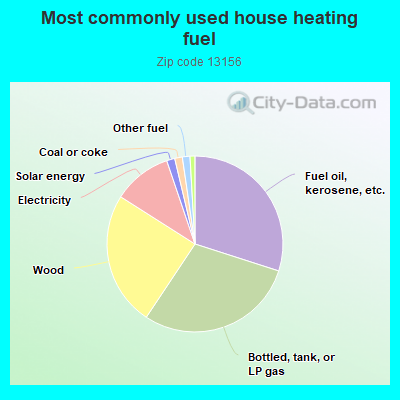
30.0%Fuel oil, kerosene, etc.
29.4%Bottled, tank, or LP gas
24.7%Wood
10.8%Electricity
1.5%Solar energy
1.4%Coal or coke
1.4%Other fuel
0.9%Utility gas
Population in 1990: 2,252. Population change in the 1990s: +61 (+2.7%).
Place of birth for U.S.-born residents:
This state: 1,756
Northeast: 168
Midwest: 48
South: 70
West: 10
66% of the 13156 zip code residents lived in the same house 5 years ago. Out of people who lived in different houses, 44% lived in this county. Out of people who lived in different counties, 50% lived in New York.
97% of the 13156 zip code residents lived in the same house 1 year ago. Out of people who lived in different houses, 22% moved from this county. Out of people who lived in different houses, 57% moved from different county within same state. Out of people who lived in different houses, 14% moved from different state.
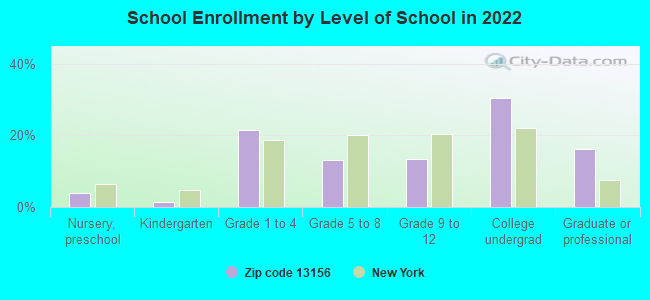
Private vs. public school enrollment:
Students in private schools in grades 1 to 8 (elementary and middle school): 14
Here:
13.1%
New York:
15.6%
Students in private schools in grades 9 to 12 (high school): 2
Here:
4.9%
New York:
15.0%
Students in private undergraduate colleges: 3
Here:
4.3%
New York:
39.2%
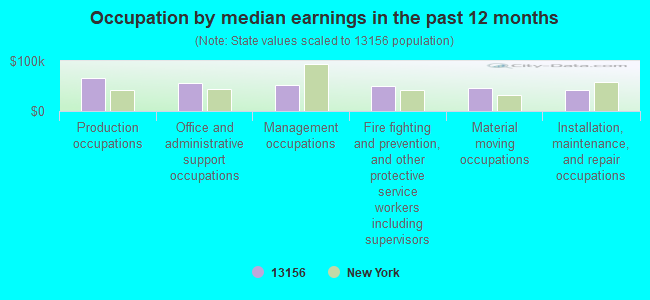
Occupation by median earnings in the past 12 months ($)
66,817Production occupations
55,772Office and administrative support occupations
52,946Management occupations
49,605Fire fighting and prevention, and other protective service workers including supervisors
46,134Material moving occupations
41,868Installation, maintenance, and repair occupations
Top industries in this zip code by the number of employees in 2005:
Administrative and Support and Waste Management and Remediation Services: Office Administrative Services (20-49 employees: 1 establishment)
Arts, Entertainment, and Recreation: Promoters of Performing Arts, Sports, and Similar Events without Facilities (5-9: 1)
Construction: Siding Contractors (5-9: 1)
Construction: New Single-Family Housing Construction (except Operative Builders) (1-4: 3)
Construction: Site Preparation Contractors (1-4: 2)
Wholesale Trade: Sporting and Recreational Goods and Supplies Merchant Wholesalers (1-4: 2)
Accommodation and Food Services: Food Service Contractors (1-4: 1)
Other Services (except Public Administration): General Automotive Repair (1-4: 1)
Administrative and Support and Waste Management and Remediation Services: All Other Miscellaneous Waste Management Services (1-4: 1)
Other Services (except Public Administration): Cemeteries and Crematories (1-4: 1)
People in group quarters in 2000:
4 people in other group homes
Home Mortgage Disclosure Act Aggregated Statistics For Year 2003 (Based on 2 partial tracts)
A) FHA, FSA/RHS & VA Home Purchase Loans
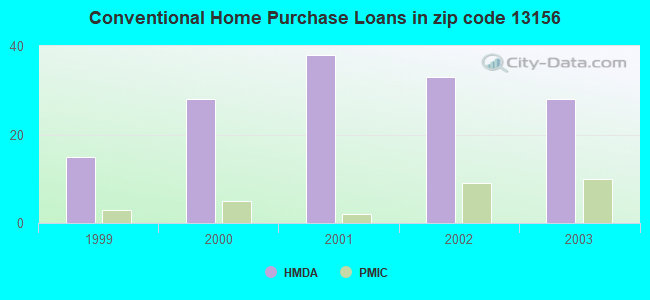
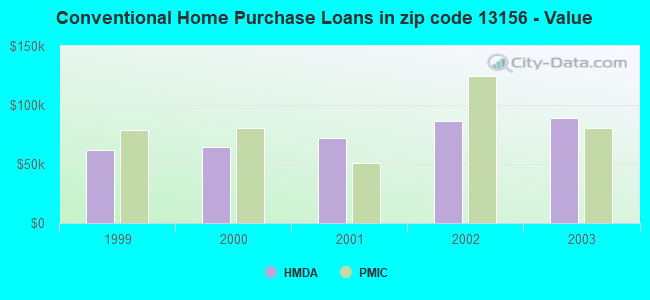
B) Conventional Home Purchase Loans
C) Refinancings
D) Home Improvement Loans
F) Non-occupant Loans on < 5 Family Dwellings (A B C & D)
Number
Average Value
Number
Average Value
Number
Average Value
Number
Average Value
Number
Average Value
LOANS ORIGINATED
5
$86,552
28
$88,601
96
$73,138
28
$12,838
8
$103,850
APPLICATIONS APPROVED, NOT ACCEPTED
1
$109,540
7
$87,279
18
$66,212
7
$16,420
1
$111,850
APPLICATIONS DENIED
1
$52,460
13
$64,323
50
$62,946
23
$12,510
1
$23,140
APPLICATIONS WITHDRAWN
0
$0
1
$8,490
56
$77,429
2
$62,485
1
$50,140
FILES CLOSED FOR INCOMPLETENESS
0
$0
0
$0
4
$68,848
1
$20,060
0
$0
Aggregated Statistics For Year 2002 (Based on 2 partial tracts)
A) FHA, FSA/RHS & VA Home Purchase Loans
B) Conventional Home Purchase Loans
C) Refinancings
D) Home Improvement Loans
F) Non-occupant Loans on < 5 Family Dwellings (A B C & D)
Number
Average Value
Number
Average Value
Number
Average Value
Number
Average Value
Number
Average Value
LOANS ORIGINATED
12
$62,227
33
$86,444
69
$69,963
22
$8,731
6
$80,740
APPLICATIONS APPROVED, NOT ACCEPTED
1
$30,860
0
$0
13
$67,052
7
$19,064
1
$64,800
APPLICATIONS DENIED
2
$34,715
17
$53,589
62
$63,865
16
$15,814
5
$60,940
APPLICATIONS WITHDRAWN
2
$65,570
5
$78,992
32
$68,076
3
$19,800
2
$127,280
FILES CLOSED FOR INCOMPLETENESS
1
$41,660
1
$40,110
7
$68,434
0
$0
0
$0
Aggregated Statistics For Year 2001 (Based on 2 partial tracts)
A) FHA, FSA/RHS & VA Home Purchase Loans
B) Conventional Home Purchase Loans
C) Refinancings
D) Home Improvement Loans
F) Non-occupant Loans on < 5 Family Dwellings (A B C & D)
Number
Average Value
Number
Average Value
Number
Average Value
Number
Average Value
Number
Average Value
LOANS ORIGINATED
7
$65,459
38
$71,842
60
$67,729
25
$14,533
12
$70,840
APPLICATIONS APPROVED, NOT ACCEPTED
0
$0
15
$62,586
12
$66,469
1
$1,540
1
$71,740
APPLICATIONS DENIED
0
$0
27
$59,941
69
$55,910
22
$14,166
5
$39,958
APPLICATIONS WITHDRAWN
2
$66,340
5
$69,888
25
$63,409
8
$24,589
3
$45,513
FILES CLOSED FOR INCOMPLETENESS
0
$0
0
$0
3
$41,913
1
$10,030
0
$0
Aggregated Statistics For Year 2000 (Based on 2 partial tracts)
A) FHA, FSA/RHS & VA Home Purchase Loans
B) Conventional Home Purchase Loans
C) Refinancings
D) Home Improvement Loans
F) Non-occupant Loans on < 5 Family Dwellings (A B C & D)
Number
Average Value
Number
Average Value
Number
Average Value
Number
Average Value
Number
Average Value
LOANS ORIGINATED
9
$54,341
28
$64,632
24
$52,102
27
$18,571
5
$61,866
APPLICATIONS APPROVED, NOT ACCEPTED
1
$37,030
18
$47,098
12
$58,498
8
$10,992
2
$29,700
APPLICATIONS DENIED
0
$0
42
$44,851
49
$48,913
19
$25,741
1
$47,060
APPLICATIONS WITHDRAWN
0
$0
7
$71,189
19
$53,064
2
$25,070
0
$0
FILES CLOSED FOR INCOMPLETENESS
0
$0
0
$0
2
$64,410
2
$17,355
1
$43,200
Aggregated Statistics For Year 1999 (Based on 1 partial tract)
A) FHA, FSA/RHS & VA Home Purchase Loans
B) Conventional Home Purchase Loans
C) Refinancings
D) Home Improvement Loans
F) Non-occupant Loans on < 5 Family Dwellings (A B C & D)


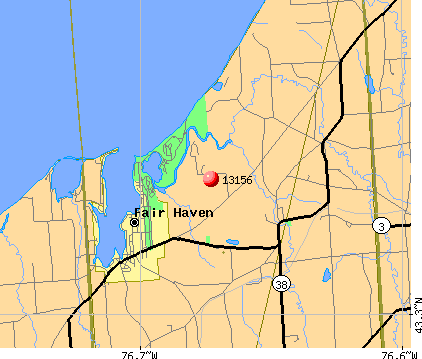 Nearest zip codes: 13064, 13111, 13143, 13074, 13033, 14590.