Estimated zip code population in 2022: 2,226 Zip code population in 2010: 2,027 Zip code population in 2000: 1,856
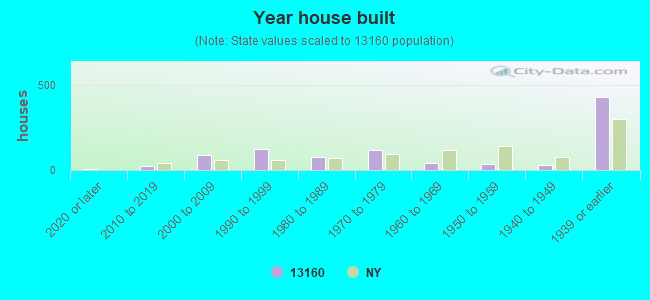
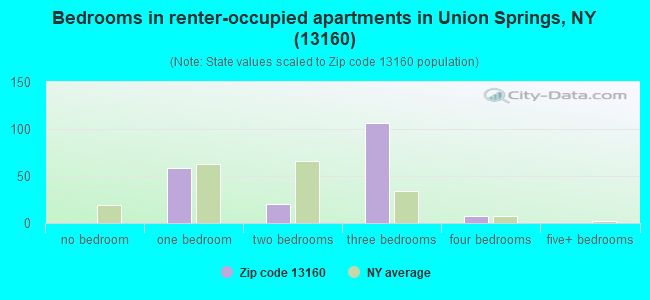
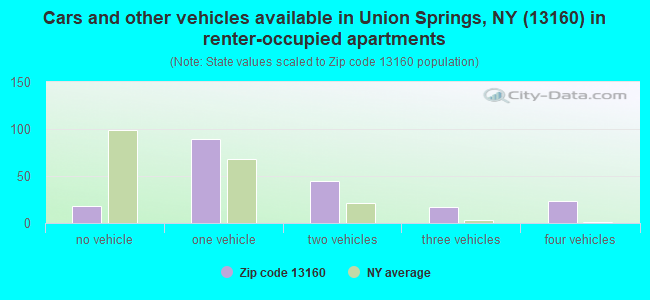
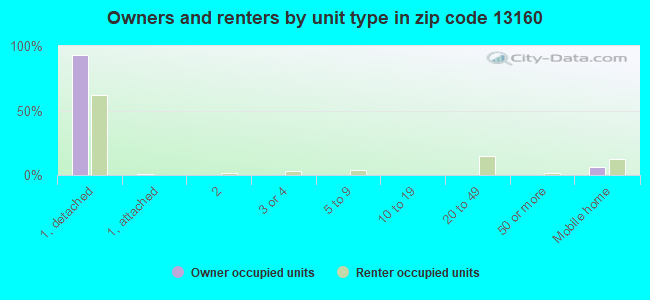
Houses and condos: 979 Renter-occupied apartments: 191
% of renters here:
23%
State:
46%
March 2022 cost of living index in zip code 13160: 94.3 (less than average, U.S. average is 100)
Land area: 21.3 sq. mi. Water area: 0.0 sq. mi.
Population density: 105 people per square mile
(very low).
OSM Map
General Map
Google Map
MSN Map
OSM Map
General Map
Google Map
MSN Map
OSM Map
General Map
Google Map
MSN Map
OSM Map
General Map
Google Map
MSN Map
Please wait while loading the map...
Real estate property taxes paid for housing units in 2022:
This zip code:
2.1% ($3,524)
New York:
1.5% ($6,180)
Median real estate property taxes paid for housing units with mortgages in 2022: $3,665 (2.1%) Median real estate property taxes paid for housing units with no mortgage in 2022: $3,267 (1.9%)
Business Search- 14 Million verified businesses
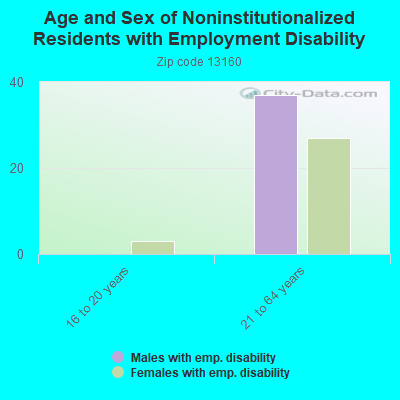
Males: 1,127
(50.6%)
Females: 1,098
(49.4%)
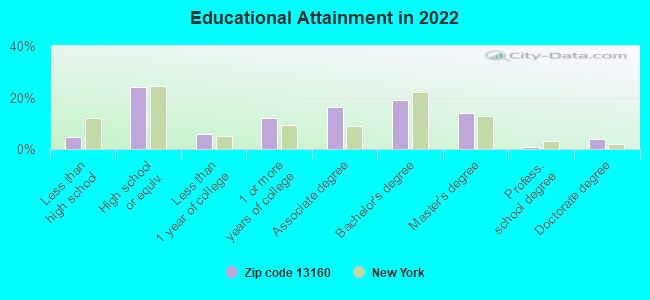
For population 25 years and over in 13160:
High school or higher: 94.8%
Bachelor's degree or higher: 37.0%
Graduate or professional degree: 18.3%
Unemployed: 3.7%
Mean travel time to work (commute): 21.1 minutes
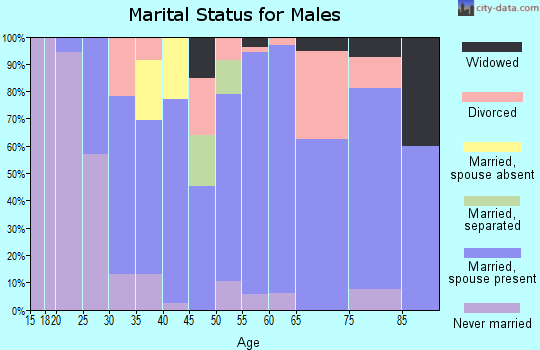
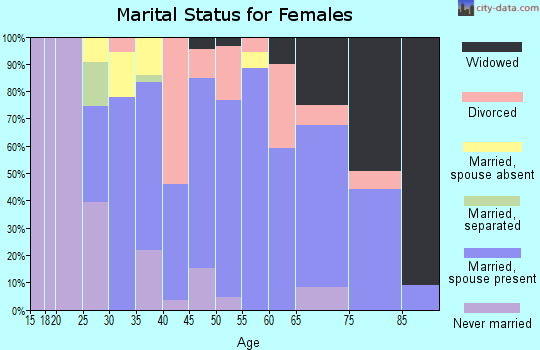
For population 15 years and over in 13160:
Never married: 29.7%
Now married: 53.6%
Separated: 2.1%
Widowed: 6.1%
Divorced: 8.5%
Zip code 13160 compared to state average:
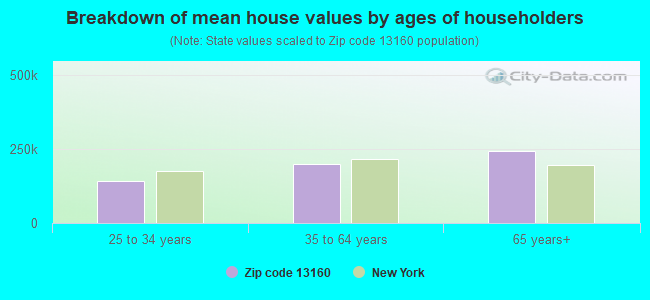
Median house value significantly below state average.
Black race population percentage significantly below state average.
Hispanic race population percentage significantly below state average.
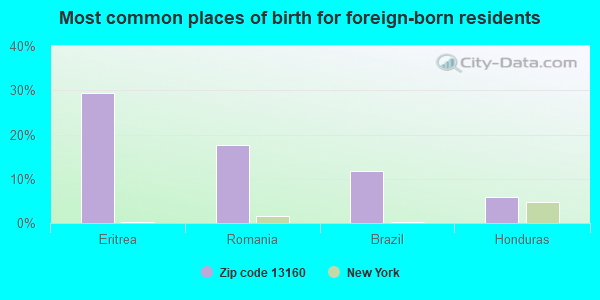
Foreign-born population percentage significantly below state average.
Renting percentage below state average.
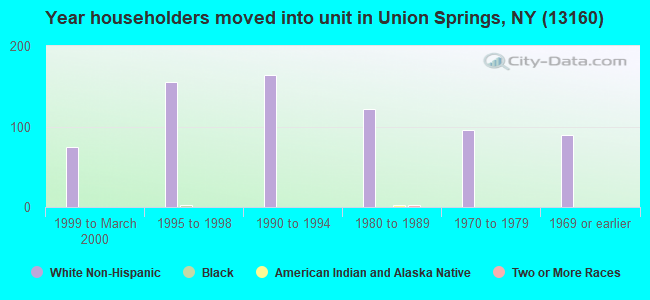
Length of stay since moving in significantly above state average.
Estimated median house/condo value in 2022: $170,855
13160:
$170,855
New York:
$400,400
According to our research of New York and other state lists, there were 2 registered sex offenders living in 13160 zip code as of May 05, 2024. The ratio of all residents to sex offenders in zip code 13160 is 993 to 1. The ratio of registered sex offenders to all residents in this zip code is near the state average.
Median resident age:
This zip code:
43.3 years
New York median age:
40.0 years
Average household size:
This zip code:
2.7 people
New York:
2.5 people
Averages for the 2020 tax year for zip code 13160, filed in 2021:
Average Adjusted Gross Income (AGI) in 2020: $61,067 (Individual Income Tax Returns)
Here:
$61,067
State:
$90,930
Salary/wage: $49,891 (reported on 79.8% of returns)
Here:
$49,891
State:
$72,104
(% of AGI for various income ranges: 1062.9% for AGIs below $25k, 3511.0% for AGIs $25k-50k, 6682.7% for AGIs $50k-75k, 8597.1% for AGIs $75k-100k, 14547.5% for AGIs $100k-200k)
Taxable interest for individuals: $882 (reported on 41.5% of returns)
This zip code:
$882
New York:
$3,075
(% of AGI for various income ranges: 27.1% for AGIs below $25k, 20.0% for AGIs $25k-50k, 71.8% for AGIs $50k-75k, 32.9% for AGIs $75k-100k, 192.5% for AGIs $100k-200k)
Ordinary dividends: $3,045 (reported on 21.3% of returns)
Here:
$3,045
State:
$11,095
(% of AGI for various income ranges: 24.1% for AGIs below $25k, 13.3% for AGIs $25k-50k, 92.7% for AGIs $50k-75k, 54.3% for AGIs $75k-100k, 500.0% for AGIs $100k-200k)
Net capital gain/loss in AGI: +$11,500 (reported on 16.0% of returns)
Here:
+$11,500
State:
+$44,925
(% of AGI for various income ranges: 12.4% for AGIs below $25k, 162.7% for AGIs $50k-75k, 1906.2% for AGIs $100k-200k)
Profit/loss from business: +$8,708 (reported on 12.8% of returns)
Here:
+$8,708
State:
+$14,940
(% of AGI for various income ranges: 128.2% for AGIs below $25k, 82.9% for AGIs $25k-50k, 340.9% for AGIs $50k-75k, 347.5% for AGIs $100k-200k)
Taxable individual retirement arrangement distribution: $18,033 (reported on 12.8% of returns)
13160:
$18,033
New York:
$19,609
(% of AGI for various income ranges: 214.7% for AGIs below $25k, 569.1% for AGIs $50k-75k, 1466.2% for AGIs $100k-200k)
Total itemized deductions: $26,000 (reported on 4.3% of returns)
Here:
$26,000
State:
$39,326
(% of AGI for various income ranges: 1485.7% for AGIs $75k-100k)
Charity contributions: $7,833 (reported on 3.2% of returns)
Here:
$7,833
State:
$15,420
(% of AGI for various income ranges: 213.6% for AGIs $50k-75k)
Taxes paid: $7,050 (reported on 4.3% of returns)
13160:
$7,050
State:
$9,183
(% of AGI for various income ranges: 402.9% for AGIs $75k-100k)
Earned income credit: $2,291 (reported on 11.7% of returns)
Here:
$2,291
State:
$2,138
(% of AGI for various income ranges: 74.7% for AGIs below $25k, 59.5% for AGIs $25k-50k)
Percentage of individuals using paid preparers for their 2020 taxes: 96.8%
Here:
97%
State:
95%
(% for various income ranges: 92.3% for AGIs below $25k, 96.3% for AGIs $25k-50k, 100.0% for AGIs $50k-75k, 100.0% for AGIs $75k-100k, 100.0% for AGIs $100k-200k, 100.0% for AGIs over 200k)
Averages for the 2012 tax year for zip code 13160, filed in 2013:
Average Adjusted Gross Income (AGI) in 2012: $57,265 (Individual Income Tax Returns)
Here:
$57,265
State:
$77,088
Salary/wage: $44,725 (reported on 82.8% of returns)
Here:
$44,725
State:
$60,593
(% of AGI for various income ranges: 71.9% for AGIs below $25k, 70.9% for AGIs $25k-50k, 76.8% for AGIs $50k-75k, 70.3% for AGIs $75k-100k, 93.0% for AGIs $100k-200k)
Taxable interest for individuals: $824 (reported on 49.5% of returns)
This zip code:
$824
New York:
$3,125
(% of AGI for various income ranges: 1.5% for AGIs below $25k, 0.7% for AGIs $25k-50k, 0.3% for AGIs $50k-75k, 0.6% for AGIs $75k-100k, 1.4% for AGIs $100k-200k)
Ordinary dividends: $2,164 (reported on 23.7% of returns)
Here:
$2,164
State:
$10,299
(% of AGI for various income ranges: 1.1% for AGIs below $25k, 1.4% for AGIs $25k-50k, 0.6% for AGIs $50k-75k, 1.0% for AGIs $75k-100k, 1.3% for AGIs $100k-200k)
Net capital gain/loss in AGI: +$21,669 (reported on 14.0% of returns)
Here:
+$21,669
State:
+$42,474
(% of AGI for various income ranges: 1.1% for AGIs $25k-50k, 0.9% for AGIs $50k-75k, 20.0% for AGIs $100k-200k)
Profit/loss from business: +$6,938 (reported on 14.0% of returns)
Here:
+$6,938
State:
+$16,168
(% of AGI for various income ranges: 4.1% for AGIs below $25k, 3.5% for AGIs $25k-50k, 2.8% for AGIs $50k-75k, 2.3% for AGIs $75k-100k)
Taxable individual retirement arrangement distribution: $6,875 (reported on 12.9% of returns)
13160:
$6,875
New York:
$17,621
(% of AGI for various income ranges: 3.3% for AGIs below $25k, 4.3% for AGIs $25k-50k, 4.1% for AGIs $75k-100k)
Total itemized deductions: $19,045 (18% of AGI, reported on 31.2% of returns)
Here:
$19,045
State:
$34,985
Here:
18.5% of AGI
State:
21.3% of AGI
(% of AGI for various income ranges: 13.5% for AGIs $25k-50k, 7.6% for AGIs $50k-75k, 9.0% for AGIs $75k-100k, 21.7% for AGIs $100k-200k)
Charity contributions: $3,396 (reported on 25.8% of returns)
Here:
$3,396
State:
$5,572
(% of AGI for various income ranges: 2.0% for AGIs $25k-50k, 1.3% for AGIs $50k-75k, 1.0% for AGIs $75k-100k, 3.4% for AGIs $100k-200k)
Taxes paid: $8,924 (reported on 31.2% of returns)
13160:
$8,924
State:
$18,656
(% of AGI for various income ranges: 4.3% for AGIs $25k-50k, 3.4% for AGIs $50k-75k, 4.2% for AGIs $75k-100k, 11.6% for AGIs $100k-200k)
Earned income credit: $1,909 (reported on 11.8% of returns)
Here:
$1,909
State:
$2,230
(% of AGI for various income ranges: 4.2% for AGIs below $25k, 0.6% for AGIs $25k-50k)
Percentage of individuals using paid preparers for their 2012 taxes: 59.1%
Here:
59%
State:
66%
(% for various income ranges: 50.0% for AGIs below $25k, 56.5% for AGIs $25k-50k, 68.8% for AGIs $50k-75k, 60.0% for AGIs $75k-100k, 90.0% for AGIs $100k-200k)
Averages for the 2004 tax year for zip code 13160, filed in 2005:
Average Adjusted Gross Income (AGI) in 2004: $40,195 (Individual Income Tax Returns)
Here:
$40,195
State:
$59,519
Salary/wage: $34,545 (reported on 83.9% of returns)
Here:
$34,545
State:
$50,673
(% of AGI for various income ranges: 98.3% for AGIs below $10k, 70.8% for AGIs $10k-25k, 74.4% for AGIs $25k-50k, 73.7% for AGIs $50k-75k, 80.7% for AGIs $75k-100k, 57.5% for AGIs over 100k)
Taxable interest for individuals: $938 (reported on 54.8% of returns)
This zip code:
$938
New York:
$2,377
(% of AGI for various income ranges: 6.0% for AGIs below $10k, 1.8% for AGIs $10k-25k, 1.5% for AGIs $25k-50k, 1.1% for AGIs $50k-75k, 0.2% for AGIs $75k-100k, 1.5% for AGIs over 100k)
Taxable dividends: $1,667 (reported on 28.4% of returns)
Here:
$1,667
State:
$5,394
(% of AGI for various income ranges: 3.3% for AGIs below $10k, 2.3% for AGIs $10k-25k, 0.8% for AGIs $25k-50k, 0.8% for AGIs $50k-75k, 0.2% for AGIs $75k-100k, 2.2% for AGIs over 100k)
Net capital gain/loss: +$5,276 (reported on 19.7% of returns)
Here:
+$5,276
State:
+$23,581
(% of AGI for various income ranges: -1.7% for AGIs below $10k, 0.8% for AGIs $10k-25k, 1.2% for AGIs $25k-50k, 2.3% for AGIs $50k-75k, 0.7% for AGIs $75k-100k, 7.5% for AGIs over 100k)
Profit/loss from business: +$4,889 (reported on 13.9% of returns)
Here:
+$4,889
State:
+$13,809
(% of AGI for various income ranges: 7.5% for AGIs below $10k, 4.8% for AGIs $10k-25k, 2.9% for AGIs $25k-50k, 1.3% for AGIs $50k-75k, 0.3% for AGIs $75k-100k)
IRA payment deduction: $2,704 (reported on 2.8% of returns)
13160:
$2,704
New York:
$3,115
Total itemized deductions: $15,806 (22% of AGI, reported on 29.6% of returns)
Here:
$15,806
State:
$25,864
Here:
22.4% of AGI
State:
21.9% of AGI
(% of AGI for various income ranges: 12.1% for AGIs $10k-25k, 8.9% for AGIs $25k-50k, 12.6% for AGIs $50k-75k, 13.1% for AGIs $75k-100k, 13.0% for AGIs over 100k)
Charity contributions deductions: $2,191 (3% of AGI, reported on 26.9% of returns)
Here:
$2,191
State:
$4,439
Here:
3.0% of AGI
State:
3.6% of AGI
(% of AGI for various income ranges: 1.4% for AGIs $10k-25k, 1.0% for AGIs $25k-50k, 1.6% for AGIs $50k-75k, 1.8% for AGIs $75k-100k, 1.6% for AGIs over 100k)
Total tax: $4,803 (reported on 76.8% of returns)
13160:
$4,803
State:
$11,730
(% of AGI for various income ranges: 2.8% for AGIs below $10k, 4.0% for AGIs $10k-25k, 6.7% for AGIs $25k-50k, 8.3% for AGIs $50k-75k, 9.9% for AGIs $75k-100k, 15.5% for AGIs over 100k)
Earned income credit: $1,605 (reported on 11.7% of returns)
Here:
$1,605
State:
$1,757
Percentage of individuals using paid preparers for their 2004 taxes: 58.4%
Here:
58%
State:
67%
(% for various income ranges: 48.2% for AGIs below $10k, 56.0% for AGIs $10k-25k, 59.1% for AGIs $25k-50k, 64.0% for AGIs $50k-75k, 62.1% for AGIs $75k-100k, 79.2% for AGIs over 100k)
Household received Food Stamps/SNAP in the past 12 months: 76 Household did not receive Food Stamps/SNAP in the past 12 months: 733
Women who had a birth in the past 12 months: 27 (27 now married, 0 unmarried) Women who did not have a birth in the past 12 months: 424 (180 now married, 242 unmarried)
Housing units in zip code 13160 with a mortgage: 362 (26 second mortgage, 23 both second mortgage and home equity loan) Houses without a mortgage: 4
Median monthly owner costs for units with a mortgage: $1,391 Median monthly owner costs for units without a mortgage: $646
Residents with income below the poverty level in 2022:
This zip code:
9.1%
Whole state:
14.3%
Residents with income below 50% of the poverty level in 2022:
This zip code:
2.7%
Whole state:
6.8%
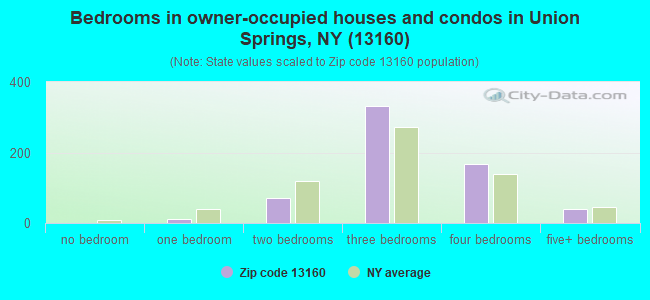
Median number of rooms in houses and condos:
Here:
6.9
State:
6.3
Median number of rooms in apartments:
Here:
5.7
State:
3.8
Notable locations in this zip code not listed on our city pages
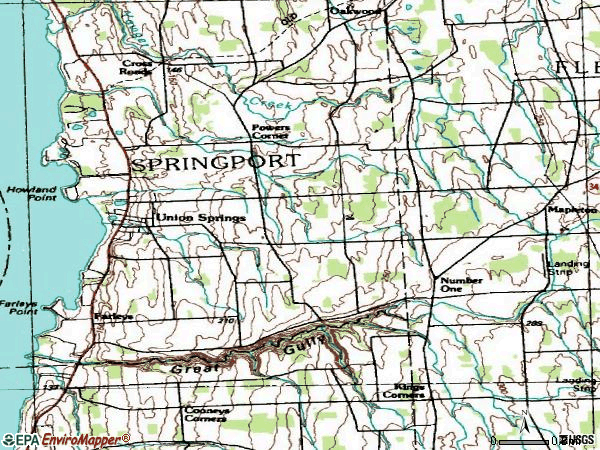
Notable locations in zip code 13160: Barbers Corners (A), Number One (B), Cooneys Corners (C), Spruce Haven Farm (D), Springport Free Library (E), Union Hose and Engine Company (F). Display/hide their locations on the map
Cemeteries: Old Quaker Cemetery (1), Saint Michaels Roman Catholic Cemetery (2), Old Quaker Cemetery (3), Evergreen Cemetery (4), Gifford Cemetery (5), Chestnut Hill Cemetery (6). Display/hide their locations on the map
391 married couples with children.
52 single-parent households (24 men, 28 women).
98.2% of residents of 13160 zip code speak English at home.
1.4% of residents speak Spanish at home (93% very well, 7% well).
0.2% of residents speak other language at home (100% very well).
Foreign born population: 17 (0.8%) (73.2% of them are naturalized citizens)
This zip code:
0.8%
Whole state:
22.7%
29%Eritrea
18%Romania
12%Brazil
6%Honduras
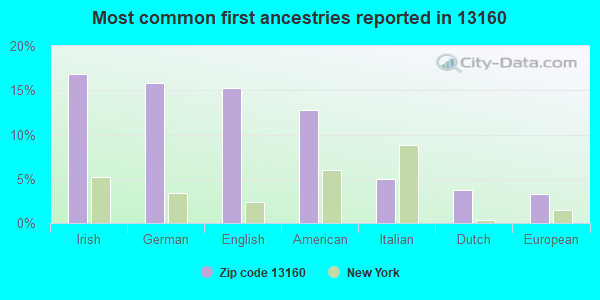
17%Irish
16%German
15%English
13%American
5%Italian
4%Dutch
3%European
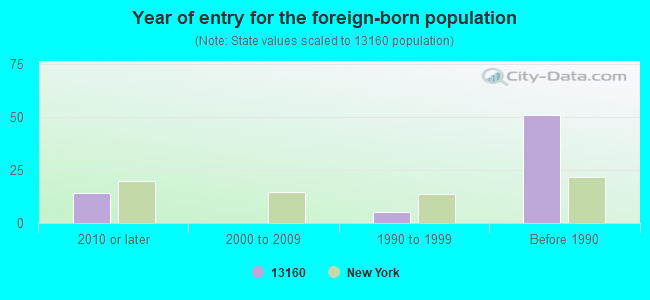
Year of entry for the foreign-born population
142010 or later
02000 to 2009
51990 to 1999
51Before 1990
Facilities with environmental interests located in this zip code:
ANDREW J. SMITH ES ( in UNION SPRINGS, NY)
(National Center for Education Statistics) - STATE ID-051901040002 Organizations: UNION SPRINGS CSD (SCHOOL DISTRICT)
GORDON C PALMER INC (PO BOX 40 - CAYUGA ST in UNION SPRINGS, NY)
(Resource Conservation and Recovery Act (tracking hazardous waste))
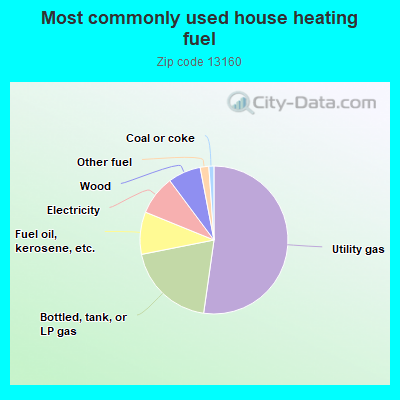
52.4%Utility gas
19.7%Bottled, tank, or LP gas
9.3%Fuel oil, kerosene, etc.
8.7%Electricity
7.2%Wood
1.9%Other fuel
1.1%Coal or coke
Population in 1990: 1,984.
Place of birth for U.S.-born residents:
This state: 1,765
Northeast: 132
Midwest: 29
South: 204
West: 9
71% of the 13160 zip code residents lived in the same house 5 years ago. Out of people who lived in different houses, 74% lived in this county. Out of people who lived in different counties, 50% lived in New York.
95% of the 13160 zip code residents lived in the same house 1 year ago. Out of people who lived in different houses, 29% moved from this county. Out of people who lived in different houses, 46% moved from different county within same state. Out of people who lived in different houses, 5% moved from different state. Out of people who lived in different houses, 18% moved from abroad.
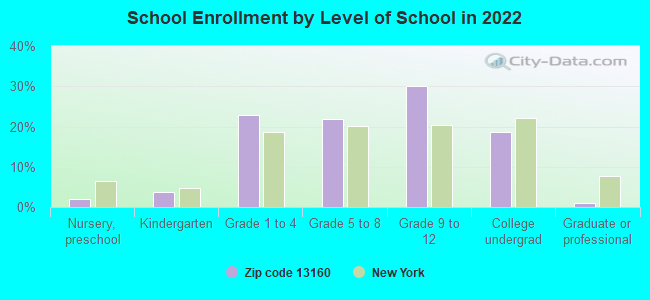
Private vs. public school enrollment:
Students in private schools in grades 1 to 8 (elementary and middle school): 25
Here:
9.7%
New York:
15.6%
Students in private schools in grades 9 to 12 (high school): 16
Here:
9.5%
New York:
15.0%
Students in private undergraduate colleges: 34
Here:
32.5%
New York:
39.2%
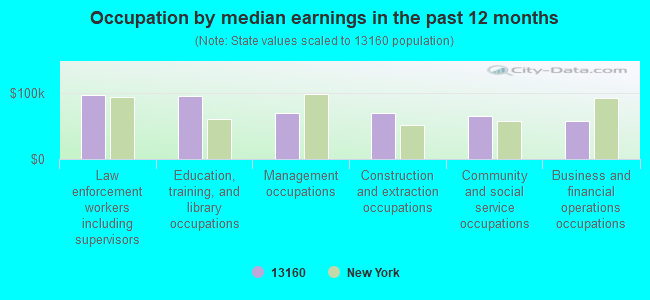
Occupation by median earnings in the past 12 months ($)
97,547Law enforcement workers including supervisors
96,541Education, training, and library occupations
69,986Management occupations
69,248Construction and extraction occupations
65,331Community and social service occupations
57,762Business and financial operations occupations
Top industries in this zip code by the number of employees in 2005:
Finance and Insurance: Commercial Banking (20-49 employees: 1 establishment)
Other Services (except Public Administration): Civic and Social Organizations (10-19: 1, 1-4: 1)
Educational Services: Elementary and Secondary Schools (10-19: 1)
Arts, Entertainment, and Recreation: Marinas (10-19: 1)
Other Services (except Public Administration): Religious Organizations (5-9: 1, 1-4: 2)
People in group quarters in 2010:
56 people in workers' group living quarters and job corps centers
4 people in group homes intended for adults
Fatal accident statistics in 2013:
Fatal accident count: 1
Vehicles involved in fatal accidents: 1
Fatal accidents caused by drunken drivers: 0
Fatalities: 1
Persons involved in fatal accidents: 2
Pedestrians involved in fatal accidents: 1
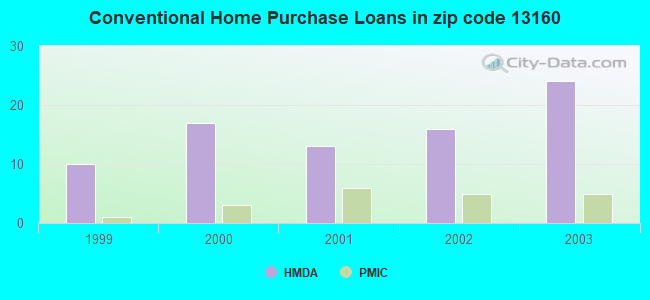
Home Mortgage Disclosure Act Aggregated Statistics For Year 2003 (Based on 4 partial tracts)
A) FHA, FSA/RHS & VA Home Purchase Loans
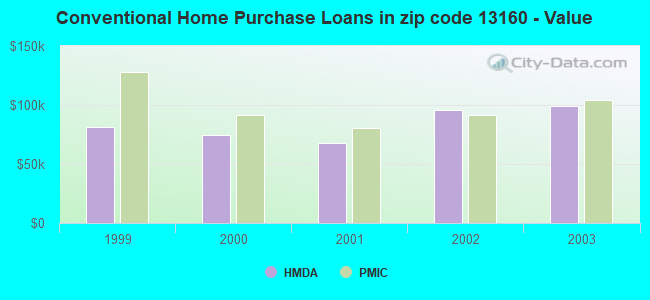
B) Conventional Home Purchase Loans
C) Refinancings
D) Home Improvement Loans
F) Non-occupant Loans on < 5 Family Dwellings (A B C & D)
Number
Average Value
Number
Average Value
Number
Average Value
Number
Average Value
Number
Average Value
LOANS ORIGINATED
4
$75,748
24
$98,735
59
$82,558
16
$18,691
5
$100,072
APPLICATIONS APPROVED, NOT ACCEPTED
0
$0
2
$67,970
6
$80,693
3
$13,017
1
$35,940
APPLICATIONS DENIED
0
$0
3
$59,410
24
$80,542
8
$16,099
1
$82,490
APPLICATIONS WITHDRAWN
0
$0
1
$101,400
23
$94,988
2
$29,640
0
$0
FILES CLOSED FOR INCOMPLETENESS
0
$0
1
$135,780
2
$85,405
0
$0
0
$0
Aggregated Statistics For Year 2002 (Based on 4 partial tracts)
A) FHA, FSA/RHS & VA Home Purchase Loans
B) Conventional Home Purchase Loans
C) Refinancings
D) Home Improvement Loans
F) Non-occupant Loans on < 5 Family Dwellings (A B C & D)
Number
Average Value
Number
Average Value
Number
Average Value
Number
Average Value
Number
Average Value
LOANS ORIGINATED
8
$74,262
16
$95,394
43
$79,016
16
$19,444
5
$120,216
APPLICATIONS APPROVED, NOT ACCEPTED
0
$0
3
$68,927
8
$72,824
2
$21,770
1
$102,950
APPLICATIONS DENIED
0
$0
2
$106,795
22
$77,241
4
$11,962
0
$0
APPLICATIONS WITHDRAWN
0
$0
1
$113,000
16
$88,176
2
$17,150
0
$0
FILES CLOSED FOR INCOMPLETENESS
0
$0
0
$0
3
$84,440
0
$0
0
$0
Aggregated Statistics For Year 2001 (Based on 4 partial tracts)
A) FHA, FSA/RHS & VA Home Purchase Loans
B) Conventional Home Purchase Loans
C) Refinancings
D) Home Improvement Loans
F) Non-occupant Loans on < 5 Family Dwellings (A B C & D)
Number
Average Value
Number
Average Value
Number
Average Value
Number
Average Value
Number
Average Value
LOANS ORIGINATED
5
$74,932
13
$67,508
29
$66,059
16
$12,956
3
$79,617
APPLICATIONS APPROVED, NOT ACCEPTED
0
$0
5
$66,950
5
$74,912
1
$17,750
0
$0
APPLICATIONS DENIED
0
$0
5
$39,800
21
$58,879
9
$14,293
1
$98,400
APPLICATIONS WITHDRAWN
0
$0
2
$49,750
10
$69,436
3
$22,417
0
$0
FILES CLOSED FOR INCOMPLETENESS
0
$0
1
$35,060
1
$53,240
0
$0
0
$0
Aggregated Statistics For Year 2000 (Based on 4 partial tracts)
A) FHA, FSA/RHS & VA Home Purchase Loans
B) Conventional Home Purchase Loans
C) Refinancings
D) Home Improvement Loans
F) Non-occupant Loans on < 5 Family Dwellings (A B C & D)
Number
Average Value
Number
Average Value
Number
Average Value
Number
Average Value
Number
Average Value
LOANS ORIGINATED
7
$66,076
17
$74,961
15
$51,521
18
$13,342
2
$38,500
APPLICATIONS APPROVED, NOT ACCEPTED
0
$0
4
$55,372
4
$58,700
1
$51,760
0
$0
APPLICATIONS DENIED
0
$0
8
$60,924
18
$52,299
5
$24,560
2
$100,510
APPLICATIONS WITHDRAWN
0
$0
1
$69,030
9
$50,843
0
$0
0
$0
FILES CLOSED FOR INCOMPLETENESS
0
$0
0
$0
2
$39,615
0
$0
0
$0
Aggregated Statistics For Year 1999 (Based on 2 partial tracts)
A) FHA, FSA/RHS & VA Home Purchase Loans
B) Conventional Home Purchase Loans
C) Refinancings
D) Home Improvement Loans
F) Non-occupant Loans on < 5 Family Dwellings (A B C & D)

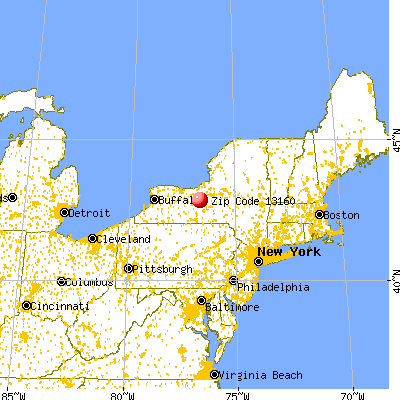


 Nearest zip codes: 13026, 13147, 13024, 13021, 13034, 13081.