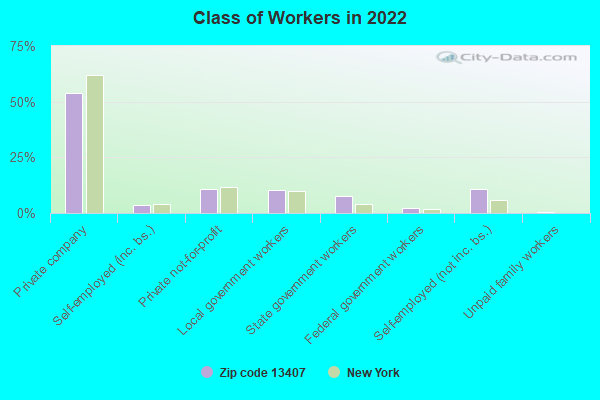
Estimated zip code population in 2022: 5,058 Zip code population in 2010: 5,453 Zip code population in 2000: 5,724
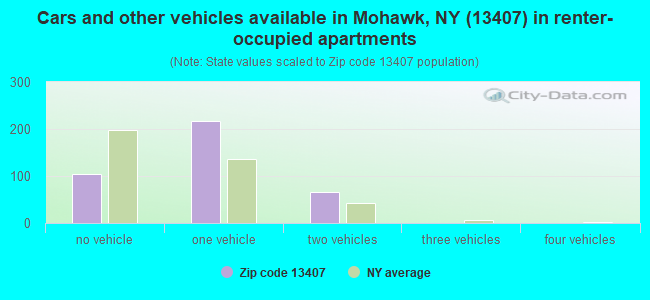
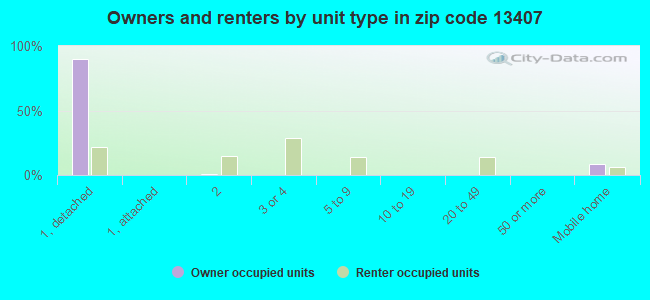
Houses and condos: 2,184 Renter-occupied apartments: 384
% of renters here:
20%
State:
46%
March 2022 cost of living index in zip code 13407: 98.2 (near average, U.S. average is 100)
Land area: 54.3 sq. mi. Water area: 0.5 sq. mi.
Population density: 93 people per square mile
(very low).
OSM Map
General Map
Google Map
MSN Map
OSM Map
General Map
Google Map
MSN Map
OSM Map
General Map
Google Map
MSN Map
OSM Map
General Map
Google Map
MSN Map
Please wait while loading the map...
Real estate property taxes paid for housing units in 2022:
This zip code:
2.3% ($3,028)
New York:
1.5% ($6,180)
Median real estate property taxes paid for housing units with mortgages in 2022: $2,922 (2.3%) Median real estate property taxes paid for housing units with no mortgage in 2022: $3,114 (2.3%)
Business Search- 14 Million verified businesses
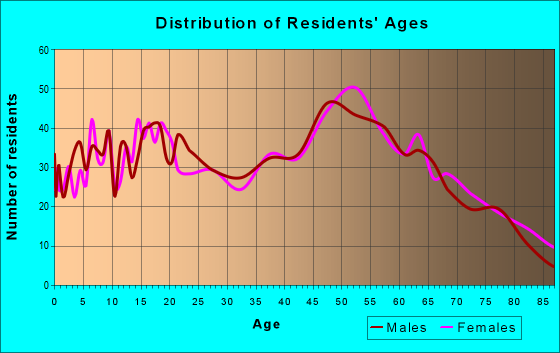
Males: 2,493
(49.3%)
Females: 2,564
(50.7%)
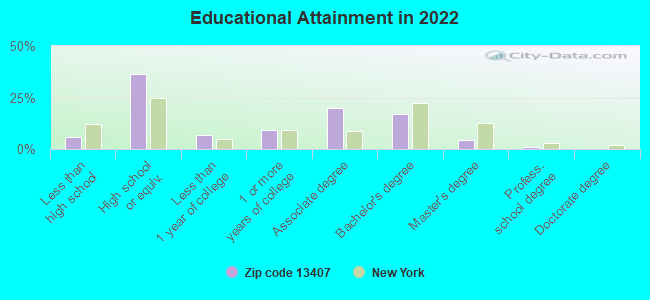
For population 25 years and over in 13407:
High school or higher: 93.6%
Bachelor's degree or higher: 22.1%
Graduate or professional degree: 5.2%
Unemployed: 2.4%
Mean travel time to work (commute): 26.1 minutes
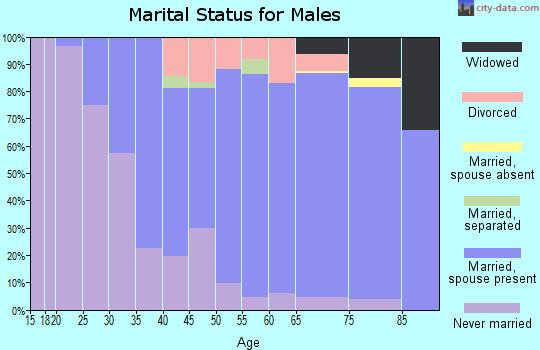
For population 15 years and over in 13407:
Never married: 30.7%
Now married: 51.1%
Separated: 1.5%
Widowed: 5.1%
Divorced: 11.6%
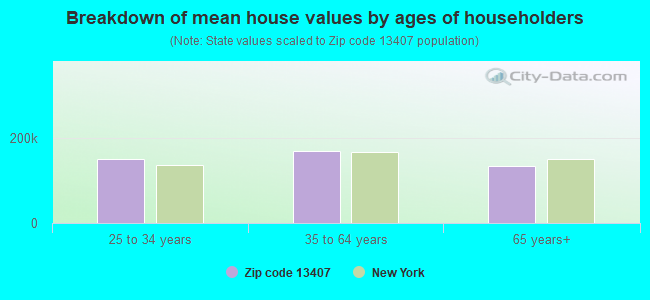
Zip code 13407 compared to state average:
Median house value significantly below state average.
Unemployed percentage below state average.
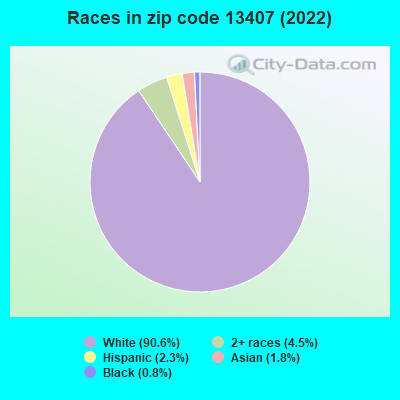
Black race population percentage significantly below state average.
Hispanic race population percentage significantly below state average.
Median age above state average.
Foreign-born population percentage significantly below state average.
Renting percentage significantly below state average.
Length of stay since moving in significantly above state average.
Number of rooms per house above state average.
Percentage of population with a bachelor's degree or higher below state average.
Averages for the 2020 tax year for zip code 13407, filed in 2021:
Average Adjusted Gross Income (AGI) in 2020: $49,801 (Individual Income Tax Returns)
Here:
$49,801
State:
$90,930
Salary/wage: $45,208 (reported on 82.0% of returns)
Here:
$45,208
State:
$72,104
(% of AGI for various income ranges: 1138.8% for AGIs below $25k, 3426.6% for AGIs $25k-50k, 6053.3% for AGIs $50k-75k, 9088.9% for AGIs $75k-100k, 15105.6% for AGIs $100k-200k)
Taxable interest for individuals: $656 (reported on 35.2% of returns)
This zip code:
$656
New York:
$3,075
(% of AGI for various income ranges: 10.0% for AGIs below $25k, 11.6% for AGIs $25k-50k, 50.7% for AGIs $50k-75k, 45.6% for AGIs $75k-100k, 126.9% for AGIs $100k-200k)
Ordinary dividends: $1,770 (reported on 16.4% of returns)
Here:
$1,770
State:
$11,095
(% of AGI for various income ranges: 21.8% for AGIs below $25k, 17.4% for AGIs $25k-50k, 54.3% for AGIs $50k-75k, 39.4% for AGIs $75k-100k, 153.8% for AGIs $100k-200k)
Net capital gain/loss in AGI: +$5,263 (reported on 12.3% of returns)
Here:
+$5,263
State:
+$44,925
(% of AGI for various income ranges: 17.0% for AGIs below $25k, 25.2% for AGIs $25k-50k, 53.0% for AGIs $50k-75k, 215.0% for AGIs $75k-100k, 490.0% for AGIs $100k-200k)
Profit/loss from business: +$6,429 (reported on 8.6% of returns)
Here:
+$6,429
State:
+$14,940
(% of AGI for various income ranges: 62.5% for AGIs below $25k, 46.2% for AGIs $25k-50k, 145.0% for AGIs $50k-75k, 78.9% for AGIs $75k-100k, 88.1% for AGIs $100k-200k)
Taxable individual retirement arrangement distribution: $11,643 (reported on 9.4% of returns)
13407:
$11,643
New York:
$19,609
(% of AGI for various income ranges: 69.5% for AGIs below $25k, 83.8% for AGIs $25k-50k, 200.0% for AGIs $50k-75k, 214.4% for AGIs $75k-100k, 495.0% for AGIs $100k-200k)
Total itemized deductions: $16,800 (reported on 2.5% of returns)
Here:
$16,800
State:
$39,326
(% of AGI for various income ranges: 81.6% for AGIs $25k-50k, 283.3% for AGIs $75k-100k)
Charity contributions: $2,967 (reported on 1.2% of returns)
Here:
$2,967
State:
$15,420
(% of AGI for various income ranges: 29.7% for AGIs $50k-75k)
Taxes paid: $8,425 (reported on 1.6% of returns)
13407:
$8,425
State:
$9,183
(% of AGI for various income ranges: 21.3% for AGIs $25k-50k, 115.0% for AGIs $75k-100k)
Earned income credit: $2,309 (reported on 13.5% of returns)
Here:
$2,309
State:
$2,138
(% of AGI for various income ranges: 72.5% for AGIs below $25k, 58.4% for AGIs $25k-50k)
Percentage of individuals using paid preparers for their 2020 taxes: 94.7%
Here:
95%
State:
95%
(% for various income ranges: 93.3% for AGIs below $25k, 94.7% for AGIs $25k-50k, 95.1% for AGIs $50k-75k, 96.2% for AGIs $75k-100k, 95.8% for AGIs $100k-200k, 100.0% for AGIs over 200k)
Averages for the 2012 tax year for zip code 13407, filed in 2013:
Average Adjusted Gross Income (AGI) in 2012: $41,381 (Individual Income Tax Returns)
Here:
$41,381
State:
$77,088
Salary/wage: $38,266 (reported on 82.7% of returns)
Here:
$38,266
State:
$60,593
(% of AGI for various income ranges: 70.1% for AGIs below $25k, 79.1% for AGIs $25k-50k, 76.6% for AGIs $50k-75k, 79.0% for AGIs $75k-100k, 75.0% for AGIs $100k-200k)
Taxable interest for individuals: $500 (reported on 39.5% of returns)
This zip code:
$500
New York:
$3,125
(% of AGI for various income ranges: 1.1% for AGIs below $25k, 0.4% for AGIs $25k-50k, 0.5% for AGIs $50k-75k, 0.4% for AGIs $75k-100k, 0.2% for AGIs $100k-200k)
Ordinary dividends: $1,308 (reported on 20.2% of returns)
Here:
$1,308
State:
$10,299
(% of AGI for various income ranges: 1.5% for AGIs below $25k, 0.7% for AGIs $25k-50k, 0.5% for AGIs $50k-75k, 0.4% for AGIs $75k-100k, 0.4% for AGIs $100k-200k)
Net capital gain/loss in AGI: +$2,823 (reported on 10.7% of returns)
Here:
+$2,823
State:
+$42,474
(% of AGI for various income ranges: 0.8% for AGIs below $25k, 0.2% for AGIs $25k-50k, 0.2% for AGIs $50k-75k, 0.5% for AGIs $75k-100k, 2.2% for AGIs $100k-200k)
Profit/loss from business: +$7,200 (reported on 11.5% of returns)
Here:
+$7,200
State:
+$16,168
(% of AGI for various income ranges: 5.1% for AGIs below $25k, 2.0% for AGIs $25k-50k, 1.6% for AGIs $50k-75k, 1.1% for AGIs $75k-100k, 1.4% for AGIs $100k-200k)
Taxable individual retirement arrangement distribution: $7,962 (reported on 9.9% of returns)
13407:
$7,962
New York:
$17,621
(% of AGI for various income ranges: 3.8% for AGIs below $25k, 1.8% for AGIs $25k-50k, 1.7% for AGIs $50k-75k, 3.2% for AGIs $75k-100k)
Total itemized deductions: $16,752 (21% of AGI, reported on 17.3% of returns)
Here:
$16,752
State:
$34,985
Here:
20.6% of AGI
State:
21.3% of AGI
(% of AGI for various income ranges: 3.3% for AGIs below $25k, 5.0% for AGIs $25k-50k, 6.4% for AGIs $50k-75k, 8.1% for AGIs $75k-100k, 11.2% for AGIs $100k-200k)
Charity contributions: $2,097 (reported on 12.8% of returns)
Here:
$2,097
State:
$5,572
(% of AGI for various income ranges: 0.3% for AGIs below $25k, 0.5% for AGIs $25k-50k, 0.6% for AGIs $50k-75k, 0.8% for AGIs $75k-100k, 1.0% for AGIs $100k-200k)
Taxes paid: $7,543 (reported on 17.3% of returns)
13407:
$7,543
State:
$18,656
(% of AGI for various income ranges: 1.0% for AGIs below $25k, 1.8% for AGIs $25k-50k, 2.6% for AGIs $50k-75k, 3.3% for AGIs $75k-100k, 6.5% for AGIs $100k-200k)
Earned income credit: $2,067 (reported on 18.5% of returns)
Here:
$2,067
State:
$2,230
(% of AGI for various income ranges: 5.5% for AGIs below $25k, 1.0% for AGIs $25k-50k)
Percentage of individuals using paid preparers for their 2012 taxes: 51.0%
Here:
51%
State:
66%
(% for various income ranges: 42.0% for AGIs below $25k, 55.2% for AGIs $25k-50k, 59.0% for AGIs $50k-75k, 61.9% for AGIs $75k-100k, 56.2% for AGIs $100k-200k)
Averages for the 2004 tax year for zip code 13407, filed in 2005:
Average Adjusted Gross Income (AGI) in 2004: $34,317 (Individual Income Tax Returns)
Here:
$34,317
State:
$59,519
Salary/wage: $32,434 (reported on 85.8% of returns)
Here:
$32,434
State:
$50,673
(% of AGI for various income ranges: 120.8% for AGIs below $10k, 74.0% for AGIs $10k-25k, 84.2% for AGIs $25k-50k, 84.5% for AGIs $50k-75k, 87.0% for AGIs $75k-100k, 62.6% for AGIs over 100k)
Taxable interest for individuals: $995 (reported on 46.3% of returns)
This zip code:
$995
New York:
$2,377
(% of AGI for various income ranges: 4.8% for AGIs below $10k, 2.7% for AGIs $10k-25k, 0.7% for AGIs $25k-50k, 1.2% for AGIs $50k-75k, 0.4% for AGIs $75k-100k, 2.3% for AGIs over 100k)
Taxable dividends: $919 (reported on 25.3% of returns)
Here:
$919
State:
$5,394
(% of AGI for various income ranges: 4.4% for AGIs below $10k, 1.3% for AGIs $10k-25k, 0.4% for AGIs $25k-50k, 0.7% for AGIs $50k-75k, 0.3% for AGIs $75k-100k, 0.3% for AGIs over 100k)
Net capital gain/loss: +$2,386 (reported on 14.2% of returns)
Here:
+$2,386
State:
+$23,581
(% of AGI for various income ranges: -1.5% for AGIs below $10k, 0.9% for AGIs $10k-25k, 0.3% for AGIs $25k-50k, 0.9% for AGIs $50k-75k, 0.2% for AGIs $75k-100k, 4.2% for AGIs over 100k)
Profit/loss from business: +$5,281 (reported on 10.9% of returns)
Here:
+$5,281
State:
+$13,809
(% of AGI for various income ranges: 7.6% for AGIs below $10k, 3.1% for AGIs $10k-25k, 1.9% for AGIs $25k-50k, 1.8% for AGIs $50k-75k, 0.3% for AGIs $75k-100k)
Profit/loss from farming: +$349 (reported on 1.8% of returns)
Here:
+$349
State:
-$2,666
IRA payment deduction: $2,804 (reported on 2.1% of returns)
13407:
$2,804
New York:
$3,115
Total itemized deductions: $14,427 (21% of AGI, reported on 17.2% of returns)
Here:
$14,427
State:
$25,864
Here:
20.6% of AGI
State:
21.9% of AGI
(% of AGI for various income ranges: 3.9% for AGIs $10k-25k, 6.2% for AGIs $25k-50k, 7.2% for AGIs $50k-75k, 10.0% for AGIs $75k-100k, 11.3% for AGIs over 100k)
Charity contributions deductions: $2,109 (3% of AGI, reported on 14.9% of returns)
Here:
$2,109
State:
$4,439
Here:
2.8% of AGI
State:
3.6% of AGI
(% of AGI for various income ranges: 0.3% for AGIs $10k-25k, 0.6% for AGIs $25k-50k, 0.8% for AGIs $50k-75k, 1.3% for AGIs $75k-100k, 2.2% for AGIs over 100k)
Total tax: $3,992 (reported on 74.1% of returns)
13407:
$3,992
State:
$11,730
(% of AGI for various income ranges: 3.6% for AGIs below $10k, 3.8% for AGIs $10k-25k, 6.7% for AGIs $25k-50k, 8.4% for AGIs $50k-75k, 10.0% for AGIs $75k-100k, 18.0% for AGIs over 100k)
Earned income credit: $1,627 (reported on 16.6% of returns)
Here:
$1,627
State:
$1,757
Percentage of individuals using paid preparers for their 2004 taxes: 56.5%
Here:
57%
State:
67%
(% for various income ranges: 46.8% for AGIs below $10k, 56.9% for AGIs $10k-25k, 59.1% for AGIs $25k-50k, 61.0% for AGIs $50k-75k, 61.0% for AGIs $75k-100k, 63.5% for AGIs over 100k)
Likely homosexual households (counted as self-reported same-sex unmarried-partner households)
Lesbian couples: 0.0% of all households
Gay men: 1.5% of all households
Household received Food Stamps/SNAP in the past 12 months: 190 Household did not receive Food Stamps/SNAP in the past 12 months: 1,760
Women who had a birth in the past 12 months: 61 (42 now married, 19 unmarried) Women who did not have a birth in the past 12 months: 974 (358 now married, 616 unmarried)
Housing units in zip code 13407 with a mortgage: 764 (82 second mortgage, 70 both second mortgage and home equity loan) Houses without a mortgage: 59
Median monthly owner costs for units with a mortgage: $1,104 Median monthly owner costs for units without a mortgage: $515
Residents with income below the poverty level in 2022:
This zip code:
12.7%
Whole state:
14.3%
Residents with income below 50% of the poverty level in 2022:
This zip code:
5.2%
Whole state:
6.8%
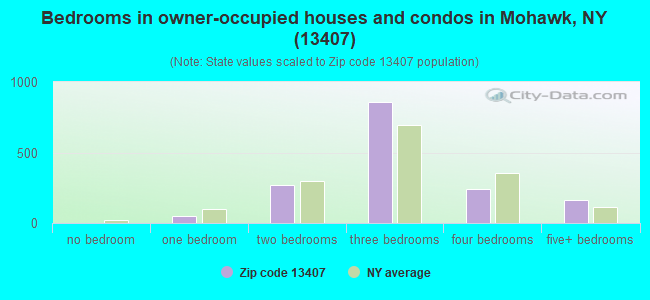
Median number of rooms in houses and condos:
Here:
6.9
State:
6.3
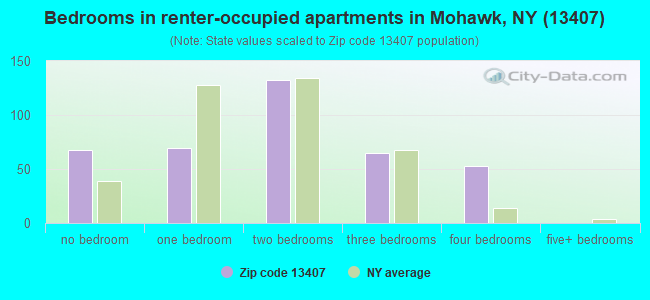
Median number of rooms in apartments:
Here:
4.1
State:
3.8
Notable locations in this zip code not listed on our city pages
Notable locations in zip code 13407: Herkimer County Sewer District Wastewater Treatment Facility (A), Weller Public Library (B), Mohawk Homestead Assisted Living Center (C), Mohawk Engine House (D). Display/hide their locations on the map
Churches in zip code 13407 include: Bible Baptist Church (A), Blessed Sacrament Church (B), Grace Episcopal Church (C), Mohawk Reformed Church (D), Denison Corner Community Church (E). Display/hide their locations on the map
Cemeteries: Mohawk Cemetery (1), Fort Herkimer Church Cemetery (2), Dennison Corners Cemetery (3), Jordanville Cemetery (4), Brown Cemetery (5), Warren Cemetery (6), Edick Cemetery (7). Display/hide their locations on the map
In group quarters: 149 (-1 institutionalized population)
Size of family households: 620 2-persons, 349 3-persons, 202 4-persons, 34 5-persons, 60 6-persons, 30 7-or-more-persons
Size of nonfamily households: 564 1-person, 99 2-persons, 3 3-persons
718 married couples with children.
256 single-parent households (12 men, 244 women).
94.6% of residents of 13407 zip code speak English at home.
2.0% of residents speak Spanish at home (68% very well, 28% well, 4% not well).
2.0% of residents speak other Indo-European language at home (92% very well, 8% not well).
1.2% of residents speak Asian or Pacific Island language at home (21% very well, 12% well, 67% not well).
0.2% of residents speak other language at home (100% well).
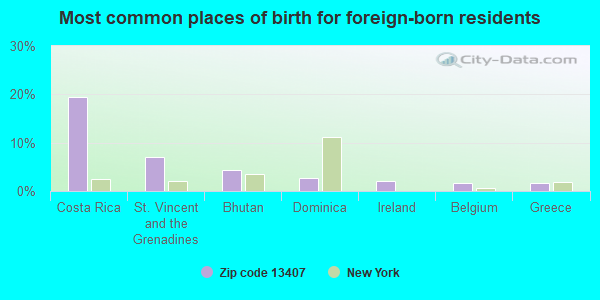
Foreign born population: 185 (3.7%) (54.5% of them are naturalized citizens)
This zip code:
3.7%
Whole state:
22.7%
19%Costa Rica
7%St. Vincent and the Grenadines
4%Bhutan
3%Dominica
2%Ireland
2%Belgium
2%Greece
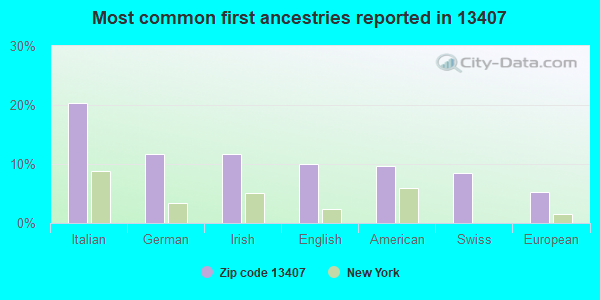
20%Italian
12%German
12%Irish
10%English
10%American
8%Swiss
5%European
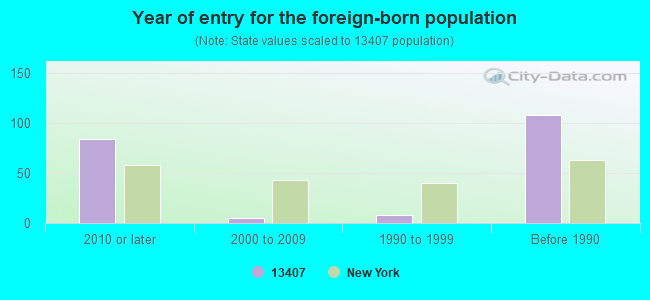
Year of entry for the foreign-born population
842010 or later
52000 to 2009
81990 to 1999
108Before 1990
Facilities with environmental interests located in this zip code:
HERKIMER CO SD WWTF (106 WEST MAIN STREET in MOHAWK, NY)
STATE MASTER (New York facility tracking) - National Pollutant Discharge Elimination System Permit, GRANTS AND PLANNING, National Pollutant Discharge Elimination System MAJOR (Tracking pollutant discharge elimination systems) - permit - ICIS-, ENFORCEMENT/COMPLIANCE ACTIVITY Business SIC classification: SEWERAGE SYSTEMS Business NAICS classification: SEWAGE TREATMENT FACILITIES. Organizations: HERKIMER COUNTY (LEGALLY RESPONSIBLE PARTY)
Alternative names: HERKIMER CO SD WWT FAC, HERKIMER COUNTY WWTP
GREGORY B JARVIS JSHS ( in MOHAWK, NY)
(National Center for Education Statistics) - STATE ID-210502040001 Organizations: MOHAWK CSD (SCHOOL DISTRICT)
HARRY M FISHER ES ( in MOHAWK, NY)
(National Center for Education Statistics) - STATE ID-210502040002 Organizations: MOHAWK CSD (SCHOOL DISTRICT)
GERMAN FLATTS TOWN OF - BIN 2266840 (RICHFIELD ST OVER STEELE CREEK in MOHAWK, NY)
(Resource Conservation and Recovery Act (tracking hazardous waste)) Organizations: TOWN OF GERMAN FLATTS (CONTACT/OWNER)
Alternative names: RICHFIELD ST BRIDGE OVER STEELE CREEK
GERMAN FLATS ILION (MORTZ RD in GERMAN FLATTS, NY)
SUPERFUND (Superfund database) Alternative names: GERMAN FLATS - ILION - MOHAWK LANDFILL
HOLT BROS INC (94 W MAIN ST in MOHAWK, NY)
Small Quantity Generators, between 100 kg and 1000 kg of hazardous waste/month (Resource Conservation and Recovery Act (tracking hazardous waste))
Housing units lacking complete plumbing facilities: 2.1% Housing units lacking complete kitchen facilities: 7.7%
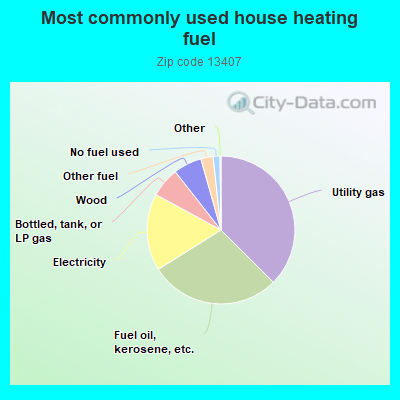
37.6%Utility gas
28.7%Fuel oil, kerosene, etc.
16.9%Electricity
6.5%Bottled, tank, or LP gas
6.2%Wood
2.7%Other fuel
1.5%No fuel used
Population in 1990: 5,907.
Place of birth for U.S.-born residents:
This state: 4,137
Northeast: 398
Midwest: 67
South: 101
West: 144
65% of the 13407 zip code residents lived in the same house 5 years ago. Out of people who lived in different houses, 71% lived in this county. Out of people who lived in different counties, 50% lived in New York.
94% of the 13407 zip code residents lived in the same house 1 year ago. Out of people who lived in different houses, 53% moved from this county. Out of people who lived in different houses, 28% moved from different county within same state. Out of people who lived in different houses, 18% moved from different state.
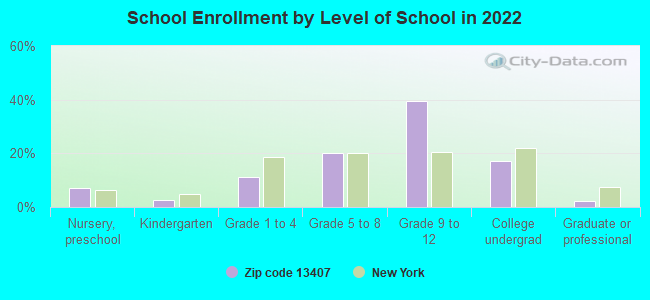
Private vs. public school enrollment:
Students in private schools in grades 1 to 8 (elementary and middle school): 45
Here:
11.7%
New York:
15.6%
Students in private schools in grades 9 to 12 (high school): 86
Here:
17.5%
New York:
15.0%
Students in private undergraduate colleges: 32
Here:
15.5%
New York:
39.2%
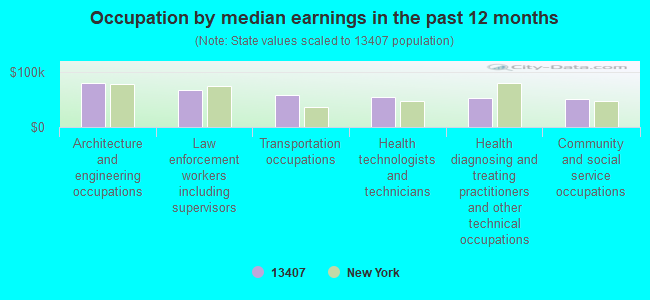
Occupation by median earnings in the past 12 months ($)
79,707Architecture and engineering occupations
66,563Law enforcement workers including supervisors
58,854Transportation occupations
55,103Health technologists and technicians
51,913Health diagnosing and treating practitioners and other technical occupations
50,576Community and social service occupations
Companies with federal contracts located in this zip code:
HUMMEL S OFFICE EQUIPMENT CO (25 CANAL STREET in MOHAWK, NY; small business)
$3,724 with Air Force for Office Furniture. Signed on 2006-04-13. Completion date: 2006-05-03.
Top industries in this zip code by the number of employees in 2005:
Administrative and Support and Waste Management and Remediation Services: Other Waste Collection (50-99 employees: 1 establishment)
Wholesale Trade: Stationery and Office Supplies Merchant Wholesalers (50-99: 1)
Administrative and Support and Waste Management and Remediation Services: Solid Waste Collection (20-49: 1, 10-19: 1)
Construction: Plumbing, Heating, and Air-Conditioning Contractors (20-49: 1, 1-4: 1)
Accommodation and Food Services: Full-Service Restaurants (20-49: 1, 1-4: 1)
Health Care and Social Assistance: Homes for the Elderly (20-49: 1)
Health Care and Social Assistance: Residential Mental Retardation Facilities (10-19: 1, 5-9: 1)
Other Services (except Public Administration): General Automotive Repair (10-19: 1, 1-4: 1)
People in group quarters in 2010:
15 people in group homes intended for adults
11 people in workers' group living quarters and job corps centers
6 people in other noninstitutional facilities
People in group quarters in 2000:
81 people in college dormitories (includes college quarters off campus)
21 people in other group homes
11 people in schools, hospitals, or wards for the intellectually disabled
4 people in homes for the mentally retarded
4 people in religious group quarters
Fatal accident statistics in 2014:
Fatal accident count: 1
Vehicles involved in fatal accidents: 2
Fatal accidents caused by drunken drivers: 0
Fatalities: 1
Persons involved in fatal accidents: 2
Pedestrians involved in fatal accidents: 0
Fatal accident statistics in 2012:
Fatal accident count: 1
Vehicles involved in fatal accidents: 1
Fatal accidents caused by drunken drivers: 0
Fatalities: 1
Persons involved in fatal accidents: 2
Pedestrians involved in fatal accidents: 1
Home Mortgage Disclosure Act Aggregated Statistics For Year 2009 (Based on 2 full and 8 partial tracts)
A) FHA, FSA/RHS & VA Home Purchase Loans
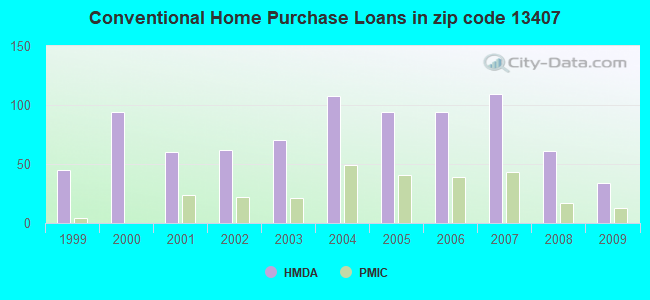
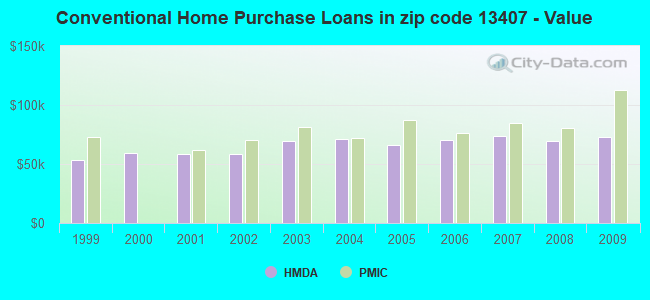
B) Conventional Home Purchase Loans
C) Refinancings
D) Home Improvement Loans
E) Loans on Dwellings For 5+ Families
F) Non-occupant Loans on < 5 Family Dwellings (A B C & D)
G) Loans On Manufactured Home Dwelling (A B C & D)
Number
Average Value
Number
Average Value
Number
Average Value
Number
Average Value
Number
Average Value
Number
Average Value
Number
Average Value
LOANS ORIGINATED
65
$76,482
34
$72,850
132
$79,561
43
$17,582
1
$141,200
4
$61,652
7
$60,834
APPLICATIONS APPROVED, NOT ACCEPTED
1
$42,450
3
$48,623
6
$76,502
2
$16,730
0
$0
0
$0
0
$0
APPLICATIONS DENIED
4
$69,462
15
$73,771
55
$96,982
32
$12,841
0
$0
6
$47,270
10
$61,910
APPLICATIONS WITHDRAWN
1
$75,480
3
$71,780
33
$86,454
6
$34,853
0
$0
0
$0
1
$70,050
FILES CLOSED FOR INCOMPLETENESS
0
$0
1
$59,490
7
$128,970
0
$0
0
$0
0
$0
0
$0
Aggregated Statistics For Year 2008 (Based on 2 full and 8 partial tracts)
A) FHA, FSA/RHS & VA Home Purchase Loans
B) Conventional Home Purchase Loans
C) Refinancings
D) Home Improvement Loans
F) Non-occupant Loans on < 5 Family Dwellings (A B C & D)
G) Loans On Manufactured Home Dwelling (A B C & D)
Number
Average Value
Number
Average Value
Number
Average Value
Number
Average Value
Number
Average Value
Number
Average Value
LOANS ORIGINATED
40
$77,738
61
$69,893
118
$71,938
56
$29,327
14
$46,366
20
$48,224
APPLICATIONS APPROVED, NOT ACCEPTED
2
$118,375
8
$55,150
18
$76,622
7
$28,823
1
$39,310
5
$64,398
APPLICATIONS DENIED
6
$71,627
27
$77,482
99
$86,237
44
$18,779
8
$84,049
18
$60,328
APPLICATIONS WITHDRAWN
0
$0
8
$63,915
22
$112,658
3
$15,717
1
$35,380
6
$103,363
FILES CLOSED FOR INCOMPLETENESS
4
$66,225
5
$56,632
5
$164,738
4
$20,522
0
$0
0
$0
Aggregated Statistics For Year 2007 (Based on 2 full and 8 partial tracts)
A) FHA, FSA/RHS & VA Home Purchase Loans
B) Conventional Home Purchase Loans
C) Refinancings
D) Home Improvement Loans
E) Loans on Dwellings For 5+ Families
F) Non-occupant Loans on < 5 Family Dwellings (A B C & D)
G) Loans On Manufactured Home Dwelling (A B C & D)
Number
Average Value
Number
Average Value
Number
Average Value
Number
Average Value
Number
Average Value
Number
Average Value
Number
Average Value
LOANS ORIGINATED
35
$68,986
109
$73,322
123
$68,514
72
$27,171
2
$75,475
24
$64,117
11
$47,406
APPLICATIONS APPROVED, NOT ACCEPTED
1
$36,550
20
$132,772
21
$64,193
9
$22,114
0
$0
6
$119,125
3
$71,053
APPLICATIONS DENIED
5
$82,152
39
$111,711
150
$201,700
90
$32,479
1
$58,970
15
$75,929
11
$99,243
APPLICATIONS WITHDRAWN
4
$56,398
9
$91,901
49
$89,943
14
$53,304
0
$0
2
$147,340
3
$55,573
FILES CLOSED FOR INCOMPLETENESS
1
$41,740
5
$62,694
11
$96,788
0
$0
0
$0
0
$0
0
$0
Aggregated Statistics For Year 2006 (Based on 2 full and 8 partial tracts)
A) FHA, FSA/RHS & VA Home Purchase Loans
B) Conventional Home Purchase Loans
C) Refinancings
D) Home Improvement Loans
E) Loans on Dwellings For 5+ Families
F) Non-occupant Loans on < 5 Family Dwellings (A B C & D)
G) Loans On Manufactured Home Dwelling (A B C & D)
Number
Average Value
Number
Average Value
Number
Average Value
Number
Average Value
Number
Average Value
Number
Average Value
Number
Average Value
LOANS ORIGINATED
27
$74,369
94
$70,261
149
$58,387
87
$24,886
1
$117,930
19
$62,060
15
$55,160
APPLICATIONS APPROVED, NOT ACCEPTED
0
$0
11
$117,213
28
$80,093
9
$23,020
0
$0
2
$51,290
3
$80,513
APPLICATIONS DENIED
7
$64,106
44
$83,116
188
$71,929
119
$32,024
0
$0
21
$66,596
16
$66,291
APPLICATIONS WITHDRAWN
4
$58,588
18
$180,593
102
$73,155
17
$43,215
2
$58,975
5
$41,262
1
$112,690
FILES CLOSED FOR INCOMPLETENESS
0
$0
6
$72,903
15
$92,149
1
$38,060
0
$0
3
$78,690
0
$0
Aggregated Statistics For Year 2005 (Based on 2 full and 8 partial tracts)
A) FHA, FSA/RHS & VA Home Purchase Loans
B) Conventional Home Purchase Loans
C) Refinancings
D) Home Improvement Loans
E) Loans on Dwellings For 5+ Families
F) Non-occupant Loans on < 5 Family Dwellings (A B C & D)
G) Loans On Manufactured Home Dwelling (A B C & D)
Number
Average Value
Number
Average Value
Number
Average Value
Number
Average Value
Number
Average Value
Number
Average Value
Number
Average Value
LOANS ORIGINATED
27
$56,706
94
$66,356
142
$63,172
89
$25,602
3
$97,743
14
$54,633
16
$57,791
APPLICATIONS APPROVED, NOT ACCEPTED
2
$40,265
8
$62,525
30
$67,149
8
$24,699
0
$0
3
$64,507
2
$50,485
APPLICATIONS DENIED
5
$73,946
31
$66,815
165
$69,017
86
$26,581
0
$0
12
$59,849
29
$58,128
APPLICATIONS WITHDRAWN
3
$64,473
11
$95,484
122
$82,835
13
$189,958
1
$47,170
6
$71,178
4
$60,322
FILES CLOSED FOR INCOMPLETENESS
2
$58,570
6
$79,470
14
$86,892
3
$176,213
0
$0
0
$0
0
$0
Aggregated Statistics For Year 2004 (Based on 2 full and 8 partial tracts)
A) FHA, FSA/RHS & VA Home Purchase Loans
B) Conventional Home Purchase Loans
C) Refinancings
D) Home Improvement Loans
E) Loans on Dwellings For 5+ Families
F) Non-occupant Loans on < 5 Family Dwellings (A B C & D)
G) Loans On Manufactured Home Dwelling (A B C & D)
Number
Average Value
Number
Average Value
Number
Average Value
Number
Average Value
Number
Average Value
Number
Average Value
Number
Average Value
LOANS ORIGINATED
19
$61,706
108
$71,380
183
$55,992
89
$28,190
0
$0
14
$54,939
21
$44,728
APPLICATIONS APPROVED, NOT ACCEPTED
0
$0
10
$77,257
41
$74,871
9
$45,138
0
$0
2
$44,170
5
$37,994
APPLICATIONS DENIED
2
$64,465
24
$52,374
189
$68,843
64
$27,123
0
$0
7
$62,756
24
$51,807
APPLICATIONS WITHDRAWN
5
$47,090
21
$74,213
146
$69,268
14
$38,841
2
$101,515
8
$64,064
15
$67,406
FILES CLOSED FOR INCOMPLETENESS
1
$49,530
10
$74,229
12
$80,262
4
$29,160
0
$0
1
$81,640
0
$0
Aggregated Statistics For Year 2003 (Based on 2 full and 8 partial tracts)
A) FHA, FSA/RHS & VA Home Purchase Loans
B) Conventional Home Purchase Loans
C) Refinancings
D) Home Improvement Loans
F) Non-occupant Loans on < 5 Family Dwellings (A B C & D)
Number
Average Value
Number
Average Value
Number
Average Value
Number
Average Value
Number
Average Value
LOANS ORIGINATED
31
$64,405
70
$69,617
261
$56,012
44
$19,615
7
$70,193
APPLICATIONS APPROVED, NOT ACCEPTED
0
$0
10
$69,761
39
$55,450
3
$16,247
2
$59,970
APPLICATIONS DENIED
2
$38,550
42
$60,772
183
$59,579
45
$18,087
10
$40,318
APPLICATIONS WITHDRAWN
1
$17,510
10
$37,789
110
$65,903
7
$23,666
6
$39,415
FILES CLOSED FOR INCOMPLETENESS
0
$0
8
$97,330
11
$69,360
0
$0
0
$0
Aggregated Statistics For Year 2002 (Based on 2 full and 8 partial tracts)
A) FHA, FSA/RHS & VA Home Purchase Loans
B) Conventional Home Purchase Loans
C) Refinancings
D) Home Improvement Loans
E) Loans on Dwellings For 5+ Families
F) Non-occupant Loans on < 5 Family Dwellings (A B C & D)
Number
Average Value
Number
Average Value
Number
Average Value
Number
Average Value
Number
Average Value
Number
Average Value
LOANS ORIGINATED
37
$60,729
62
$58,549
231
$53,847
71
$15,879
1
$196,550
14
$47,385
APPLICATIONS APPROVED, NOT ACCEPTED
0
$0
11
$50,597
48
$52,302
9
$14,740
0
$0
1
$45,880
APPLICATIONS DENIED
6
$62,295
30
$47,039
143
$57,805
40
$13,246
0
$0
2
$54,535
APPLICATIONS WITHDRAWN
1
$62,780
11
$43,643
123
$58,639
5
$13,384
0
$0
0
$0
FILES CLOSED FOR INCOMPLETENESS
0
$0
1
$68,780
9
$65,889
0
$0
0
$0
1
$27,870
Aggregated Statistics For Year 2001 (Based on 2 full and 8 partial tracts)
A) FHA, FSA/RHS & VA Home Purchase Loans
B) Conventional Home Purchase Loans
C) Refinancings
D) Home Improvement Loans
F) Non-occupant Loans on < 5 Family Dwellings (A B C & D)
Number
Average Value
Number
Average Value
Number
Average Value
Number
Average Value
Number
Average Value
LOANS ORIGINATED
28
$55,048
60
$58,443
187
$55,679
96
$18,052
10
$34,691
APPLICATIONS APPROVED, NOT ACCEPTED
0
$0
16
$46,212
33
$53,356
13
$26,708
2
$48,945
APPLICATIONS DENIED
0
$0
33
$48,509
144
$54,364
62
$14,171
17
$40,542
APPLICATIONS WITHDRAWN
2
$44,750
7
$52,576
120
$56,688
18
$19,209
8
$34,031
FILES CLOSED FOR INCOMPLETENESS
0
$0
1
$32,920
26
$84,076
3
$20,717
1
$47,170
Aggregated Statistics For Year 2000 (Based on 2 full and 8 partial tracts)
A) FHA, FSA/RHS & VA Home Purchase Loans
B) Conventional Home Purchase Loans
C) Refinancings
D) Home Improvement Loans
F) Non-occupant Loans on < 5 Family Dwellings (A B C & D)
Number
Average Value
Number
Average Value
Number
Average Value
Number
Average Value
Number
Average Value
LOANS ORIGINATED
36
$50,653
94
$59,128
96
$44,366
75
$12,562
5
$38,950
APPLICATIONS APPROVED, NOT ACCEPTED
4
$57,518
22
$44,651
17
$37,609
17
$19,098
3
$24,610
APPLICATIONS DENIED
2
$39,810
83
$33,353
104
$42,803
70
$17,196
3
$48,040
APPLICATIONS WITHDRAWN
1
$89,780
10
$32,874
49
$55,283
6
$17,508
0
$0
FILES CLOSED FOR INCOMPLETENESS
0
$0
0
$0
22
$56,504
0
$0
0
$0
Aggregated Statistics For Year 1999 (Based on 1 full and 4 partial tracts)
A) FHA, FSA/RHS & VA Home Purchase Loans
B) Conventional Home Purchase Loans
C) Refinancings
D) Home Improvement Loans
F) Non-occupant Loans on < 5 Family Dwellings (A B C & D)
2002 - 2018 National Fire Incident Reporting System (NFIRS) incidents
Based on the data from the years 2002 - 2018 the average number of fires per year is 27. The highest number of fire incidents - 48 took place in 2006, and the least - 8 in 2010. The data has a declining trend.
When looking into fire subcategories, the most incidents belonged to: Structure Fires (56.0%), and Outside Fires (26.4%).
Fire incident types reported to NFIRS in Zip Code 13407


+$349
-$2,666
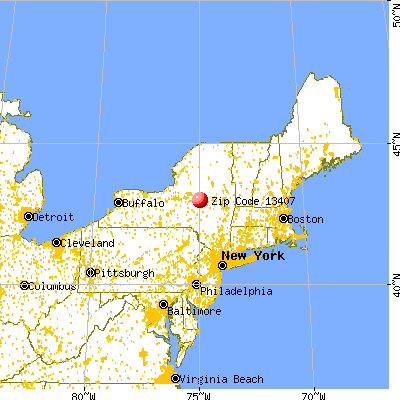
 Nearest zip codes: 13350, 13361, 13439, 13357, 13475, 13468.
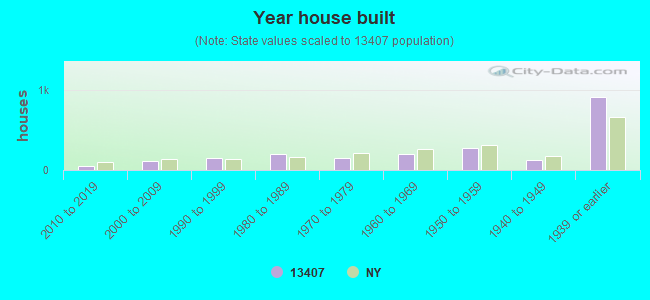


 Based on the data from the years 2002 - 2018 the average number of fires per year is 27. The highest number of fire incidents - 48 took place in 2006, and the least - 8 in 2010. The data has a declining trend.
 When looking into fire subcategories, the most incidents belonged to: Structure Fires (56.0%), and Outside Fires (26.4%).