Estimated zip code population in 2022: 10,137
Zip code population in 2010: 11,096
Zip code population in 2000: 11,555
Houses and condos: 5,247
Renter-occupied apartments: 1,389
% of renters here:
30%State:
46%
March 2022 cost of living index in zip code 13357: 97.8
(near average, U.S. average is 100)
Land area: 31.5
sq. mi.
Water area: 0.1
sq. mi.
Population density: 321 people per square mile (very low).
OSM Map
General Map
Google Map
MSN Map
OSM Map
General Map
Google Map
MSN Map
OSM Map
General Map
Google Map
MSN Map
OSM Map
General Map
Google Map
MSN Map
Please wait while loading the map...
Real estate property taxes paid for housing units in 2022:
This zip code:
2.7% ($2,796)New York:
1.5% ($6,180)
Median real estate property taxes paid for housing units with mortgages in 2022: $3,025 (2.9%)
Median real estate property taxes paid for housing units with no mortgage in 2022: $2,463 (2.3%)
Business Search - 14 Million verified businesses
Males: 4,951 Females: 5,185
For population 25 years and over in 13357:
High school or higher: 93.0%Bachelor's degree or higher: 25.4%Graduate or professional degree: 9.8%Unemployed: 3.4%Mean travel time to work (commute): 22.0 minutes
For population 15 years and over in 13357:
Never married: 25.5%Now married: 54.0%Separated: 2.3%Widowed: 7.9%Divorced: 10.4%
Zip code 13357 compared to state average:
Median house value significantly below state average. Black race population percentage significantly below state average. Hispanic race population percentage significantly below state average. Median age above state average. Foreign-born population percentage significantly below state average. Renting percentage below state average. Length of stay since moving in above state average. Number of college students below state average. Percentage of population with a bachelor's degree or higher below state average. 9,386 92.6% White 281 2.8% Hispanic or Latino 228 2.2% Two or more races 155 1.5% Black 52 0.5% Native Hawaiian and Other 33 0.3% Asian
Data:
Median household income ($)
Median household income (% change since 2000)
Household income diversity
Ratio of average income to average house value (%)
Ratio of average income to average rent
Median household income ($) - White
Median household income ($) - Black or African American
Median household income ($) - Asian
Median household income ($) - Hispanic or Latino
Median household income ($) - American Indian and Alaska Native
Median household income ($) - Multirace
Median household income ($) - Other Race
Median household income for houses/condos with a mortgage ($)
Median household income for apartments without a mortgage ($)
Races - White alone (%)
Races - White alone (% change since 2000)
Races - Black alone (%)
Races - Black alone (% change since 2000)
Races - American Indian alone (%)
Races - American Indian alone (% change since 2000)
Races - Asian alone (%)
Races - Asian alone (% change since 2000)
Races - Hispanic (%)
Races - Hispanic (% change since 2000)
Races - Native Hawaiian and Other Pacific Islander alone (%)
Races - Native Hawaiian and Other Pacific Islander alone (% change since 2000)
Races - Two or more races (%)
Races - Two or more races (% change since 2000)
Races - Other race alone (%)
Races - Other race alone (% change since 2000)
Racial diversity
Unemployment (%)
Unemployment (% change since 2000)
Unemployment (%) - White
Unemployment (%) - Black or African American
Unemployment (%) - Asian
Unemployment (%) - Hispanic or Latino
Unemployment (%) - American Indian and Alaska Native
Unemployment (%) - Multirace
Unemployment (%) - Other Race
Population density (people per square mile)
Population - Males (%)
Population - Females (%)
Population - Males (%) - White
Population - Males (%) - Black or African American
Population - Males (%) - Asian
Population - Males (%) - Hispanic or Latino
Population - Males (%) - American Indian and Alaska Native
Population - Males (%) - Multirace
Population - Males (%) - Other Race
Population - Females (%) - White
Population - Females (%) - Black or African American
Population - Females (%) - Asian
Population - Females (%) - Hispanic or Latino
Population - Females (%) - American Indian and Alaska Native
Population - Females (%) - Multirace
Population - Females (%) - Other Race
Coronavirus confirmed cases (Apr 27, 2024)
Deaths caused by coronavirus (Apr 27, 2024)
Coronavirus confirmed cases (per 100k population) (Apr 27, 2024)
Deaths caused by coronavirus (per 100k population) (Apr 27, 2024)
Daily increase in number of cases (Apr 27, 2024)
Weekly increase in number of cases (Apr 27, 2024)
Cases doubled (in days) (Apr 27, 2024)
Hospitalized patients (Apr 18, 2022)
Negative test results (Apr 18, 2022)
Total test results (Apr 18, 2022)
COVID Vaccine doses distributed (per 100k population) (Sep 19, 2023)
COVID Vaccine doses administered (per 100k population) (Sep 19, 2023)
COVID Vaccine doses distributed (Sep 19, 2023)
COVID Vaccine doses administered (Sep 19, 2023)
Likely homosexual households (%)
Likely homosexual households (% change since 2000)
Likely homosexual households - Lesbian couples (%)
Likely homosexual households - Lesbian couples (% change since 2000)
Likely homosexual households - Gay men (%)
Likely homosexual households - Gay men (% change since 2000)
Cost of living index
Median gross rent ($)
Median contract rent ($)
Median monthly housing costs ($)
Median house or condo value ($)
Median house or condo value ($ change since 2000)
Mean house or condo value by units in structure - 1, detached ($)
Mean house or condo value by units in structure - 1, attached ($)
Mean house or condo value by units in structure - 2 ($)
Mean house or condo value by units in structure by units in structure - 3 or 4 ($)
Mean house or condo value by units in structure - 5 or more ($)
Mean house or condo value by units in structure - Boat, RV, van, etc. ($)
Mean house or condo value by units in structure - Mobile home ($)
Median house or condo value ($) - White
Median house or condo value ($) - Black or African American
Median house or condo value ($) - Asian
Median house or condo value ($) - Hispanic or Latino
Median house or condo value ($) - American Indian and Alaska Native
Median house or condo value ($) - Multirace
Median house or condo value ($) - Other Race
Median resident age
Resident age diversity
Median resident age - Males
Median resident age - Females
Median resident age - White
Median resident age - Black or African American
Median resident age - Asian
Median resident age - Hispanic or Latino
Median resident age - American Indian and Alaska Native
Median resident age - Multirace
Median resident age - Other Race
Median resident age - Males - White
Median resident age - Males - Black or African American
Median resident age - Males - Asian
Median resident age - Males - Hispanic or Latino
Median resident age - Males - American Indian and Alaska Native
Median resident age - Males - Multirace
Median resident age - Males - Other Race
Median resident age - Females - White
Median resident age - Females - Black or African American
Median resident age - Females - Asian
Median resident age - Females - Hispanic or Latino
Median resident age - Females - American Indian and Alaska Native
Median resident age - Females - Multirace
Median resident age - Females - Other Race
Commute - mean travel time to work (minutes)
Travel time to work - Less than 5 minutes (%)
Travel time to work - Less than 5 minutes (% change since 2000)
Travel time to work - 5 to 9 minutes (%)
Travel time to work - 5 to 9 minutes (% change since 2000)
Travel time to work - 10 to 19 minutes (%)
Travel time to work - 10 to 19 minutes (% change since 2000)
Travel time to work - 20 to 29 minutes (%)
Travel time to work - 20 to 29 minutes (% change since 2000)
Travel time to work - 30 to 39 minutes (%)
Travel time to work - 30 to 39 minutes (% change since 2000)
Travel time to work - 40 to 59 minutes (%)
Travel time to work - 40 to 59 minutes (% change since 2000)
Travel time to work - 60 to 89 minutes (%)
Travel time to work - 60 to 89 minutes (% change since 2000)
Travel time to work - 90 or more minutes (%)
Travel time to work - 90 or more minutes (% change since 2000)
Marital status - Never married (%)
Marital status - Now married (%)
Marital status - Separated (%)
Marital status - Widowed (%)
Marital status - Divorced (%)
Median family income ($)
Median family income (% change since 2000)
Median non-family income ($)
Median non-family income (% change since 2000)
Median per capita income ($)
Median per capita income (% change since 2000)
Median family income ($) - White
Median family income ($) - Black or African American
Median family income ($) - Asian
Median family income ($) - Hispanic or Latino
Median family income ($) - American Indian and Alaska Native
Median family income ($) - Multirace
Median family income ($) - Other Race
Median year house/condo built
Median year apartment built
Year house built - Built 2005 or later (%)
Year house built - Built 2000 to 2004 (%)
Year house built - Built 1990 to 1999 (%)
Year house built - Built 1980 to 1989 (%)
Year house built - Built 1970 to 1979 (%)
Year house built - Built 1960 to 1969 (%)
Year house built - Built 1950 to 1959 (%)
Year house built - Built 1940 to 1949 (%)
Year house built - Built 1939 or earlier (%)
Average household size
Household density (households per square mile)
Average household size - White
Average household size - Black or African American
Average household size - Asian
Average household size - Hispanic or Latino
Average household size - American Indian and Alaska Native
Average household size - Multirace
Average household size - Other Race
Occupied housing units (%)
Vacant housing units (%)
Owner occupied housing units (%)
Renter occupied housing units (%)
Vacancy status - For rent (%)
Vacancy status - For sale only (%)
Vacancy status - Rented or sold, not occupied (%)
Vacancy status - For seasonal, recreational, or occasional use (%)
Vacancy status - For migrant workers (%)
Vacancy status - Other vacant (%)
Residents with income below the poverty level (%)
Residents with income below 50% of the poverty level (%)
Children below poverty level (%)
Poor families by family type - Married-couple family (%)
Poor families by family type - Male, no wife present (%)
Poor families by family type - Female, no husband present (%)
Poverty status for native-born residents (%)
Poverty status for foreign-born residents (%)
Poverty among high school graduates not in families (%)
Poverty among people who did not graduate high school not in families (%)
Residents with income below the poverty level (%) - White
Residents with income below the poverty level (%) - Black or African American
Residents with income below the poverty level (%) - Asian
Residents with income below the poverty level (%) - Hispanic or Latino
Residents with income below the poverty level (%) - American Indian and Alaska Native
Residents with income below the poverty level (%) - Multirace
Residents with income below the poverty level (%) - Other Race
Air pollution - Air Quality Index (AQI)
Air pollution - CO
Air pollution - NO2
Air pollution - SO2
Air pollution - Ozone
Air pollution - PM10
Air pollution - PM25
Air pollution - Pb
Crime - Murders per 100,000 population
Crime - Rapes per 100,000 population
Crime - Robberies per 100,000 population
Crime - Assaults per 100,000 population
Crime - Burglaries per 100,000 population
Crime - Thefts per 100,000 population
Crime - Auto thefts per 100,000 population
Crime - Arson per 100,000 population
Crime - City-data.com crime index
Crime - Violent crime index
Crime - Property crime index
Crime - Murders per 100,000 population (5 year average)
Crime - Rapes per 100,000 population (5 year average)
Crime - Robberies per 100,000 population (5 year average)
Crime - Assaults per 100,000 population (5 year average)
Crime - Burglaries per 100,000 population (5 year average)
Crime - Thefts per 100,000 population (5 year average)
Crime - Auto thefts per 100,000 population (5 year average)
Crime - Arson per 100,000 population (5 year average)
Crime - City-data.com crime index (5 year average)
Crime - Violent crime index (5 year average)
Crime - Property crime index (5 year average)
1996 Presidential Elections Results (%) - Democratic Party (Clinton)
1996 Presidential Elections Results (%) - Republican Party (Dole)
1996 Presidential Elections Results (%) - Other
2000 Presidential Elections Results (%) - Democratic Party (Gore)
2000 Presidential Elections Results (%) - Republican Party (Bush)
2000 Presidential Elections Results (%) - Other
2004 Presidential Elections Results (%) - Democratic Party (Kerry)
2004 Presidential Elections Results (%) - Republican Party (Bush)
2004 Presidential Elections Results (%) - Other
2008 Presidential Elections Results (%) - Democratic Party (Obama)
2008 Presidential Elections Results (%) - Republican Party (McCain)
2008 Presidential Elections Results (%) - Other
2012 Presidential Elections Results (%) - Democratic Party (Obama)
2012 Presidential Elections Results (%) - Republican Party (Romney)
2012 Presidential Elections Results (%) - Other
2016 Presidential Elections Results (%) - Democratic Party (Clinton)
2016 Presidential Elections Results (%) - Republican Party (Trump)
2016 Presidential Elections Results (%) - Other
2020 Presidential Elections Results (%) - Democratic Party (Biden)
2020 Presidential Elections Results (%) - Republican Party (Trump)
2020 Presidential Elections Results (%) - Other
Ancestries Reported - Arab (%)
Ancestries Reported - Czech (%)
Ancestries Reported - Danish (%)
Ancestries Reported - Dutch (%)
Ancestries Reported - English (%)
Ancestries Reported - French (%)
Ancestries Reported - French Canadian (%)
Ancestries Reported - German (%)
Ancestries Reported - Greek (%)
Ancestries Reported - Hungarian (%)
Ancestries Reported - Irish (%)
Ancestries Reported - Italian (%)
Ancestries Reported - Lithuanian (%)
Ancestries Reported - Norwegian (%)
Ancestries Reported - Polish (%)
Ancestries Reported - Portuguese (%)
Ancestries Reported - Russian (%)
Ancestries Reported - Scotch-Irish (%)
Ancestries Reported - Scottish (%)
Ancestries Reported - Slovak (%)
Ancestries Reported - Subsaharan African (%)
Ancestries Reported - Swedish (%)
Ancestries Reported - Swiss (%)
Ancestries Reported - Ukrainian (%)
Ancestries Reported - United States (%)
Ancestries Reported - Welsh (%)
Ancestries Reported - West Indian (%)
Ancestries Reported - Other (%)
Educational Attainment - No schooling completed (%)
Educational Attainment - Less than high school (%)
Educational Attainment - High school or equivalent (%)
Educational Attainment - Less than 1 year of college (%)
Educational Attainment - 1 or more years of college (%)
Educational Attainment - Associate degree (%)
Educational Attainment - Bachelor's degree (%)
Educational Attainment - Master's degree (%)
Educational Attainment - Professional school degree (%)
Educational Attainment - Doctorate degree (%)
School Enrollment - Nursery, preschool (%)
School Enrollment - Kindergarten (%)
School Enrollment - Grade 1 to 4 (%)
School Enrollment - Grade 5 to 8 (%)
School Enrollment - Grade 9 to 12 (%)
School Enrollment - College undergrad (%)
School Enrollment - Graduate or professional (%)
School Enrollment - Not enrolled in school (%)
School enrollment - Public schools (%)
School enrollment - Private schools (%)
School enrollment - Not enrolled (%)
Median number of rooms in houses and condos
Median number of rooms in apartments
Housing units lacking complete plumbing facilities (%)
Housing units lacking complete kitchen facilities (%)
Density of houses
Urban houses (%)
Rural houses (%)
Households with people 60 years and over (%)
Households with people 65 years and over (%)
Households with people 75 years and over (%)
Households with one or more nonrelatives (%)
Households with no nonrelatives (%)
Population in households (%)
Family households (%)
Nonfamily households (%)
Population in families (%)
Family households with own children (%)
Median number of bedrooms in owner occupied houses
Mean number of bedrooms in owner occupied houses
Median number of bedrooms in renter occupied houses
Mean number of bedrooms in renter occupied houses
Median number of vehichles in owner occupied houses
Mean number of vehichles in owner occupied houses
Median number of vehichles in renter occupied houses
Mean number of vehichles in renter occupied houses
Mortgage status - with mortgage (%)
Mortgage status - with second mortgage (%)
Mortgage status - with home equity loan (%)
Mortgage status - with both second mortgage and home equity loan (%)
Mortgage status - without a mortgage (%)
Average family size
Average family size - White
Average family size - Black or African American
Average family size - Asian
Average family size - Hispanic or Latino
Average family size - American Indian and Alaska Native
Average family size - Multirace
Average family size - Other Race
Geographical mobility - Same house 1 year ago (%)
Geographical mobility - Moved within same county (%)
Geographical mobility - Moved from different county within same state (%)
Geographical mobility - Moved from different state (%)
Geographical mobility - Moved from abroad (%)
Place of birth - Born in state of residence (%)
Place of birth - Born in other state (%)
Place of birth - Native, outside of US (%)
Place of birth - Foreign born (%)
Housing units in structures - 1, detached (%)
Housing units in structures - 1, attached (%)
Housing units in structures - 2 (%)
Housing units in structures - 3 or 4 (%)
Housing units in structures - 5 to 9 (%)
Housing units in structures - 10 to 19 (%)
Housing units in structures - 20 to 49 (%)
Housing units in structures - 50 or more (%)
Housing units in structures - Mobile home (%)
Housing units in structures - Boat, RV, van, etc. (%)
House/condo owner moved in on average (years ago)
Renter moved in on average (years ago)
Year householder moved into unit - Moved in 1999 to March 2000 (%)
Year householder moved into unit - Moved in 1995 to 1998 (%)
Year householder moved into unit - Moved in 1990 to 1994 (%)
Year householder moved into unit - Moved in 1980 to 1989 (%)
Year householder moved into unit - Moved in 1970 to 1979 (%)
Year householder moved into unit - Moved in 1969 or earlier (%)
Means of transportation to work - Drove car alone (%)
Means of transportation to work - Carpooled (%)
Means of transportation to work - Public transportation (%)
Means of transportation to work - Bus or trolley bus (%)
Means of transportation to work - Streetcar or trolley car (%)
Means of transportation to work - Subway or elevated (%)
Means of transportation to work - Railroad (%)
Means of transportation to work - Ferryboat (%)
Means of transportation to work - Taxicab (%)
Means of transportation to work - Motorcycle (%)
Means of transportation to work - Bicycle (%)
Means of transportation to work - Walked (%)
Means of transportation to work - Other means (%)
Working at home (%)
Industry diversity
Most Common Industries - Agriculture, forestry, fishing and hunting, and mining (%)
Most Common Industries - Agriculture, forestry, fishing and hunting (%)
Most Common Industries - Mining, quarrying, and oil and gas extraction (%)
Most Common Industries - Construction (%)
Most Common Industries - Manufacturing (%)
Most Common Industries - Wholesale trade (%)
Most Common Industries - Retail trade (%)
Most Common Industries - Transportation and warehousing, and utilities (%)
Most Common Industries - Transportation and warehousing (%)
Most Common Industries - Utilities (%)
Most Common Industries - Information (%)
Most Common Industries - Finance and insurance, and real estate and rental and leasing (%)
Most Common Industries - Finance and insurance (%)
Most Common Industries - Real estate and rental and leasing (%)
Most Common Industries - Professional, scientific, and management, and administrative and waste management services (%)
Most Common Industries - Professional, scientific, and technical services (%)
Most Common Industries - Management of companies and enterprises (%)
Most Common Industries - Administrative and support and waste management services (%)
Most Common Industries - Educational services, and health care and social assistance (%)
Most Common Industries - Educational services (%)
Most Common Industries - Health care and social assistance (%)
Most Common Industries - Arts, entertainment, and recreation, and accommodation and food services (%)
Most Common Industries - Arts, entertainment, and recreation (%)
Most Common Industries - Accommodation and food services (%)
Most Common Industries - Other services, except public administration (%)
Most Common Industries - Public administration (%)
Occupation diversity
Most Common Occupations - Management, business, science, and arts occupations (%)
Most Common Occupations - Management, business, and financial occupations (%)
Most Common Occupations - Management occupations (%)
Most Common Occupations - Business and financial operations occupations (%)
Most Common Occupations - Computer, engineering, and science occupations (%)
Most Common Occupations - Computer and mathematical occupations (%)
Most Common Occupations - Architecture and engineering occupations (%)
Most Common Occupations - Life, physical, and social science occupations (%)
Most Common Occupations - Education, legal, community service, arts, and media occupations (%)
Most Common Occupations - Community and social service occupations (%)
Most Common Occupations - Legal occupations (%)
Most Common Occupations - Education, training, and library occupations (%)
Most Common Occupations - Arts, design, entertainment, sports, and media occupations (%)
Most Common Occupations - Healthcare practitioners and technical occupations (%)
Most Common Occupations - Health diagnosing and treating practitioners and other technical occupations (%)
Most Common Occupations - Health technologists and technicians (%)
Most Common Occupations - Service occupations (%)
Most Common Occupations - Healthcare support occupations (%)
Most Common Occupations - Protective service occupations (%)
Most Common Occupations - Fire fighting and prevention, and other protective service workers including supervisors (%)
Most Common Occupations - Law enforcement workers including supervisors (%)
Most Common Occupations - Food preparation and serving related occupations (%)
Most Common Occupations - Building and grounds cleaning and maintenance occupations (%)
Most Common Occupations - Personal care and service occupations (%)
Most Common Occupations - Sales and office occupations (%)
Most Common Occupations - Sales and related occupations (%)
Most Common Occupations - Office and administrative support occupations (%)
Most Common Occupations - Natural resources, construction, and maintenance occupations (%)
Most Common Occupations - Farming, fishing, and forestry occupations (%)
Most Common Occupations - Construction and extraction occupations (%)
Most Common Occupations - Installation, maintenance, and repair occupations (%)
Most Common Occupations - Production, transportation, and material moving occupations (%)
Most Common Occupations - Production occupations (%)
Most Common Occupations - Transportation occupations (%)
Most Common Occupations - Material moving occupations (%)
People in Group quarters - Institutionalized population (%)
People in Group quarters - Correctional institutions (%)
People in Group quarters - Federal prisons and detention centers (%)
People in Group quarters - Halfway houses (%)
People in Group quarters - Local jails and other confinement facilities (including police lockups) (%)
People in Group quarters - Military disciplinary barracks (%)
People in Group quarters - State prisons (%)
People in Group quarters - Other types of correctional institutions (%)
People in Group quarters - Nursing homes (%)
People in Group quarters - Hospitals/wards, hospices, and schools for the handicapped (%)
People in Group quarters - Hospitals/wards and hospices for chronically ill (%)
People in Group quarters - Hospices or homes for chronically ill (%)
People in Group quarters - Military hospitals or wards for chronically ill (%)
People in Group quarters - Other hospitals or wards for chronically ill (%)
People in Group quarters - Hospitals or wards for drug/alcohol abuse (%)
People in Group quarters - Mental (Psychiatric) hospitals or wards (%)
People in Group quarters - Schools, hospitals, or wards for the mentally retarded (%)
People in Group quarters - Schools, hospitals, or wards for the physically handicapped (%)
People in Group quarters - Institutions for the deaf (%)
People in Group quarters - Institutions for the blind (%)
People in Group quarters - Orthopedic wards and institutions for the physically handicapped (%)
People in Group quarters - Wards in general hospitals for patients who have no usual home elsewhere (%)
People in Group quarters - Wards in military hospitals for patients who have no usual home elsewhere (%)
People in Group quarters - Juvenile institutions (%)
People in Group quarters - Long-term care (%)
People in Group quarters - Homes for abused, dependent, and neglected children (%)
People in Group quarters - Residential treatment centers for emotionally disturbed children (%)
People in Group quarters - Training schools for juvenile delinquents (%)
People in Group quarters - Short-term care, detention or diagnostic centers for delinquent children (%)
People in Group quarters - Type of juvenile institution unknown (%)
People in Group quarters - Noninstitutionalized population (%)
People in Group quarters - College dormitories (includes college quarters off campus) (%)
People in Group quarters - Military quarters (%)
People in Group quarters - On base (%)
People in Group quarters - Barracks, unaccompanied personnel housing (UPH), (Enlisted/Officer), ;and similar group living quarters for military personnel (%)
People in Group quarters - Transient quarters for temporary residents (%)
People in Group quarters - Military ships (%)
People in Group quarters - Group homes (%)
People in Group quarters - Homes or halfway houses for drug/alcohol abuse (%)
People in Group quarters - Homes for the mentally ill (%)
People in Group quarters - Homes for the mentally retarded (%)
People in Group quarters - Homes for the physically handicapped (%)
People in Group quarters - Other group homes (%)
People in Group quarters - Religious group quarters (%)
People in Group quarters - Dormitories (%)
People in Group quarters - Agriculture workers' dormitories on farms (%)
People in Group quarters - Job Corps and vocational training facilities (%)
People in Group quarters - Other workers' dormitories (%)
People in Group quarters - Crews of maritime vessels (%)
People in Group quarters - Other nonhousehold living situations (%)
People in Group quarters - Other noninstitutional group quarters (%)
Residents speaking English at home (%)
Residents speaking English at home - Born in the United States (%)
Residents speaking English at home - Native, born elsewhere (%)
Residents speaking English at home - Foreign born (%)
Residents speaking Spanish at home (%)
Residents speaking Spanish at home - Born in the United States (%)
Residents speaking Spanish at home - Native, born elsewhere (%)
Residents speaking Spanish at home - Foreign born (%)
Residents speaking other language at home (%)
Residents speaking other language at home - Born in the United States (%)
Residents speaking other language at home - Native, born elsewhere (%)
Residents speaking other language at home - Foreign born (%)
Class of Workers - Employee of private company (%)
Class of Workers - Self-employed in own incorporated business (%)
Class of Workers - Private not-for-profit wage and salary workers (%)
Class of Workers - Local government workers (%)
Class of Workers - State government workers (%)
Class of Workers - Federal government workers (%)
Class of Workers - Self-employed workers in own not incorporated business and Unpaid family workers (%)
House heating fuel used in houses and condos - Utility gas (%)
House heating fuel used in houses and condos - Bottled, tank, or LP gas (%)
House heating fuel used in houses and condos - Electricity (%)
House heating fuel used in houses and condos - Fuel oil, kerosene, etc. (%)
House heating fuel used in houses and condos - Coal or coke (%)
House heating fuel used in houses and condos - Wood (%)
House heating fuel used in houses and condos - Solar energy (%)
House heating fuel used in houses and condos - Other fuel (%)
House heating fuel used in houses and condos - No fuel used (%)
House heating fuel used in apartments - Utility gas (%)
House heating fuel used in apartments - Bottled, tank, or LP gas (%)
House heating fuel used in apartments - Electricity (%)
House heating fuel used in apartments - Fuel oil, kerosene, etc. (%)
House heating fuel used in apartments - Coal or coke (%)
House heating fuel used in apartments - Wood (%)
House heating fuel used in apartments - Solar energy (%)
House heating fuel used in apartments - Other fuel (%)
House heating fuel used in apartments - No fuel used (%)
Armed forces status - In Armed Forces (%)
Armed forces status - Civilian (%)
Armed forces status - Civilian - Veteran (%)
Armed forces status - Civilian - Nonveteran (%)
Fatal accidents locations in years 2005-2021
Fatal accidents locations in 2005
Fatal accidents locations in 2006
Fatal accidents locations in 2007
Fatal accidents locations in 2008
Fatal accidents locations in 2009
Fatal accidents locations in 2010
Fatal accidents locations in 2011
Fatal accidents locations in 2012
Fatal accidents locations in 2013
Fatal accidents locations in 2014
Fatal accidents locations in 2015
Fatal accidents locations in 2016
Fatal accidents locations in 2017
Fatal accidents locations in 2018
Fatal accidents locations in 2019
Fatal accidents locations in 2020
Fatal accidents locations in 2021
Alcohol use - People drinking some alcohol every month (%)
Alcohol use - People not drinking at all (%)
Alcohol use - Average days/month drinking alcohol
Alcohol use - Average drinks/week
Alcohol use - Average days/year people drink much
Audiometry - Average condition of hearing (%)
Audiometry - People that can hear a whisper from across a quiet room (%)
Audiometry - People that can hear normal voice from across a quiet room (%)
Audiometry - Ears ringing, roaring, buzzing (%)
Audiometry - Had a job exposure to loud noise (%)
Audiometry - Had off-work exposure to loud noise (%)
Blood Pressure & Cholesterol - Has high blood pressure (%)
Blood Pressure & Cholesterol - Checking blood pressure at home (%)
Blood Pressure & Cholesterol - Frequently checking blood cholesterol (%)
Blood Pressure & Cholesterol - Has high cholesterol level (%)
Consumer Behavior - Money monthly spent on food at supermarket/grocery store
Consumer Behavior - Money monthly spent on food at other stores
Consumer Behavior - Money monthly spent on eating out
Consumer Behavior - Money monthly spent on carryout/delivered foods
Consumer Behavior - Income spent on food at supermarket/grocery store (%)
Consumer Behavior - Income spent on food at other stores (%)
Consumer Behavior - Income spent on eating out (%)
Consumer Behavior - Income spent on carryout/delivered foods (%)
Current Health Status - General health condition (%)
Current Health Status - Blood donors (%)
Current Health Status - Has blood ever tested for HIV virus (%)
Current Health Status - Left-handed people (%)
Dermatology - People using sunscreen (%)
Diabetes - Diabetics (%)
Diabetes - Had a blood test for high blood sugar (%)
Diabetes - People taking insulin (%)
Diet Behavior & Nutrition - Diet health (%)
Diet Behavior & Nutrition - Milk product consumption (# of products/month)
Diet Behavior & Nutrition - Meals not home prepared (#/week)
Diet Behavior & Nutrition - Meals from fast food or pizza place (#/week)
Diet Behavior & Nutrition - Ready-to-eat foods (#/month)
Diet Behavior & Nutrition - Frozen meals/pizza (#/month)
Drug Use - People that ever used marijuana or hashish (%)
Drug Use - Ever used hard drugs (%)
Drug Use - Ever used any form of cocaine (%)
Drug Use - Ever used heroin (%)
Drug Use - Ever used methamphetamine (%)
Health Insurance - People covered by health insurance (%)
Kidney Conditions-Urology - Avg. # of times urinating at night
Medical Conditions - People with asthma (%)
Medical Conditions - People with anemia (%)
Medical Conditions - People with psoriasis (%)
Medical Conditions - People with overweight (%)
Medical Conditions - Elderly people having difficulties in thinking or remembering (%)
Medical Conditions - People who ever received blood transfusion (%)
Medical Conditions - People having trouble seeing even with glass/contacts (%)
Medical Conditions - People with arthritis (%)
Medical Conditions - People with gout (%)
Medical Conditions - People with congestive heart failure (%)
Medical Conditions - People with coronary heart disease (%)
Medical Conditions - People with angina pectoris (%)
Medical Conditions - People who ever had heart attack (%)
Medical Conditions - People who ever had stroke (%)
Medical Conditions - People with emphysema (%)
Medical Conditions - People with thyroid problem (%)
Medical Conditions - People with chronic bronchitis (%)
Medical Conditions - People with any liver condition (%)
Medical Conditions - People who ever had cancer or malignancy (%)
Mental Health - People who have little interest in doing things (%)
Mental Health - People feeling down, depressed, or hopeless (%)
Mental Health - People who have trouble sleeping or sleeping too much (%)
Mental Health - People feeling tired or having little energy (%)
Mental Health - People with poor appetite or overeating (%)
Mental Health - People feeling bad about themself (%)
Mental Health - People who have trouble concentrating on things (%)
Mental Health - People moving or speaking slowly or too fast (%)
Mental Health - People having thoughts they would be better off dead (%)
Oral Health - Average years since last visit a dentist
Oral Health - People embarrassed because of mouth (%)
Oral Health - People with gum disease (%)
Oral Health - General health of teeth and gums (%)
Oral Health - Average days a week using dental floss/device
Oral Health - Average days a week using mouthwash for dental problem
Oral Health - Average number of teeth
Pesticide Use - Households using pesticides to control insects (%)
Pesticide Use - Households using pesticides to kill weeds (%)
Physical Activity - People doing vigorous-intensity work activities (%)
Physical Activity - People doing moderate-intensity work activities (%)
Physical Activity - People walking or bicycling (%)
Physical Activity - People doing vigorous-intensity recreational activities (%)
Physical Activity - People doing moderate-intensity recreational activities (%)
Physical Activity - Average hours a day doing sedentary activities
Physical Activity - Average hours a day watching TV or videos
Physical Activity - Average hours a day using computer
Physical Functioning - People having limitations keeping them from working (%)
Physical Functioning - People limited in amount of work they can do (%)
Physical Functioning - People that need special equipment to walk (%)
Physical Functioning - People experiencing confusion/memory problems (%)
Physical Functioning - People requiring special healthcare equipment (%)
Prescription Medications - Average number of prescription medicines taking
Preventive Aspirin Use - Adults 40+ taking low-dose aspirin (%)
Reproductive Health - Vaginal deliveries (%)
Reproductive Health - Cesarean deliveries (%)
Reproductive Health - Deliveries resulted in a live birth (%)
Reproductive Health - Pregnancies resulted in a delivery (%)
Reproductive Health - Women breastfeeding newborns (%)
Reproductive Health - Women that had a hysterectomy (%)
Reproductive Health - Women that had both ovaries removed (%)
Reproductive Health - Women that have ever taken birth control pills (%)
Reproductive Health - Women taking birth control pills (%)
Reproductive Health - Women that have ever used Depo-Provera or injectables (%)
Reproductive Health - Women that have ever used female hormones (%)
Sexual Behavior - People 18+ that ever had sex (vaginal, anal, or oral) (%)
Sexual Behavior - Males 18+ that ever had vaginal sex with a woman (%)
Sexual Behavior - Males 18+ that ever performed oral sex on a woman (%)
Sexual Behavior - Males 18+ that ever had anal sex with a woman (%)
Sexual Behavior - Males 18+ that ever had any sex with a man (%)
Sexual Behavior - Females 18+ that ever had vaginal sex with a man (%)
Sexual Behavior - Females 18+ that ever performed oral sex on a man (%)
Sexual Behavior - Females 18+ that ever had anal sex with a man (%)
Sexual Behavior - Females 18+ that ever had any kind of sex with a woman (%)
Sexual Behavior - Average age people first had sex
Sexual Behavior - Average number of female sex partners in lifetime (males 18+)
Sexual Behavior - Average number of female vaginal sex partners in lifetime (males 18+)
Sexual Behavior - Average age people first performed oral sex on a woman (18+)
Sexual Behavior - Average number of woman performed oral sex on in lifetime (18+)
Sexual Behavior - Average number of male sex partners in lifetime (males 18+)
Sexual Behavior - Average number of male anal sex partners in lifetime (males 18+)
Sexual Behavior - Average age people first performed oral sex on a man (18+)
Sexual Behavior - Average number of male oral sex partners in lifetime (18+)
Sexual Behavior - People using protection when performing oral sex (%)
Sexual Behavior - Average number of times people have vaginal or anal sex a year
Sexual Behavior - People having sex without condom (%)
Sexual Behavior - Average number of male sex partners in lifetime (females 18+)
Sexual Behavior - Average number of male vaginal sex partners in lifetime (females 18+)
Sexual Behavior - Average number of female sex partners in lifetime (females 18+)
Sexual Behavior - Circumcised males 18+ (%)
Sleep Disorders - Average hours sleeping at night
Sleep Disorders - People that has trouble sleeping (%)
Smoking-Cigarette Use - People smoking cigarettes (%)
Taste & Smell - People 40+ having problems with smell (%)
Taste & Smell - People 40+ having problems with taste (%)
Taste & Smell - People 40+ that ever had wisdom teeth removed (%)
Taste & Smell - People 40+ that ever had tonsils teeth removed (%)
Taste & Smell - People 40+ that ever had a loss of consciousness because of a head injury (%)
Taste & Smell - People 40+ that ever had a broken nose or other serious injury to face or skull (%)
Taste & Smell - People 40+ that ever had two or more sinus infections (%)
Weight - Average height (inches)
Weight - Average weight (pounds)
Weight - Average BMI
Weight - People that are obese (%)
Weight - People that ever were obese (%)
Weight - People trying to lose weight (%)
Urban population: 8,446
Rural population: 1,690
Estimated median house/condo value in 2022: $103,722
13357:
$103,722New York:
$400,400
Median resident age: This zip code:
45.7 yearsNew York median age:
40.0 years
Average household size: This zip code:
2.2 peopleNew York:
2.5 people
Averages for the 2020 tax year for zip code 13357, filed in 2021:
Average Adjusted Gross Income (AGI) in 2020: $50,058 (Individual Income Tax Returns) Here:
$50,058State:
$90,930
Salary/wage: $43,325 (reported on 82.9% of returns )Here:
$43,325State:
$72,104
(% of AGI for various income ranges: 1122.4% for AGIs below $25k , 3369.8% for AGIs $25k-50k , 6078.9% for AGIs $50k-75k , 8647.9% for AGIs $75k-100k , 16268.4% for AGIs $100k-200k , 63130.0% for AGIs over 200k ) Taxable interest for individuals: $756 (reported on 32.4% of returns )This zip code:
$756New York:
$3,075
(% of AGI for various income ranges: 16.2% for AGIs below $25k , 7.9% for AGIs $25k-50k , 41.5% for AGIs $50k-75k , 51.2% for AGIs $75k-100k , 157.6% for AGIs $100k-200k , 450.0% for AGIs over 200k ) Ordinary dividends: $2,138 (reported on 13.7% of returns )(% of AGI for various income ranges: 11.8% for AGIs below $25k , 14.8% for AGIs $25k-50k , 58.0% for AGIs $50k-75k , 31.8% for AGIs $75k-100k , 131.6% for AGIs $100k-200k , 1590.0% for AGIs over 200k ) Net capital gain/loss in AGI: +$6,162 (reported on 9.9% of returns )Here:
+$6,162State:
+$44,925
(% of AGI for various income ranges: 5.2% for AGIs below $25k , 9.4% for AGIs $25k-50k , 66.7% for AGIs $50k-75k , 92.4% for AGIs $75k-100k , 264.0% for AGIs $100k-200k , 6955.0% for AGIs over 200k ) Profit/loss from business: +$9,811 (reported on 8.0% of returns )Here:
+$9,811State:
+$14,940
(% of AGI for various income ranges: 42.3% for AGIs below $25k , 43.7% for AGIs $25k-50k , 131.9% for AGIs $50k-75k , 89.7% for AGIs $75k-100k , 670.0% for AGIs $100k-200k ) Taxable individual retirement arrangement distribution: $11,973 (reported on 8.6% of returns )13357:
$11,973New York:
$19,609
(% of AGI for various income ranges: 47.6% for AGIs below $25k , 70.4% for AGIs $25k-50k , 154.4% for AGIs $50k-75k , 195.8% for AGIs $75k-100k , 792.4% for AGIs $100k-200k ) Total itemized deductions: $29,338 (reported on 1.7% of returns )Here:
$29,338State:
$39,326
(% of AGI for various income ranges: 64.8% for AGIs $25k-50k , 195.5% for AGIs $75k-100k , 348.8% for AGIs $100k-200k ) Charity contributions: $3,940 (reported on 1.1% of returns )(% of AGI for various income ranges: 12.4% for AGIs $50k-75k , 52.0% for AGIs $100k-200k ) Taxes paid: $6,462 (reported on 1.7% of returns )(% of AGI for various income ranges: 10.8% for AGIs $25k-50k , 46.4% for AGIs $75k-100k , 90.4% for AGIs $100k-200k ) Earned income credit: $2,189 (reported on 18.7% of returns )(% of AGI for various income ranges: 89.7% for AGIs below $25k , 71.6% for AGIs $25k-50k ) Percentage of individuals using paid preparers for their 2020 taxes: 95.8%(% for various income ranges: 94.1% for AGIs below $25k , 97.4% for AGIs $25k-50k , 97.2% for AGIs $50k-75k , 95.6% for AGIs $75k-100k , 95.6% for AGIs $100k-200k , 87.5% for AGIs over 200k )
Averages for the 2012 tax year for zip code 13357, filed in 2013:
Average Adjusted Gross Income (AGI) in 2012: $40,963 (Individual Income Tax Returns) Here:
$40,963State:
$77,088
Salary/wage: $37,025 (reported on 86.2% of returns )Here:
$37,025State:
$60,593
(% of AGI for various income ranges: 75.6% for AGIs below $25k , 81.6% for AGIs $25k-50k , 77.6% for AGIs $50k-75k , 78.1% for AGIs $75k-100k , 79.2% for AGIs $100k-200k , 56.9% for AGIs over 200k ) Taxable interest for individuals: $605 (reported on 34.5% of returns )This zip code:
$605New York:
$3,125
(% of AGI for various income ranges: 0.9% for AGIs below $25k , 0.3% for AGIs $25k-50k , 0.4% for AGIs $50k-75k , 0.3% for AGIs $75k-100k , 0.9% for AGIs $100k-200k ) Ordinary dividends: $1,749 (reported on 17.5% of returns )(% of AGI for various income ranges: 0.7% for AGIs below $25k , 0.5% for AGIs $25k-50k , 0.7% for AGIs $50k-75k , 0.6% for AGIs $75k-100k , 1.4% for AGIs $100k-200k ) Net capital gain/loss in AGI: +$1,702 (reported on 8.8% of returns )Here:
+$1,702State:
+$42,474
(% of AGI for various income ranges: 0.1% for AGIs $25k-50k , 0.5% for AGIs $50k-75k , 0.3% for AGIs $75k-100k , 0.9% for AGIs $100k-200k ) Profit/loss from business: +$7,435 (reported on 9.4% of returns )Here:
+$7,435State:
+$16,168
(% of AGI for various income ranges: 3.9% for AGIs below $25k , 1.3% for AGIs $25k-50k , 1.6% for AGIs $50k-75k , 1.5% for AGIs $75k-100k , 1.4% for AGIs $100k-200k ) Taxable individual retirement arrangement distribution: $8,882 (reported on 8.2% of returns )13357:
$8,882New York:
$17,621
(% of AGI for various income ranges: 2.5% for AGIs below $25k , 1.7% for AGIs $25k-50k , 1.6% for AGIs $50k-75k , 1.7% for AGIs $75k-100k , 1.9% for AGIs $100k-200k ) Total itemized deductions: $16,886 (20% of AGI, reported on 17.5% of returns )Here:
$16,886State:
$34,985
Here:
20.1% of AGIState:
21.3% of AGI
(% of AGI for various income ranges: 3.0% for AGIs below $25k , 4.5% for AGIs $25k-50k , 6.7% for AGIs $50k-75k , 8.5% for AGIs $75k-100k , 12.0% for AGIs $100k-200k , 11.3% for AGIs over 200k ) Charity contributions: $2,042 (reported on 13.1% of returns )(% of AGI for various income ranges: 0.1% for AGIs below $25k , 0.3% for AGIs $25k-50k , 0.6% for AGIs $50k-75k , 0.7% for AGIs $75k-100k , 1.3% for AGIs $100k-200k , 1.4% for AGIs over 200k ) Taxes paid: $7,770 (reported on 17.2% of returns )13357:
$7,770State:
$18,656
(% of AGI for various income ranges: 0.7% for AGIs below $25k , 1.6% for AGIs $25k-50k , 2.6% for AGIs $50k-75k , 3.9% for AGIs $75k-100k , 6.4% for AGIs $100k-200k , 8.3% for AGIs over 200k ) Earned income credit: $2,315 (reported on 20.7% of returns )(% of AGI for various income ranges: 6.9% for AGIs below $25k , 1.1% for AGIs $25k-50k ) Percentage of individuals using paid preparers for their 2012 taxes: 47.8%(% for various income ranges: 41.1% for AGIs below $25k , 46.7% for AGIs $25k-50k , 57.7% for AGIs $50k-75k , 57.5% for AGIs $75k-100k , 66.7% for AGIs $100k-200k )
Averages for the 2004 tax year for zip code 13357, filed in 2005:
Average Adjusted Gross Income (AGI) in 2004: $33,289 (Individual Income Tax Returns) Here:
$33,289State:
$59,519
Salary/wage: $31,327 (reported on 87.0% of returns )Here:
$31,327State:
$50,673
(% of AGI for various income ranges: 87.5% for AGIs below $10k , 76.0% for AGIs $10k-25k , 83.7% for AGIs $25k-50k , 83.9% for AGIs $50k-75k , 86.7% for AGIs $75k-100k , 73.8% for AGIs over 100k ) Taxable interest for individuals: $802 (reported on 42.5% of returns )This zip code:
$802New York:
$2,377
(% of AGI for various income ranges: 3.0% for AGIs below $10k , 1.4% for AGIs $10k-25k , 0.6% for AGIs $25k-50k , 1.0% for AGIs $50k-75k , 0.5% for AGIs $75k-100k , 1.6% for AGIs over 100k ) Taxable dividends: $1,190 (reported on 22.3% of returns )(% of AGI for various income ranges: 1.8% for AGIs below $10k , 0.9% for AGIs $10k-25k , 0.6% for AGIs $25k-50k , 0.7% for AGIs $50k-75k , 0.4% for AGIs $75k-100k , 1.6% for AGIs over 100k ) Net capital gain/loss: +$1,221 (reported on 13.3% of returns )Here:
+$1,221State:
+$23,581
(% of AGI for various income ranges: -1.0% for AGIs below $10k , -0.1% for AGIs $10k-25k , 0.2% for AGIs $25k-50k , 0.6% for AGIs $50k-75k , 0.2% for AGIs $75k-100k , 2.1% for AGIs over 100k ) Profit/loss from business: +$4,348 (reported on 9.2% of returns )Here:
+$4,348State:
+$13,809
(% of AGI for various income ranges: -5.9% for AGIs below $10k , 3.6% for AGIs $10k-25k , 1.5% for AGIs $25k-50k , 1.0% for AGIs $50k-75k , 0.8% for AGIs $75k-100k , 0.4% for AGIs over 100k ) IRA payment deduction: $2,524 (reported on 1.7% of returns )13357:
$2,524New York:
$3,115
(% of AGI for various income ranges: 0.0% for AGIs $10k-25k , 0.2% for AGIs $25k-50k , 0.1% for AGIs $50k-75k , 0.2% for AGIs $75k-100k ) Total itemized deductions: $14,055 (21% of AGI, reported on 17.6% of returns )Here:
$14,055State:
$25,864
Here:
20.6% of AGIState:
21.9% of AGI
(% of AGI for various income ranges: 3.2% for AGIs below $10k , 2.9% for AGIs $10k-25k , 5.5% for AGIs $25k-50k , 7.5% for AGIs $50k-75k , 11.0% for AGIs $75k-100k , 13.6% for AGIs over 100k ) Charity contributions deductions: $1,964 (3% of AGI, reported on 15.3% of returns )Here:
2.7% of AGIState:
3.6% of AGI
(% of AGI for various income ranges: 0.1% for AGIs below $10k , 0.2% for AGIs $10k-25k , 0.6% for AGIs $25k-50k , 0.9% for AGIs $50k-75k , 1.2% for AGIs $75k-100k , 2.0% for AGIs over 100k ) Total tax: $3,795 (reported on 71.8% of returns )13357:
$3,795State:
$11,730
(% of AGI for various income ranges: 1.9% for AGIs below $10k , 3.9% for AGIs $10k-25k , 6.3% for AGIs $25k-50k , 8.6% for AGIs $50k-75k , 10.0% for AGIs $75k-100k , 15.6% for AGIs over 100k ) Earned income credit: $1,734 (reported on 18.8% of returns )Percentage of individuals using paid preparers for their 2004 taxes: 54.4%(% for various income ranges: 48.1% for AGIs below $10k , 53.7% for AGIs $10k-25k , 55.5% for AGIs $25k-50k , 58.6% for AGIs $50k-75k , 59.5% for AGIs $75k-100k , 65.8% for AGIs over 100k )
Estimated median household income in 2022: This zip code:
$68,761New York:
$79,557
Nearest zip codes: 13340 ,
13350 ,
13322 ,
13407 ,
13491 ,
13439 .
Percentage of family households: This zip code:
37.5%New York:
41.3%
Percentage of households with unmarried partners: This zip code:
11.4%New York:
42.3%
Likely homosexual households (counted as self-reported same-sex unmarried-partner households)
Lesbian couples: 1.0% of all households Gay men: 0.2% of all households
Household received Food Stamps/SNAP in the past 12 months: 959Household did not receive Food Stamps/SNAP in the past 12 months: 3,647
Women who had a birth in the past 12 months: 211 (128 now married , 83 unmarried) Women who did not have a birth in the past 12 months: 1,660 (824 now married , 825 unmarried)
Housing units in zip code 13357 with a mortgage: 1,688 (120
second mortgage , 122
both second mortgage and home equity loan )
Houses without a mortgage: 67
Median monthly owner costs for units with a mortgage: $1,064
Median monthly owner costs for units without a mortgage: $475
Residents with income below the poverty level in 2022:
This zip code:
12.0%Whole state:
14.3%
Residents with income below 50% of the poverty level in 2022:
This zip code:
6.9%Whole state:
6.8%
Median number of rooms in houses and condos: Median number of rooms in apartments: Notable locations in this zip code not listed on our city pages
Click to draw/clear zip code borders Notable locations in zip code 13357: (A) , Doty's Golf Course (B) , Clapsaddle Farm (C) , Niagara-Mohawk Power Corporation Ilion Sub-Station (D) , Capitol Theatre (E) , Ilion Municipal Building (F) , Ilion Free Public Library (G) , Mohawk Valley Nursing Home (H) , Ilion Central Fire Station (I) , Cedarville Fire Department (J) , Remington Arms Company Fire Brigade (K) . Display/hide their locations on the map
Churches in zip code 13357 include: (A) , First Presbyterian Church (B) , Saint Augustine's Episcopal Church (C) , Church of the Annunciation (D) , Morning Star United Methodist Church (E) , First Baptist Church (F) , Annunciation Church (G) , Peoples Undenominational Church (H) . Display/hide their locations on the map
Cemeteries: (1) , North Columbia Church Cemetery (2) , Fulmer Cemetery (3) , Armory Hill Cemetery (4) . Display/hide their locations on the map
Lakes and reservoirs: (A) , Wheelock Pond (B) , Ilion Reservoir Number One (C) , Ilion Reservoir Number Two (D) . Display/hide their locations on the map
Creek: (A) . Display/hide its location on the map
Parks in zip code 13357 include: (1) , Ilion Park (2) . Display/hide their locations on the map
Year house built (houses)
68 2020 or later108 2010 to 2019128 2000 to 2009159 1990 to 1999401 1980 to 1989485 1970 to 1979479 1960 to 1969679 1950 to 1959441 1940 to 19492,217 1939 or earlier
Zip code 13357 household income distribution in 2022 354 Less than $10,000263 $10,000 to $14,999241 $15,000 to $19,999144 $20,000 to $24,999170 $25,000 to $29,999149 $30,000 to $34,999112 $35,000 to $39,999118 $40,000 to $44,999207 $45,000 to $49,999257 $50,000 to $59,999539 $60,000 to $74,999925 $75,000 to $99,999390 $100,000 to $124,999334 $125,000 to $149,999227 $150,000 to $199,999158 $200,000 or moreEstimate of home value of owner-occupied houses/condos in 2022 in zip code 13357 16 Less than $10,00028 $10,000 to $14,99932 $15,000 to $19,99973 $20,000 to $24,99921 $25,000 to $29,9998 $30,000 to $34,99937 $35,000 to $39,99973 $40,000 to $49,999223 $50,000 to $59,999251 $60,000 to $69,999189 $70,000 to $79,999343 $80,000 to $89,999221 $90,000 to $99,999330 $100,000 to $124,999263 $125,000 to $149,999380 $150,000 to $174,999109 $175,000 to $199,999147 $200,000 to $249,99969 $250,000 to $299,99989 $300,000 to $399,99932 $400,000 to $499,9994 $500,000 to $749,99926 $750,000 to $999,999Rent paid by renters in 2022 in zip code 13357 72 $150 to $19933 $200 to $249156 $250 to $29954 $300 to $34927 $400 to $44992 $450 to $49951 $500 to $54970 $550 to $59956 $600 to $64932 $650 to $699218 $700 to $74933 $750 to $799134 $800 to $89942 $900 to $99911 $1,000 to $1,24950 $1,250 to $1,49910 $1,500 to $1,99921 $2,000 to $2,49914 $2,500 to $2,999181 No cash rent
Median gross rent in 2022: $705.
Estimated median house (or condo) value in 2022 for: White Non-Hispanic householders: $108,749Black or African American householders: $86,966Two or more races householders: $100,538Hispanic or Latino householders: $92,160Estimated median house or condo value in 2022: $103,722
13357:
$103,722New York:
$400,400
Lower value quartile - upper value quartile: $77,858 - $157,363
Mean price in 2022: Detached houses: $137,113Here:
$137,113State:
$476,719
Townhouses or other attached units: $112,545Here:
$112,545State:
$699,270
In 2-unit structures: $67,581Here:
$67,581State:
$713,077
Mobile homes: $52,050Here:
$52,050State:
$88,925
Housing units in structures:
One, detached: 3,354One, attached: 46Two: 5153 or 4: 3085 to 9: 10110 to 19: 8650 or more: 423Mobile homes: 377Unemployment : 3.4%
Means of transportation to work in zip code 13357 82.8% 3,741 Drove a car alone5.0% 225 Carpooled0.3% 15 Bus or trolley bus0.6% 25 Bicycle2.0% 90 Walked2.5% 112 Other means6.1% 275 Worked at homeTravel time to work (commute) in zip code 13357 178 Less than 5 minutes881 5 to 9 minutes399 10 to 14 minutes689 15 to 19 minutes330 20 to 24 minutes579 25 to 29 minutes385 30 to 34 minutes179 35 to 39 minutes140 40 to 44 minutes149 45 to 59 minutes177 60 to 89 minutes66 90 or more minutes
Percentage of zip code residents living and working in this county: 62.8%
Household type by relationship:
Households: 10,137
Male householders: 1,864 (681 living alone ), Female householders: 2,725 (966 living alone )2,140 spouses (2,123 opposite-sex spouses ), 492 unmarried partners , (413 opposite-sex unmarried partners ), 2,510 children (2,388 natural , 15 adopted , 105 stepchildren ), 74 grandchildren , 28 brothers or sisters , 20 parents , 0 foster children , 25 other relatives , 229 non-relatives In group quarters: 145 (-1 institutionalized population )
Size of family households: 1,599 2-persons , 359 3-persons , 348 4-persons , 137 5-persons , 126 6-persons , 2 7-or-more-persons
Size of nonfamily households: 1,646 1-person , 367 2-persons , 9 3-persons , 26 4-persons
1,601 married couples with children. single-parent households (95 men , 309 women ).
99.8% of residents of 13357 zip code speak English at home. of residents speak Spanish at home (100% very well ).of residents speak other Indo-European language at home (95% very well, 5% not well ).
Foreign born population: 119 (1.2%)
(66.2%
of them are naturalized citizens )
This zip code:
1.2%Whole state:
22.7%
29% Singapore 20% Serbia 19% Malaysia 16% Uruguay 7% St. Vincent and the Grenadines 2% Afghanistan 20% Italian 19% English 14% American 7% Irish 4% European 4% German 4% French Canadian
Year of entry for the foreign-born population
28 2010 or later 8 2000 to 2009 57 1990 to 1999 105 Before 1990
Facilities with environmental interests located in this zip code:
HACKERS BODY SHOP INC (UPPER OTSEGO STREET in ILION, NY)
STATE MASTER (New York facility tracking) - AIR PROGRAM Conditionally Exempt Small Quantity Generators, less than 100 kg/month of hazardous waste (Resource Conservation and Recovery Act (tracking hazardous waste)) - notification Organizations: WALTER M HACKER (CONTACT/OWNER)
ILION JSHS ( in ILION, NY)
(National Center for Education Statistics) - STATE ID-210501060005 Organizations: ILION CSD (SCHOOL DISTRICT)
ILION VILLAGE OF DPW (125 EAST ST in ILION, NY)
(Resource Conservation and Recovery Act (tracking hazardous waste))
ILION BROAD OF LIGHT COMMISSIONERS (W STATE & PLEASANT AVE in ILION, NY)
(Resource Conservation and Recovery Act (tracking hazardous waste))
ILION CENTRAL SCHOOL (WEBER AVE in ILION, NY)
(Resource Conservation and Recovery Act (tracking hazardous waste))
ILION BOARD OF LIGHT COMMISSIONERS (MUNICIPAL BUILDING in ILION, NY)
COMPLIANCE ACTIVITY (Tracking inspections of insecticide, fungicide, and rodenticide, and toxic substances)
ILION COGENERATION PLANT(REMINGTON AVE) (REMINGTON AVE in ILION, NY)
CRITERIA AND HAZARDOUS AIR POLLUTANT INVENTORY (Inventory of air pollution sources) Business SIC classification: ELECTRIC SERVICES
Housing units lacking complete plumbing facilities: 1.1%
Housing units lacking complete kitchen facilities: 3.0%
50.6% Utility gas 24.9% Electricity 12.5% Fuel oil, kerosene, etc. 5.7% Bottled, tank, or LP gas 4.6% Wood 0.9% Other fuel 0.7% Coal or coke
Population in 1990: 11,603.
Place of birth for U.S.-born residents:
This state: 8,625Northeast: 509Midwest: 68South: 455West: 245
64% of the 13357 zip code residents lived in the same house 5 years ago.
Out of people who lived in different houses, 74% lived in this county.
Out of people who lived in different counties, 50% lived in New York.
90% of the 13357 zip code residents lived in the same house 1 year ago.
Out of people who lived in different houses, 61% moved from this county.
Out of people who lived in different houses, 20% moved from different county within same state.
Out of people who lived in different houses, 18% moved from different state.
Private vs. public school enrollment:
Students in private schools in grades 1 to 8 (elementary and middle school): 94
Students in private schools in grades 9 to 12 (high school): 49
Students in private undergraduate colleges: 13
Occupation by median earnings in the past 12 months ($)
76,461 Health diagnosing and treating practitioners and other technical occupations 74,123 Architecture and engineering occupations 63,199 Management occupations 61,377 Business and financial operations occupations 61,176 Computer and mathematical occupations 60,588 Community and social service occupations
Companies with federal contracts located in this zip code:
REMINGTON ARMS COMPANY, INCORP (14 HOEFLER AVE in ILION, NY) in 71 contracts from 2000 to 2006
Contracts for Guns, through 30 mm, Ammunition, 75 mm through 125 mm, Inspection Gages and Precision Layout Tools, Industrial Hygienics, and more by Army, Federal Law Enforcement Training Center, Navy, Bureau of Prisoners/Federal Prison System, and others Signed by year: 2000: $82,317; 2001: $1,590,014; 2002: $779,711; 2003: $1,972,578; 2004: $3,424,741; 2005: $2,639,965; 2006: $228,206.
Biggest contracts: with Army for Guns, through 30 mm. Signed on 2005-09-27. Completion date: 2005-12-30.
, same as above. Signed on 2004-09-21. Completion date: 2007-09-30.
, same as above. Signed on 2003-09-24. Completion date: 2004-01-26.
, same as above. Signed on 2001-12-21. Completion date: 2002-06-30.
SHAROCK SEWER SERVICES LLC (41 2ND AVE in ILION, NY; small business)
$131,720 with Army for Other Quality Control, Testing and Inspection Services -- Miscellaneous. Signed on 2003-06-11. Completion date: 2003-10-09.
Top industries in this zip code by the number of employees in 2005:
Health Care and Social Assistance: Nursing Care Facilities (100-249 employees: 1 establishment)Accommodation and Food Services: Limited-Service Restaurants (20-49: 1, 5-9: 1, 1-4: 2)Other Services (except Public Administration): Religious Organizations (5-9: 4, 1-4: 3)Health Care and Social Assistance: Other Individual and Family Services (20-49: 1)Other Services (except Public Administration): Labor Unions and Similar Labor Organizations (20-49: 1)
People in group quarters in 2010:
102 people in nursing facilities/skilled-nursing facilities
33 people in group homes intended for adults
5 people in emergency and transitional shelters (with sleeping facilities) for people experiencing homelessness
People in group quarters in 2000:
118 people in nursing homes
28 people in homes for the mentally retarded
5 people in other group homes
Fatal accident statistics in 2014:
Fatal accident count: 1Vehicles involved in fatal accidents: 3Fatal accidents caused by drunken drivers: 0Fatalities: 1Persons involved in fatal accidents: 4Pedestrians involved in fatal accidents: 0
Fatal accident statistics in 2010:
Fatal accident count: 1Vehicles involved in fatal accidents: 1Fatal accidents caused by drunken drivers: 0Fatalities: 1Persons involved in fatal accidents: 1Pedestrians involved in fatal accidents: 0
Home Mortgage Disclosure Act Aggregated Statistics For Year 2009(Based on 2 full and 4 partial tracts) A) FHA, FSA/RHS & VA B) Conventional C) Refinancings D) Home Improvement Loans E) Loans on Dwellings For 5+ Families F) Non-occupant Loans on G) Loans On Manufactured Number Average Value Number Average Value Number Average Value Number Average Value Number Average Value Number Average Value Number Average Value
LOANS ORIGINATED 67 $80,731 58 $84,960 153 $87,433 56 $22,608 1 $94,740 4 $46,080 5 $46,948 APPLICATIONS APPROVED, NOT ACCEPTED 1 $63,950 1 $87,040 10 $70,510 5 $24,188 0 $0 0 $0 0 $0 APPLICATIONS DENIED 15 $99,246 14 $77,844 65 $90,694 40 $20,273 0 $0 5 $60,380 5 $52,150 APPLICATIONS WITHDRAWN 3 $77,163 4 $68,892 42 $91,355 6 $41,390 0 $0 0 $0 1 $104,000 FILES CLOSED FOR INCOMPLETENESS 2 $77,875 2 $44,540 9 $71,210 0 $0 0 $0 0 $0 0 $0
Aggregated Statistics For Year 2008(Based on 2 full and 4 partial tracts) A) FHA, FSA/RHS & VA B) Conventional C) Refinancings D) Home Improvement Loans F) Non-occupant Loans on G) Loans On Manufactured Number Average Value Number Average Value Number Average Value Number Average Value Number Average Value Number Average Value
LOANS ORIGINATED 61 $76,160 73 $70,264 127 $71,374 64 $27,388 16 $52,582 13 $55,945 APPLICATIONS APPROVED, NOT ACCEPTED 4 $68,890 17 $54,435 24 $110,538 10 $40,677 3 $63,667 9 $59,476 APPLICATIONS DENIED 15 $79,963 32 $74,226 141 $88,815 79 $21,045 9 $113,466 11 $65,300 APPLICATIONS WITHDRAWN 2 $58,980 11 $72,731 44 $88,583 13 $47,540 5 $63,374 0 $0 FILES CLOSED FOR INCOMPLETENESS 4 $68,390 3 $36,097 17 $108,121 3 $32,743 4 $45,928 0 $0
Aggregated Statistics For Year 2007(Based on 2 full and 4 partial tracts) A) FHA, FSA/RHS & VA B) Conventional C) Refinancings D) Home Improvement Loans E) Loans on Dwellings For 5+ Families F) Non-occupant Loans on G) Loans On Manufactured Number Average Value Number Average Value Number Average Value Number Average Value Number Average Value Number Average Value Number Average Value
LOANS ORIGINATED 50 $75,647 118 $72,813 158 $67,381 94 $27,521 2 $113,685 32 $64,251 6 $65,172 APPLICATIONS APPROVED, NOT ACCEPTED 1 $54,260 36 $116,647 19 $73,083 14 $32,876 0 $0 6 $182,832 6 $60,625 APPLICATIONS DENIED 2 $66,720 49 $103,427 183 $238,154 156 $35,577 1 $88,810 23 $53,770 18 $64,508 APPLICATIONS WITHDRAWN 2 $65,725 25 $88,941 73 $92,665 17 $49,952 0 $0 5 $109,640 2 $55,955 FILES CLOSED FOR INCOMPLETENESS 2 $39,825 10 $81,496 16 $81,391 0 $0 0 $0 0 $0 0 $0
Aggregated Statistics For Year 2006(Based on 2 full and 4 partial tracts) A) FHA, FSA/RHS & VA B) Conventional C) Refinancings D) Home Improvement Loans E) Loans on Dwellings For 5+ Families F) Non-occupant Loans on G) Loans On Manufactured Number Average Value Number Average Value Number Average Value Number Average Value Number Average Value Number Average Value Number Average Value
LOANS ORIGINATED 38 $73,039 168 $69,485 220 $60,534 95 $25,466 3 $85,170 25 $58,126 13 $45,519 APPLICATIONS APPROVED, NOT ACCEPTED 0 $0 20 $68,092 45 $70,700 13 $18,516 0 $0 8 $72,909 3 $51,227 APPLICATIONS DENIED 4 $73,192 65 $64,203 251 $71,123 158 $35,325 2 $61,900 32 $47,112 23 $55,789 APPLICATIONS WITHDRAWN 3 $56,233 28 $65,065 181 $71,062 28 $65,763 0 $0 8 $58,379 8 $60,100 FILES CLOSED FOR INCOMPLETENESS 0 $0 7 $48,366 20 $105,949 2 $66,025 0 $0 4 $59,282 0 $0
Aggregated Statistics For Year 2005(Based on 2 full and 4 partial tracts) A) FHA, FSA/RHS & VA B) Conventional C) Refinancings D) Home Improvement Loans E) Loans on Dwellings For 5+ Families F) Non-occupant Loans on G) Loans On Manufactured Number Average Value Number Average Value Number Average Value Number Average Value Number Average Value Number Average Value Number Average Value
LOANS ORIGINATED 36 $69,330 125 $74,537 166 $61,501 105 $25,573 1 $296,050 21 $51,675 13 $53,861 APPLICATIONS APPROVED, NOT ACCEPTED 5 $40,176 26 $41,568 35 $69,102 13 $20,899 0 $0 7 $50,949 10 $26,495 APPLICATIONS DENIED 5 $85,412 33 $73,528 265 $70,883 110 $27,599 0 $0 15 $63,336 19 $46,317 APPLICATIONS WITHDRAWN 3 $45,673 13 $76,118 172 $85,090 23 $146,566 1 $71,050 6 $97,132 2 $72,720 FILES CLOSED FOR INCOMPLETENESS 4 $44,112 13 $82,638 15 $97,544 4 $195,742 0 $0 2 $38,940 0 $0
Aggregated Statistics For Year 2004(Based on 2 full and 4 partial tracts) A) FHA, FSA/RHS & VA B) Conventional C) Refinancings D) Home Improvement Loans F) Non-occupant Loans on G) Loans On Manufactured Number Average Value Number Average Value Number Average Value Number Average Value Number Average Value Number Average Value
LOANS ORIGINATED 45 $73,372 131 $66,682 213 $56,941 115 $25,960 9 $54,428 13 $41,828 APPLICATIONS APPROVED, NOT ACCEPTED 2 $61,450 19 $71,466 59 $60,304 2 $33,775 2 $58,905 3 $55,337 APPLICATIONS DENIED 7 $48,059 38 $50,845 253 $65,972 82 $23,597 6 $47,788 22 $46,931 APPLICATIONS WITHDRAWN 4 $49,945 13 $67,281 224 $68,821 25 $34,784 3 $49,487 7 $63,650 FILES CLOSED FOR INCOMPLETENESS 1 $74,600 7 $83,381 22 $72,438 3 $27,650 4 $64,452 0 $0
Aggregated Statistics For Year 2003(Based on 2 full and 4 partial tracts) A) FHA, FSA/RHS & VA B) Conventional C) Refinancings D) Home Improvement Loans F) Non-occupant Loans on Number Average Value Number Average Value Number Average Value Number Average Value Number Average Value
LOANS ORIGINATED 41 $70,453 94 $61,011 353 $57,662 53 $17,866 12 $48,118 APPLICATIONS APPROVED, NOT ACCEPTED 0 $0 16 $53,132 53 $60,819 6 $31,133 1 $81,010 APPLICATIONS DENIED 4 $73,045 28 $49,255 259 $57,159 79 $23,743 11 $42,286 APPLICATIONS WITHDRAWN 1 $26,000 14 $50,271 186 $67,664 8 $23,206 2 $61,525 FILES CLOSED FOR INCOMPLETENESS 0 $0 7 $53,087 17 $73,259 2 $19,970 2 $35,940
Aggregated Statistics For Year 2002(Based on 2 full and 4 partial tracts) A) FHA, FSA/RHS & VA B) Conventional C) Refinancings D) Home Improvement Loans E) Loans on Dwellings For 5+ Families F) Non-occupant Loans on Number Average Value Number Average Value Number Average Value Number Average Value Number Average Value Number Average Value
LOANS ORIGINATED 71 $55,111 105 $66,980 272 $59,528 88 $13,746 1 $296,050 19 $48,443 APPLICATIONS APPROVED, NOT ACCEPTED 0 $0 11 $50,009 66 $52,775 5 $13,538 0 $0 5 $44,578 APPLICATIONS DENIED 9 $54,920 43 $42,371 214 $60,151 54 $9,626 0 $0 4 $58,580 APPLICATIONS WITHDRAWN 6 $66,608 12 $28,748 196 $61,033 8 $17,121 0 $0 0 $0 FILES CLOSED FOR INCOMPLETENESS 0 $0 0 $0 17 $60,405 0 $0 0 $0 0 $0
Aggregated Statistics For Year 2001(Based on 2 full and 4 partial tracts) A) FHA, FSA/RHS & VA B) Conventional C) Refinancings D) Home Improvement Loans F) Non-occupant Loans on Number Average Value Number Average Value Number Average Value Number Average Value Number Average Value
LOANS ORIGINATED 42 $54,297 66 $64,398 204 $53,046 87 $18,162 17 $41,591 APPLICATIONS APPROVED, NOT ACCEPTED 0 $0 20 $52,907 57 $62,648 16 $31,733 0 $0 APPLICATIONS DENIED 2 $49,920 58 $38,189 225 $56,807 63 $14,223 13 $52,482 APPLICATIONS WITHDRAWN 7 $47,673 12 $52,911 175 $54,753 13 $25,812 8 $55,962 FILES CLOSED FOR INCOMPLETENESS 0 $0 0 $0 29 $51,285 2 $13,725 1 $71,050
Aggregated Statistics For Year 2000(Based on 2 full and 4 partial tracts) A) FHA, FSA/RHS & VA B) Conventional C) Refinancings D) Home Improvement Loans F) Non-occupant Loans on Number Average Value Number Average Value Number Average Value Number Average Value Number Average Value
LOANS ORIGINATED 63 $53,546 121 $48,994 103 $41,386 96 $13,977 7 $46,989 APPLICATIONS APPROVED, NOT ACCEPTED 0 $0 22 $38,204 24 $38,847 12 $17,203 4 $27,748 APPLICATIONS DENIED 3 $39,850 109 $33,138 160 $41,715 102 $17,821 9 $33,379 APPLICATIONS WITHDRAWN 2 $51,995 21 $40,356 107 $43,528 13 $36,372 2 $46,925 FILES CLOSED FOR INCOMPLETENESS 0 $0 2 $37,940 33 $49,110 2 $24,960 0 $0
Aggregated Statistics For Year 1999(Based on 1 full and 2 partial tracts) A) FHA, FSA/RHS & VA B) Conventional C) Refinancings D) Home Improvement Loans F) Non-occupant Loans on Number Average Value Number Average Value Number Average Value Number Average Value Number Average Value
LOANS ORIGINATED 31 $51,018 55 $52,816 112 $43,262 54 $13,267 3 $39,990 APPLICATIONS APPROVED, NOT ACCEPTED 1 $37,600 22 $59,069 28 $50,580 5 $21,794 2 $40,065 APPLICATIONS DENIED 1 $69,430 41 $35,066 91 $46,965 54 $11,351 7 $31,204 APPLICATIONS WITHDRAWN 3 $47,287 2 $47,600 73 $49,809 9 $22,897 1 $38,080 FILES CLOSED FOR INCOMPLETENESS 0 $0 1 $107,480 16 $54,242 1 $31,250 0 $0
Detailed HMDA statistics for the following Tracts:
0101.00
,
0103.00 ,
0104.00
Private Mortgage Insurance Companies Aggregated Statistics For Year 2009(Based on 2 full and 4 partial tracts) A) Conventional B) Refinancings C) Non-occupant Loans on Number Average Value Number Average Value Number Average Value
LOANS ORIGINATED 18 $86,472 8 $104,362 0 $0 APPLICATIONS APPROVED, NOT ACCEPTED 4 $68,822 2 $108,035 1 $66,320 APPLICATIONS DENIED 4 $122,802 0 $0 0 $0 APPLICATIONS WITHDRAWN 4 $132,788 2 $214,655 0 $0 FILES CLOSED FOR INCOMPLETENESS 0 $0 0 $0 0 $0
Aggregated Statistics For Year 2008(Based on 2 full and 4 partial tracts) A) Conventional B) Refinancings C) Non-occupant Loans on Number Average Value Number Average Value Number Average Value
LOANS ORIGINATED 37 $77,257 5 $117,636 8 $62,038 APPLICATIONS APPROVED, NOT ACCEPTED 9 $67,818 4 $122,230 2 $52,940 APPLICATIONS DENIED 3 $61,027 2 $125,880 1 $53,290 APPLICATIONS WITHDRAWN 0 $0 0 $0 0 $0 FILES CLOSED FOR INCOMPLETENESS 0 $0 0 $0 0 $0
Aggregated Statistics For Year 2007(Based on 2 full and 4 partial tracts) A) Conventional B) Refinancings C) Non-occupant Loans on D) Loans On Manufactured Number Average Value Number Average Value Number Average Value Number Average Value
LOANS ORIGINATED 53 $75,247 11 $79,137 7 $44,324 1 $46,720 APPLICATIONS APPROVED, NOT ACCEPTED 12 $79,359 7 $82,149 2 $36,375 0 $0 APPLICATIONS DENIED 2 $71,885 5 $73,062 0 $0 0 $0 APPLICATIONS WITHDRAWN 5 $96,232 0 $0 0 $0 0 $0 FILES CLOSED FOR INCOMPLETENESS 0 $0 2 $69,890 0 $0 0 $0
Aggregated Statistics For Year 2006(Based on 2 full and 4 partial tracts) A) Conventional B) Refinancings C) Non-occupant Loans on Number Average Value Number Average Value Number Average Value
LOANS ORIGINATED 62 $74,417 14 $88,151 5 $72,042 APPLICATIONS APPROVED, NOT ACCEPTED 2 $52,050 1 $86,290 0 $0 APPLICATIONS DENIED 0 $0 2 $66,895 0 $0 APPLICATIONS WITHDRAWN 6 $66,922 0 $0 0 $0 FILES CLOSED FOR INCOMPLETENESS 0 $0 0 $0 0 $0
Aggregated Statistics For Year 2005(Based on 2 full and 4 partial tracts) A) Conventional B) Refinancings C) Non-occupant Loans on Number Average Value Number Average Value Number Average Value
LOANS ORIGINATED 57 $88,843 12 $72,451 4 $44,575 APPLICATIONS APPROVED, NOT ACCEPTED 14 $67,921 2 $82,490 0 $0 APPLICATIONS DENIED 1 $36,170 0 $0 0 $0 APPLICATIONS WITHDRAWN 5 $46,450 2 $86,845 0 $0 FILES CLOSED FOR INCOMPLETENESS 0 $0 2 $67,890 2 $67,890
Aggregated Statistics For Year 2004(Based on 2 full and 4 partial tracts) A) Conventional B) Refinancings C) Non-occupant Loans on D) Loans On Manufactured Number Average Value Number Average Value Number Average Value Number Average Value
LOANS ORIGINATED 64 $65,493 17 $69,582 6 $63,522 2 $67,070 APPLICATIONS APPROVED, NOT ACCEPTED 5 $73,680 12 $77,366 0 $0 0 $0 APPLICATIONS DENIED 2 $62,900 1 $72,240 0 $0 0 $0 APPLICATIONS WITHDRAWN 7 $59,690 5 $59,566 0 $0 0 $0 FILES CLOSED FOR INCOMPLETENESS 0 $0 0 $0 0 $0 0 $0
Aggregated Statistics For Year 2003(Based on 2 full and 4 partial tracts) A) Conventional B) Refinancings Number Average Value Number Average Value
LOANS ORIGINATED 26 $61,819 26 $65,489 APPLICATIONS APPROVED, NOT ACCEPTED 10 $53,007 7 $116,936 APPLICATIONS DENIED 3 $35,410 0 $0 APPLICATIONS WITHDRAWN 0 $0 3 $65,743 FILES CLOSED FOR INCOMPLETENESS 0 $0 0 $0
Aggregated Statistics For Year 2002(Based on 2 full and 4 partial tracts) A) Conventional B) Refinancings C) Non-occupant Loans on Number Average Value Number Average Value Number Average Value
LOANS ORIGINATED 41 $62,607 37 $84,521 1 $61,580 APPLICATIONS APPROVED, NOT ACCEPTED 4 $49,462 17 $81,229 1 $58,780 APPLICATIONS DENIED 2 $36,940 0 $0 0 $0 APPLICATIONS WITHDRAWN 2 $125,310 1 $55,660 0 $0 FILES CLOSED FOR INCOMPLETENESS 0 $0 0 $0 0 $0
Aggregated Statistics For Year 2001(Based on 2 full and 4 partial tracts) A) Conventional B) Refinancings C) Non-occupant Loans on Number Average Value Number Average Value Number Average Value
LOANS ORIGINATED 29 $68,404 23 $73,829 0 $0 APPLICATIONS APPROVED, NOT ACCEPTED 4 $60,780 6 $66,180 0 $0 APPLICATIONS DENIED 0 $0 0 $0 0 $0 APPLICATIONS WITHDRAWN 4 $35,442 0 $0 2 $20,965 FILES CLOSED FOR INCOMPLETENESS 0 $0 0 $0 0 $0
Aggregated Statistics For Year 1999(Based on 1 full and 2 partial tracts) A) Conventional B) Refinancings C) Non-occupant Loans on Number Average Value Number Average Value Number Average Value
LOANS ORIGINATED 14 $73,551 6 $74,360 1 $54,590 APPLICATIONS APPROVED, NOT ACCEPTED 3 $92,790 1 $70,140 0 $0 APPLICATIONS DENIED 2 $36,790 0 $0 0 $0 APPLICATIONS WITHDRAWN 0 $0 0 $0 0 $0 FILES CLOSED FOR INCOMPLETENESS 0 $0 0 $0 0 $0
Detailed PMIC statistics for the following Tracts:
0101.00
,
0103.00 ,
0104.00
2002 - 2018 National Fire Incident Reporting System (NFIRS) incidents See full 2006 National Fire Incident Reporting System statistics for zip code 13357, New York
Most common first names in zip code 13357 among deceased individuals Name Count Lived (average)
Mary 147 80.6 years John 122 73.8 years William 105 77.2 years Charles 91 76.5 years Robert 88 70.6 years Helen 80 81.0 years George 77 76.4 years Margaret 75 81.7 years James 65 74.0 years Joseph 62 73.1 years
Most common last names in zip code 13357 among deceased individuals Last name Count Lived (average)
Smith 43 77.8 years Miller 40 74.4 years Brown 37 77.8 years Jones 29 79.0 years Williams 28 72.9 years Johnson 25 76.7 years Wood 19 76.3 years Bennett 18 78.0 years Davis 17 79.5 years Murphy 16 78.4 years
Businesses in zip code 13357
Name Count Name Count
ALDI 1 SAS Shoes 1 Dunkin Donuts 1 Subway 1 FedEx 1 True Value 1 GNC 1 U-Haul 1 McDonald's 1 UPS 1 Rite Aid 1
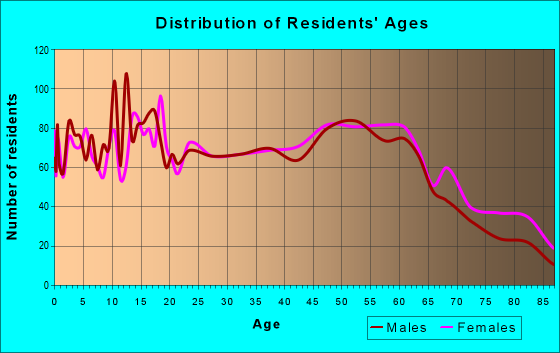
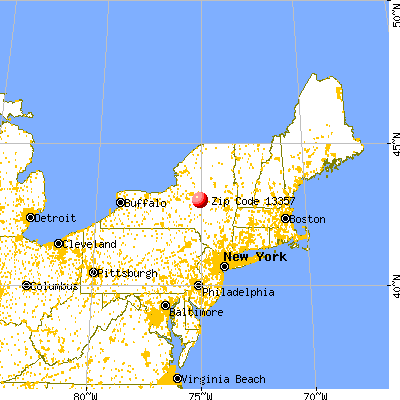

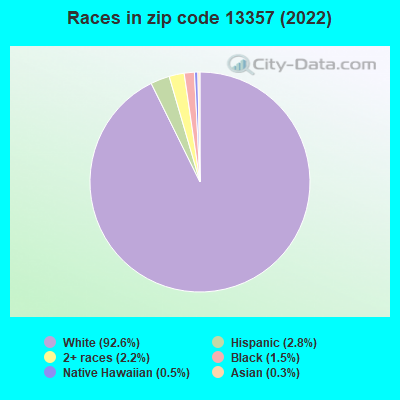


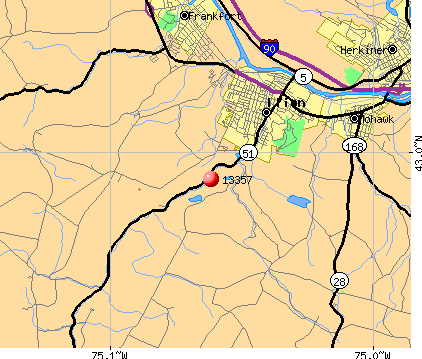 Nearest zip codes: 13340, 13350, 13322, 13407, 13491, 13439.
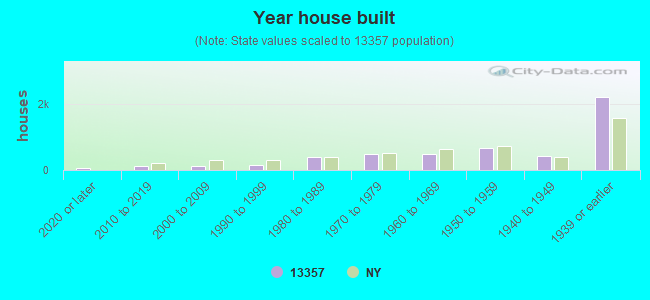
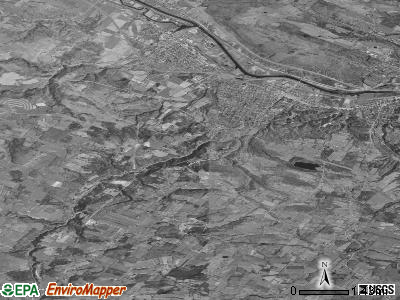
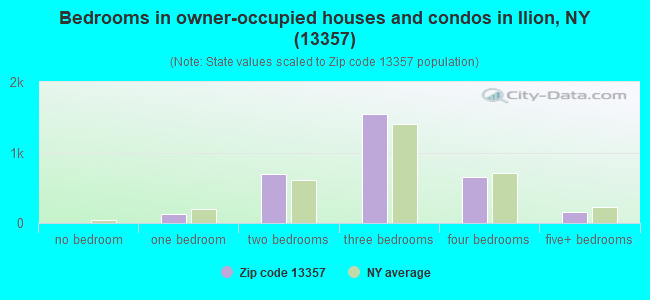
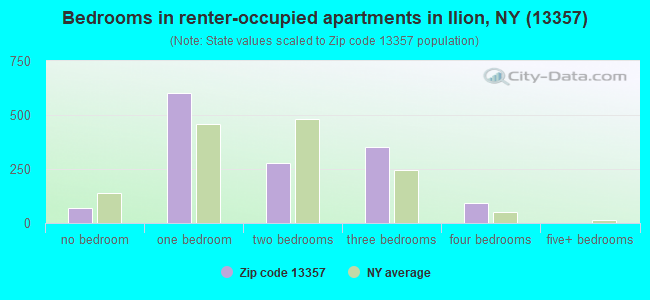
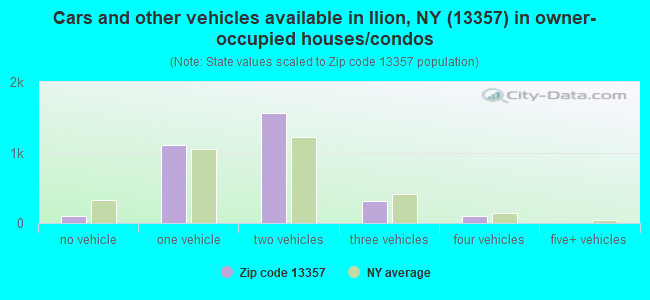
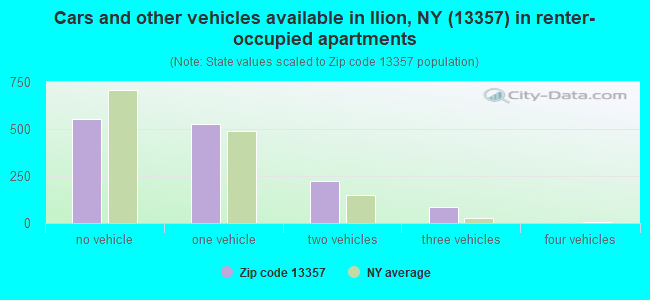


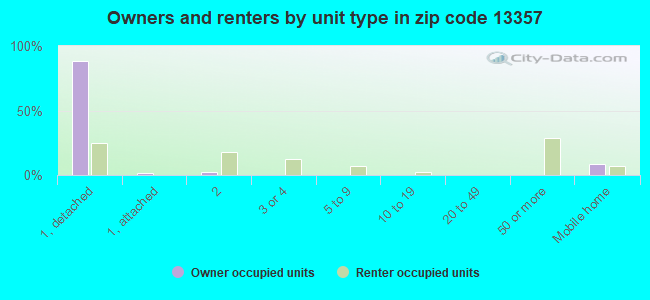
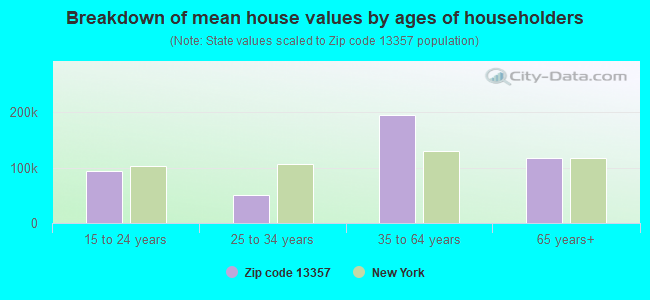


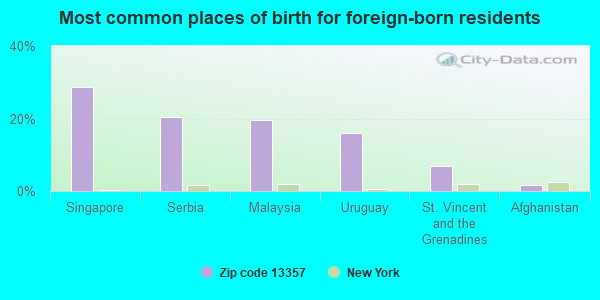
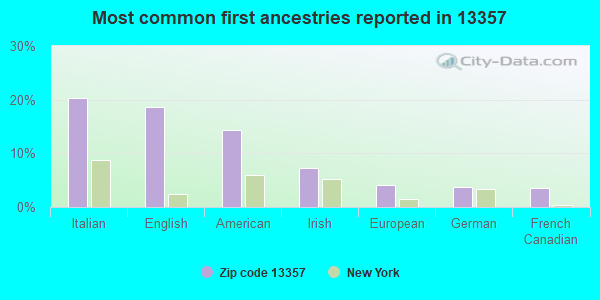
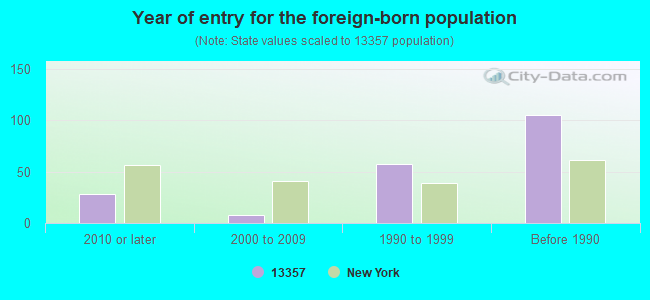
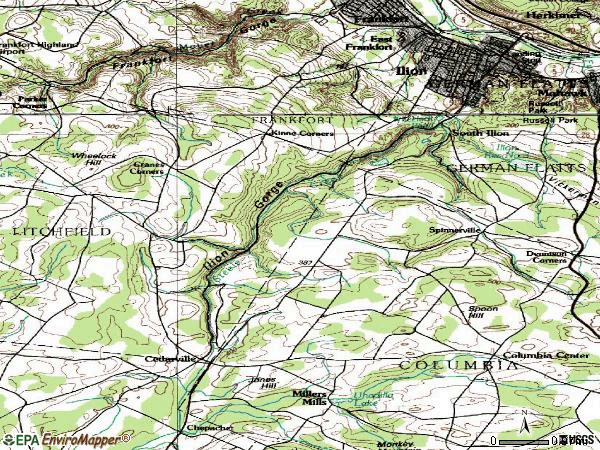

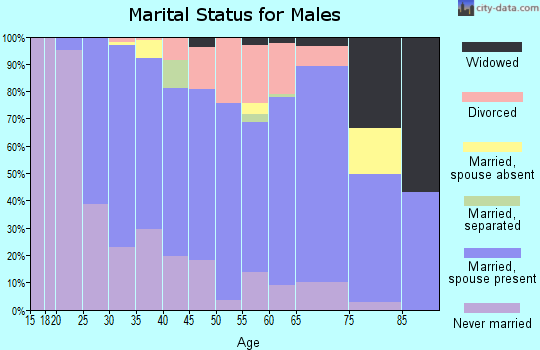
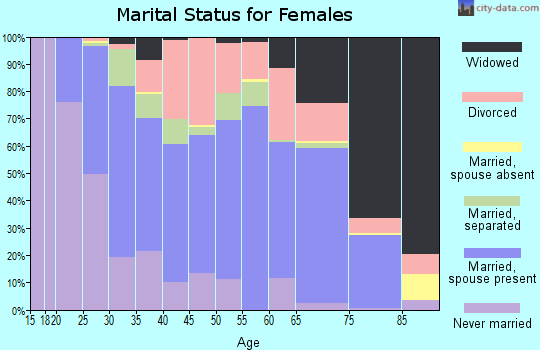
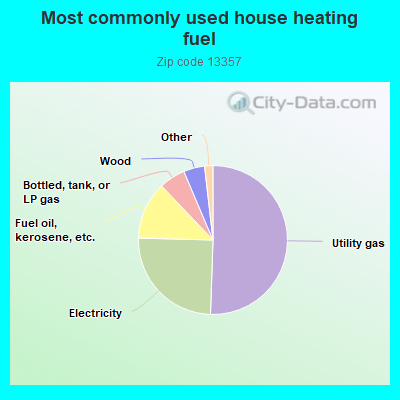
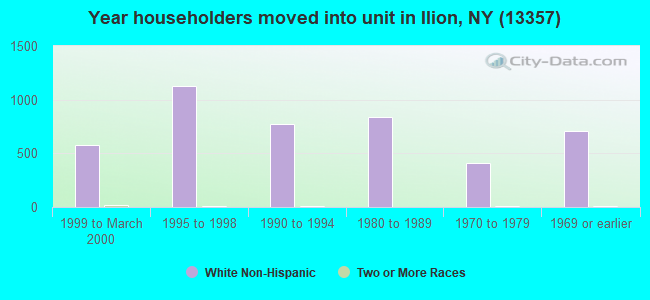
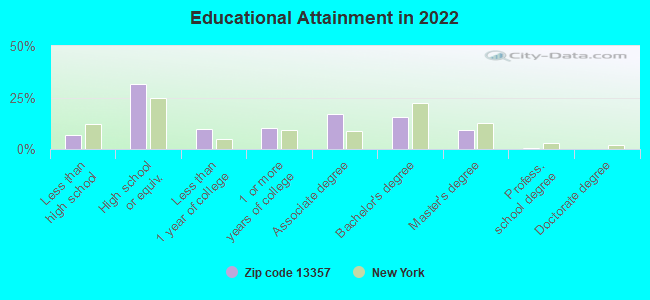
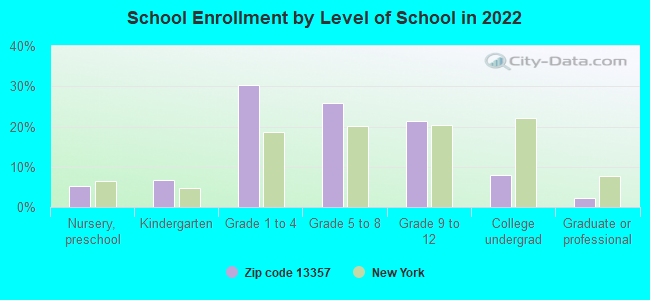
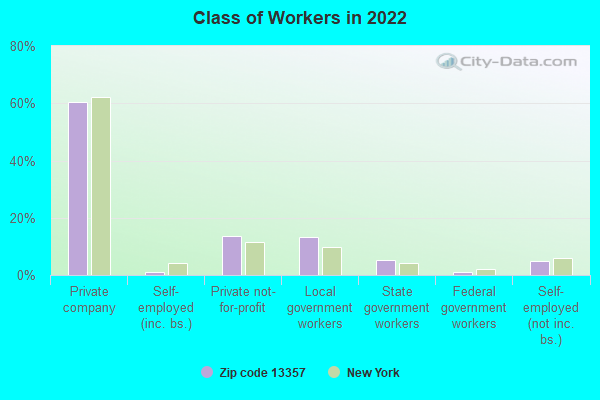
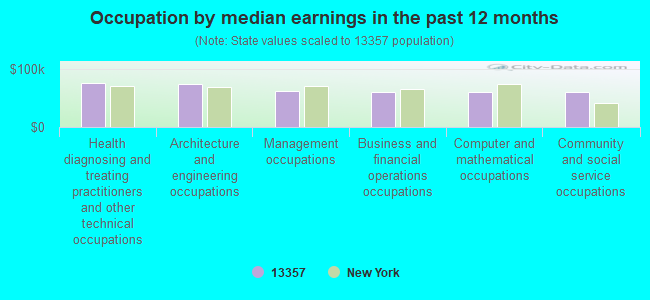
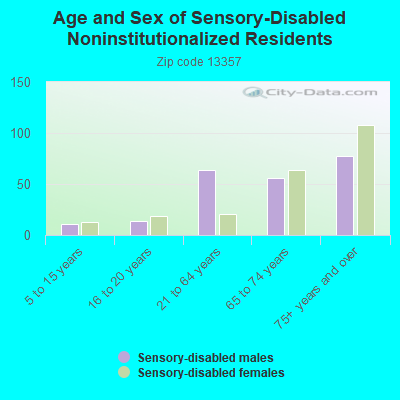
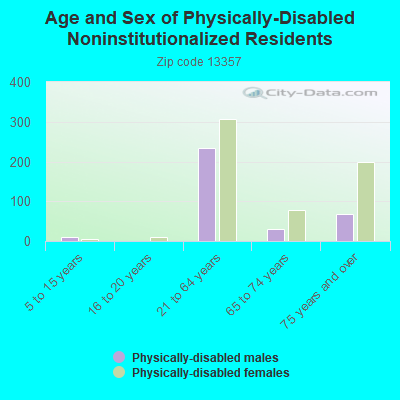
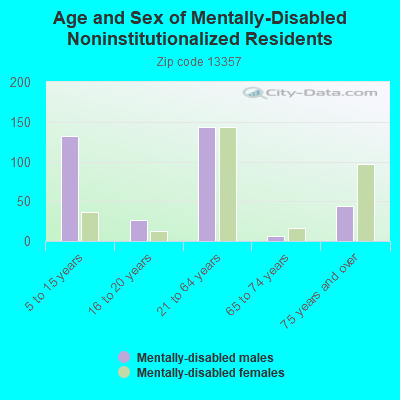
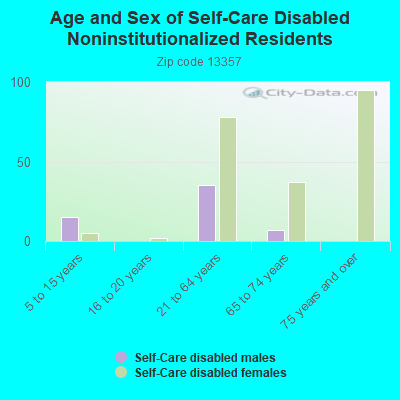
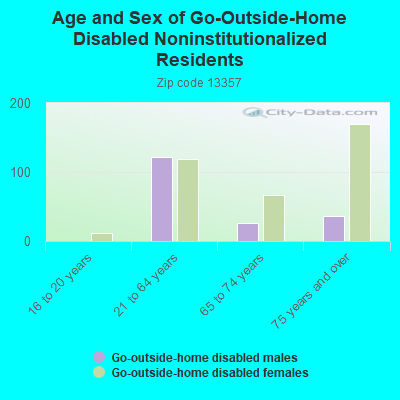
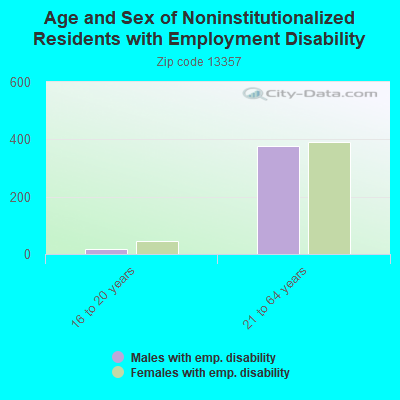
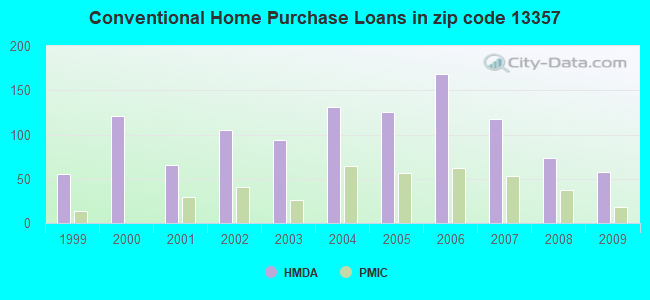
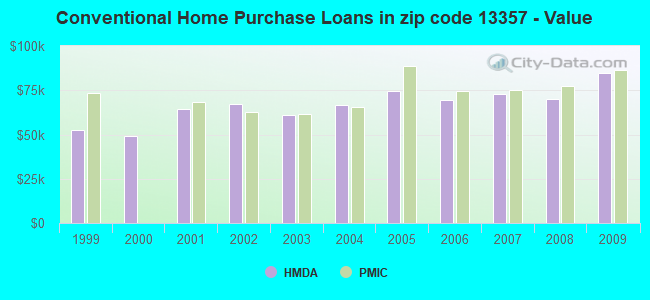
 According to the data from the years 2002 - 2018 the average number of fires per year is 35. The highest number of fires - 53 took place in 2002, and the least - 7 in 2009. The data has a dropping trend.
 When looking into fire subcategories, the most incidents belonged to: Structure Fires (52.2%), and Outside Fires (25.3%).