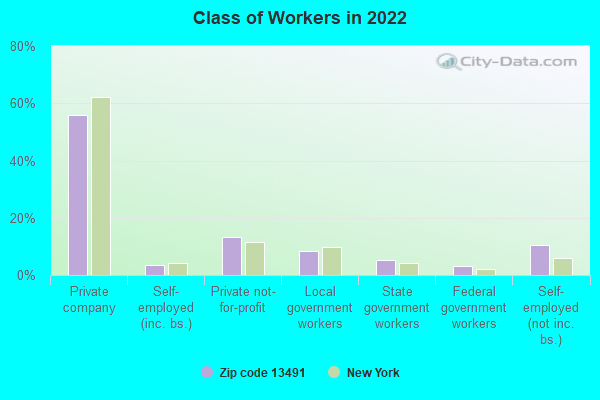
Estimated zip code population in 2022: 3,791 Zip code population in 2010: 3,641 Zip code population in 2000: 3,784
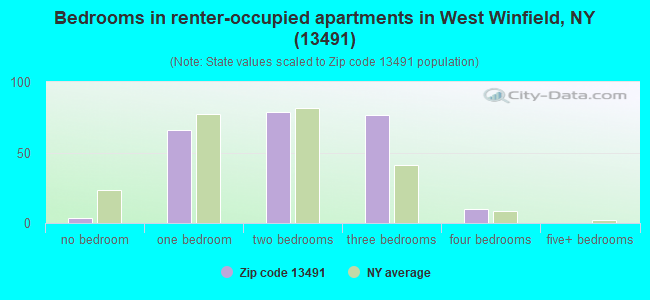
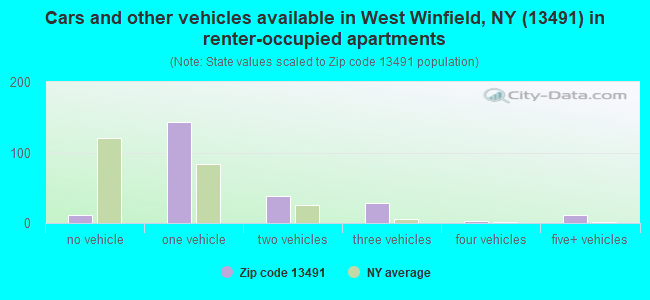
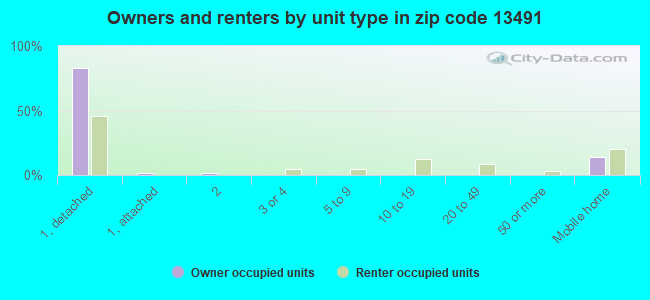
Houses and condos: 1,546 Renter-occupied apartments: 236
% of renters here:
17%
State:
46%
March 2022 cost of living index in zip code 13491: 93.6 (less than average, U.S. average is 100)
Land area: 72.3 sq. mi. Water area: 0.0 sq. mi.
Population density: 52 people per square mile
(very low).
OSM Map
General Map
Google Map
MSN Map
OSM Map
General Map
Google Map
MSN Map
OSM Map
General Map
Google Map
MSN Map
OSM Map
General Map
Google Map
MSN Map
Please wait while loading the map...
Real estate property taxes paid for housing units in 2022:
This zip code:
1.8% ($2,640)
New York:
1.5% ($6,180)
Median real estate property taxes paid for housing units with mortgages in 2022: $2,870 (1.9%) Median real estate property taxes paid for housing units with no mortgage in 2022: $2,469 (1.7%)
Business Search- 14 Million verified businesses
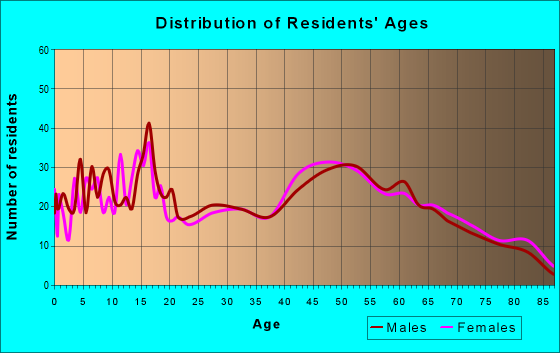
Males: 1,819
(48.0%)
Females: 1,972
(52.0%)
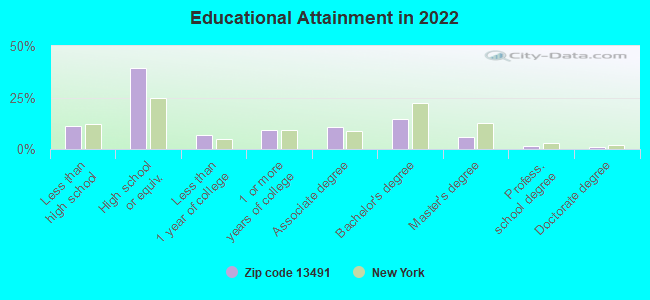
For population 25 years and over in 13491:
High school or higher: 87.9%
Bachelor's degree or higher: 22.8%
Graduate or professional degree: 8.2%
Unemployed: 5.3%
Mean travel time to work (commute): 32.4 minutes
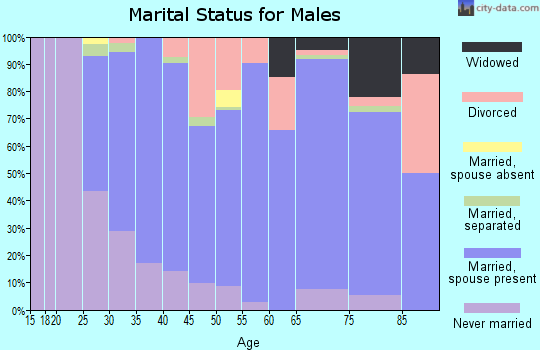
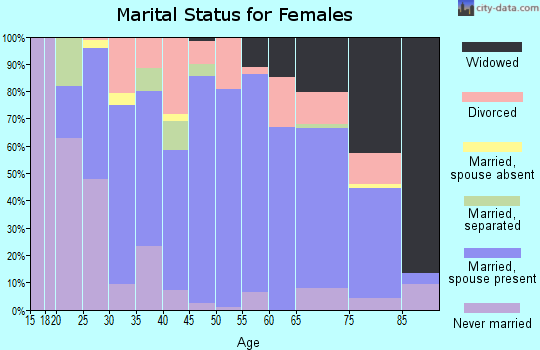
For population 15 years and over in 13491:
Never married: 34.5%
Now married: 49.9%
Separated: 3.2%
Widowed: 5.1%
Divorced: 7.3%
Zip code 13491 compared to state average:
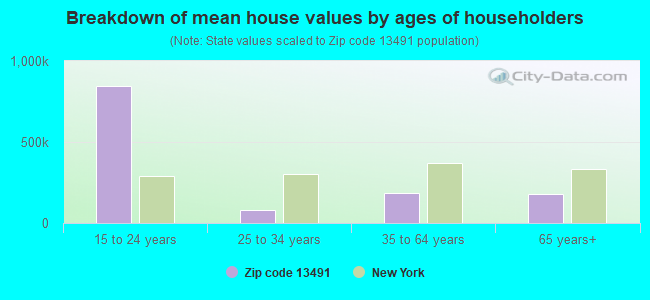
Median house value significantly below state average.
Black race population percentage significantly below state average.
Hispanic race population percentage significantly below state average.
Foreign-born population percentage significantly below state average.
Renting percentage significantly below state average.
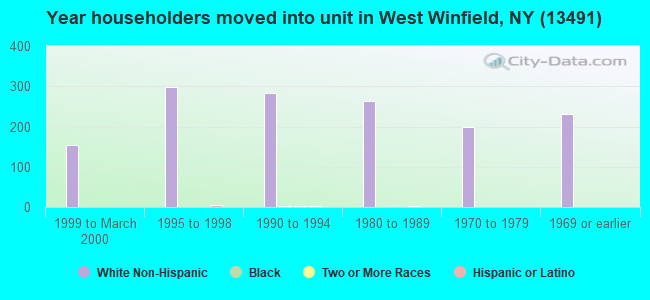
Length of stay since moving in significantly above state average.
Number of rooms per house above state average.
Percentage of population with a bachelor's degree or higher below state average.
Averages for the 2020 tax year for zip code 13491, filed in 2021:
Average Adjusted Gross Income (AGI) in 2020: $60,005 (Individual Income Tax Returns)
Here:
$60,005
State:
$90,930
Salary/wage: $49,543 (reported on 78.8% of returns)
Here:
$49,543
State:
$72,104
(% of AGI for various income ranges: 1170.9% for AGIs below $25k, 3462.8% for AGIs $25k-50k, 6639.4% for AGIs $50k-75k, 8425.8% for AGIs $75k-100k, 16891.7% for AGIs $100k-200k)
Taxable interest for individuals: $913 (reported on 36.4% of returns)
This zip code:
$913
New York:
$3,075
(% of AGI for various income ranges: 18.4% for AGIs below $25k, 26.7% for AGIs $25k-50k, 17.8% for AGIs $50k-75k, 53.3% for AGIs $75k-100k, 128.3% for AGIs $100k-200k)
Ordinary dividends: $3,317 (reported on 18.2% of returns)
Here:
$3,317
State:
$11,095
(% of AGI for various income ranges: 28.4% for AGIs below $25k, 40.0% for AGIs $25k-50k, 71.1% for AGIs $50k-75k, 235.8% for AGIs $75k-100k, 290.8% for AGIs $100k-200k)
Net capital gain/loss in AGI: +$8,071 (reported on 14.5% of returns)
Here:
+$8,071
State:
+$44,925
(% of AGI for various income ranges: 22.2% for AGIs below $25k, 65.8% for AGIs $25k-50k, 75.0% for AGIs $50k-75k, 230.8% for AGIs $75k-100k, 1014.2% for AGIs $100k-200k)
Profit/loss from business: +$10,995 (reported on 12.1% of returns)
Here:
+$10,995
State:
+$14,940
(% of AGI for various income ranges: 141.2% for AGIs below $25k, 67.8% for AGIs $25k-50k, 85.0% for AGIs $50k-75k, 223.3% for AGIs $75k-100k, 901.7% for AGIs $100k-200k)
Taxable individual retirement arrangement distribution: $11,918 (reported on 10.3% of returns)
13491:
$11,918
New York:
$19,609
(% of AGI for various income ranges: 73.4% for AGIs below $25k, 101.9% for AGIs $25k-50k, 225.0% for AGIs $50k-75k, 301.7% for AGIs $75k-100k, 547.5% for AGIs $100k-200k)
Total itemized deductions: $21,525 (reported on 2.4% of returns)
Here:
$21,525
State:
$39,326
(% of AGI for various income ranges: 717.5% for AGIs $75k-100k)
Taxes paid: $6,950 (reported on 2.4% of returns)
13491:
$6,950
State:
$9,183
(% of AGI for various income ranges: 231.7% for AGIs $75k-100k)
Earned income credit: $2,392 (reported on 14.5% of returns)
Here:
$2,392
State:
$2,138
(% of AGI for various income ranges: 105.0% for AGIs below $25k, 66.1% for AGIs $25k-50k)
Percentage of individuals using paid preparers for their 2020 taxes: 95.8%
Here:
96%
State:
95%
(% for various income ranges: 93.9% for AGIs below $25k, 97.9% for AGIs $25k-50k, 96.3% for AGIs $50k-75k, 94.1% for AGIs $75k-100k, 95.2% for AGIs $100k-200k, 100.0% for AGIs over 200k)
Averages for the 2012 tax year for zip code 13491, filed in 2013:
Average Adjusted Gross Income (AGI) in 2012: $45,960 (Individual Income Tax Returns)
Here:
$45,960
State:
$77,088
Salary/wage: $41,447 (reported on 83.2% of returns)
Here:
$41,447
State:
$60,593
(% of AGI for various income ranges: 69.2% for AGIs below $25k, 77.9% for AGIs $25k-50k, 75.3% for AGIs $50k-75k, 78.4% for AGIs $75k-100k, 72.9% for AGIs $100k-200k)
Taxable interest for individuals: $590 (reported on 37.1% of returns)
This zip code:
$590
New York:
$3,125
(% of AGI for various income ranges: 1.1% for AGIs below $25k, 0.4% for AGIs $25k-50k, 0.4% for AGIs $50k-75k, 0.3% for AGIs $75k-100k, 0.4% for AGIs $100k-200k)
Ordinary dividends: $2,772 (reported on 21.6% of returns)
Here:
$2,772
State:
$10,299
(% of AGI for various income ranges: 3.2% for AGIs below $25k, 0.8% for AGIs $25k-50k, 1.4% for AGIs $50k-75k, 0.6% for AGIs $75k-100k, 1.3% for AGIs $100k-200k)
Net capital gain/loss in AGI: +$3,188 (reported on 14.4% of returns)
Here:
+$3,188
State:
+$42,474
(% of AGI for various income ranges: 1.5% for AGIs below $25k, 0.8% for AGIs $25k-50k, 0.5% for AGIs $50k-75k, 0.8% for AGIs $75k-100k, 1.4% for AGIs $100k-200k)
Profit/loss from business: +$13,058 (reported on 15.6% of returns)
Here:
+$13,058
State:
+$16,168
(% of AGI for various income ranges: 5.2% for AGIs below $25k, 1.4% for AGIs $25k-50k, 2.6% for AGIs $50k-75k, 2.0% for AGIs $75k-100k, 9.1% for AGIs $100k-200k)
Taxable individual retirement arrangement distribution: $9,941 (reported on 10.2% of returns)
13491:
$9,941
New York:
$17,621
(% of AGI for various income ranges: 3.1% for AGIs below $25k, 2.8% for AGIs $25k-50k, 2.9% for AGIs $50k-75k, 2.3% for AGIs $100k-200k)
Total itemized deductions: $18,416 (19% of AGI, reported on 18.6% of returns)
Here:
$18,416
State:
$34,985
Here:
18.7% of AGI
State:
21.3% of AGI
(% of AGI for various income ranges: 3.1% for AGIs below $25k, 4.1% for AGIs $25k-50k, 8.1% for AGIs $50k-75k, 8.2% for AGIs $75k-100k, 10.5% for AGIs $100k-200k)
Charity contributions: $2,430 (reported on 13.8% of returns)
Here:
$2,430
State:
$5,572
(% of AGI for various income ranges: 0.4% for AGIs $25k-50k, 0.4% for AGIs $50k-75k, 0.9% for AGIs $75k-100k, 1.4% for AGIs $100k-200k)
Taxes paid: $8,697 (reported on 18.6% of returns)
13491:
$8,697
State:
$18,656
(% of AGI for various income ranges: 0.8% for AGIs below $25k, 1.6% for AGIs $25k-50k, 2.8% for AGIs $50k-75k, 3.4% for AGIs $75k-100k, 6.5% for AGIs $100k-200k)
Earned income credit: $2,077 (reported on 18.0% of returns)
Here:
$2,077
State:
$2,230
(% of AGI for various income ranges: 5.0% for AGIs below $25k, 1.3% for AGIs $25k-50k)
Percentage of individuals using paid preparers for their 2012 taxes: 54.5%
Here:
54%
State:
66%
(% for various income ranges: 50.0% for AGIs below $25k, 55.6% for AGIs $25k-50k, 57.7% for AGIs $50k-75k, 56.2% for AGIs $75k-100k, 64.3% for AGIs $100k-200k)
Averages for the 2004 tax year for zip code 13491, filed in 2005:
Average Adjusted Gross Income (AGI) in 2004: $36,204 (Individual Income Tax Returns)
Here:
$36,204
State:
$59,519
Salary/wage: $32,585 (reported on 84.3% of returns)
Here:
$32,585
State:
$50,673
(% of AGI for various income ranges: 82.0% for AGIs below $10k, 75.3% for AGIs $10k-25k, 80.4% for AGIs $25k-50k, 83.0% for AGIs $50k-75k, 84.3% for AGIs $75k-100k, 51.2% for AGIs over 100k)
Taxable interest for individuals: $790 (reported on 46.5% of returns)
This zip code:
$790
New York:
$2,377
(% of AGI for various income ranges: 7.1% for AGIs below $10k, 1.5% for AGIs $10k-25k, 0.9% for AGIs $25k-50k, 0.7% for AGIs $50k-75k, 0.6% for AGIs $75k-100k, 0.8% for AGIs over 100k)
Taxable dividends: $2,044 (reported on 25.2% of returns)
Here:
$2,044
State:
$5,394
(% of AGI for various income ranges: 3.4% for AGIs below $10k, 2.0% for AGIs $10k-25k, 1.1% for AGIs $25k-50k, 1.2% for AGIs $50k-75k, 0.9% for AGIs $75k-100k, 2.2% for AGIs over 100k)
Net capital gain/loss: +$3,041 (reported on 18.0% of returns)
Here:
+$3,041
State:
+$23,581
(% of AGI for various income ranges: 3.6% for AGIs below $10k, 1.2% for AGIs $10k-25k, 0.7% for AGIs $25k-50k, 1.3% for AGIs $50k-75k, 0.7% for AGIs $75k-100k, 3.7% for AGIs over 100k)
Profit/loss from business: +$7,279 (reported on 15.2% of returns)
Here:
+$7,279
State:
+$13,809
(% of AGI for various income ranges: 5.0% for AGIs below $10k, 5.2% for AGIs $10k-25k, 3.3% for AGIs $25k-50k, 1.8% for AGIs $50k-75k, 1.9% for AGIs $75k-100k, 3.7% for AGIs over 100k)
IRA payment deduction: $2,750 (reported on 2.5% of returns)
13491:
$2,750
New York:
$3,115
Total itemized deductions: $13,994 (18% of AGI, reported on 19.5% of returns)
Here:
$13,994
State:
$25,864
Here:
18.3% of AGI
State:
21.9% of AGI
(% of AGI for various income ranges: 5.9% for AGIs $10k-25k, 6.3% for AGIs $25k-50k, 8.1% for AGIs $50k-75k, 9.8% for AGIs $75k-100k, 8.7% for AGIs over 100k)
Charity contributions deductions: $2,088 (3% of AGI, reported on 16.8% of returns)
Here:
$2,088
State:
$4,439
Here:
2.6% of AGI
State:
3.6% of AGI
(% of AGI for various income ranges: 0.6% for AGIs $10k-25k, 0.7% for AGIs $25k-50k, 1.0% for AGIs $50k-75k, 1.3% for AGIs $75k-100k, 1.4% for AGIs over 100k)
Total tax: $4,954 (reported on 69.9% of returns)
13491:
$4,954
State:
$11,730
(% of AGI for various income ranges: 3.7% for AGIs below $10k, 4.0% for AGIs $10k-25k, 6.3% for AGIs $25k-50k, 8.4% for AGIs $50k-75k, 10.7% for AGIs $75k-100k, 19.4% for AGIs over 100k)
Earned income credit: $1,799 (reported on 16.9% of returns)
Here:
$1,799
State:
$1,757
Percentage of individuals using paid preparers for their 2004 taxes: 59.7%
Here:
60%
State:
67%
(% for various income ranges: 52.3% for AGIs below $10k, 59.3% for AGIs $10k-25k, 63.9% for AGIs $25k-50k, 60.6% for AGIs $50k-75k, 63.7% for AGIs $75k-100k, 66.7% for AGIs over 100k)
Likely homosexual households (counted as self-reported same-sex unmarried-partner households)
Lesbian couples: 0.2% of all households
Gay men: 0.0% of all households
Household received Food Stamps/SNAP in the past 12 months: 189 Household did not receive Food Stamps/SNAP in the past 12 months: 1,172
Women who had a birth in the past 12 months: 40 (37 now married, 3 unmarried) Women who did not have a birth in the past 12 months: 853 (250 now married, 606 unmarried)
Housing units in zip code 13491 with a mortgage: 557 (79 second mortgage, 72 both second mortgage and home equity loan) Houses without a mortgage: 31
Median monthly owner costs for units with a mortgage: $1,182 Median monthly owner costs for units without a mortgage: $539
Residents with income below the poverty level in 2022:
This zip code:
13.2%
Whole state:
14.3%
Residents with income below 50% of the poverty level in 2022:
This zip code:
8.8%
Whole state:
6.8%
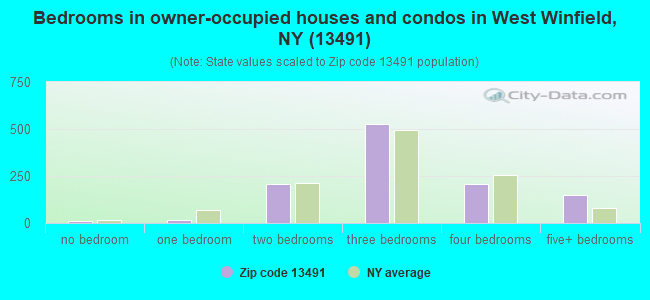
Median number of rooms in houses and condos:
Here:
6.5
State:
6.3
Median number of rooms in apartments:
Here:
4.4
State:
3.8
Notable locations in this zip code not listed on our city pages
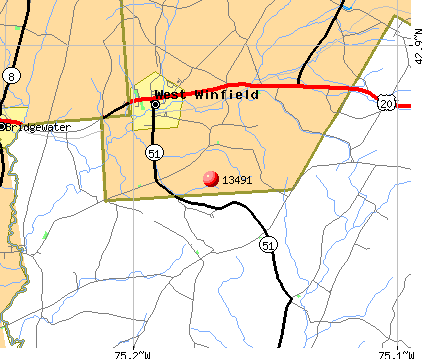
Notable locations in zip code 13491: Spooner Corners (A), Meeting House Green (B), River Forks (C), West Exeter Fire Department (D). Display/hide their locations on the map
Churches in zip code 13491 include: Millers Mills Community Baptist Church (A), Saint Joseph's Church (B), The Federated Church (C). Display/hide their locations on the map
Cemeteries: Saint Josephs Cemetery (1), Burgess Cemetery (2), West Winfield Cemetery (3), East Winfield Cemetery (4), Meeting House Green Cemetery (5), Millers Mills Cemetery (6), Bardin Cemetery (7). Display/hide their locations on the map
Size of family households: 470 2-persons, 152 3-persons, 164 4-persons, 90 5-persons, 23 6-persons, 36 7-or-more-persons
Size of nonfamily households: 342 1-person, 78 2-persons, 5 5-persons
488 married couples with children.
233 single-parent households (36 men, 197 women).
92.4% of residents of 13491 zip code speak English at home.
3.3% of residents speak Spanish at home (46% very well, 41% well, 14% not well).
3.7% of residents speak other Indo-European language at home (16% very well, 81% well, 3% not well).
0.5% of residents speak Asian or Pacific Island language at home (78% very well, 22% well).
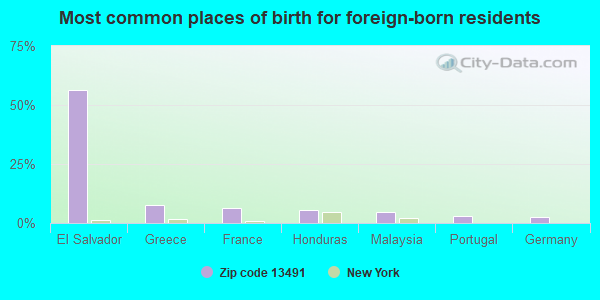
Foreign born population: 126 (3.3%) (26.4% of them are naturalized citizens)
This zip code:
3.3%
Whole state:
22.7%
56%El Salvador
8%Greece
6%France
5%Honduras
5%Malaysia
3%Portugal
2%Germany
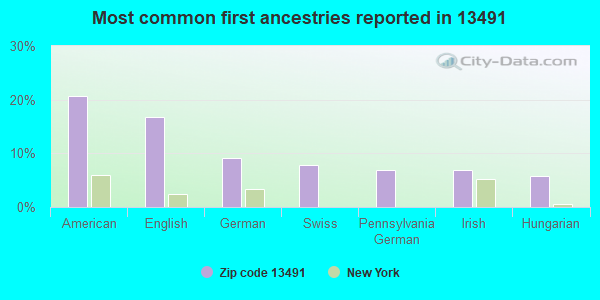
21%American
17%English
9%German
8%Swiss
7%Pennsylvania German
7%Irish
6%Hungarian
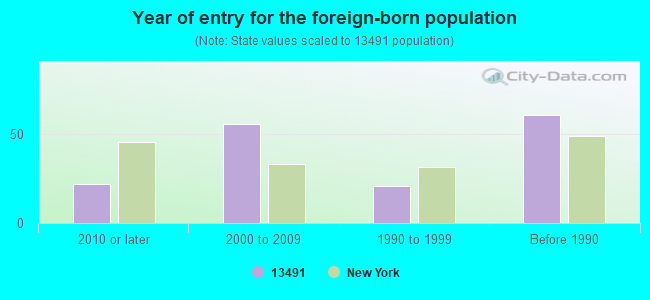
Year of entry for the foreign-born population
222010 or later
562000 to 2009
211990 to 1999
61Before 1990
Facilities with environmental interests located in this zip code:
HITEMAN LEATHER CO (RTE 51 in WEST WINFIELD, NY)
(Resource Conservation and Recovery Act (tracking hazardous waste)) Organizations: EARLE DAVIS (CONTACT/OWNER)
HERKIMER COUNTY BOCES (FAIRGROUND RD in WEST WINFIELD, NY)
Conditionally Exempt Small Quantity Generators, less than 100 kg/month of hazardous waste (Resource Conservation and Recovery Act (tracking hazardous waste)) - notification Organizations: MOUNT MARKHAM CENTRAL SCHOOL (CONTACT/OWNER)
HITEMAN LEATHER (173 SOUTH STREET in WEST WINFIELD, NY)
SUPERFUND NPL (Superfund database)
Housing units lacking complete plumbing facilities: 0.6% Housing units lacking complete kitchen facilities: 0.8%
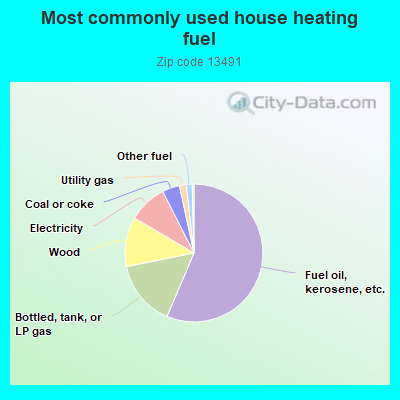
56.7%Fuel oil, kerosene, etc.
15.5%Bottled, tank, or LP gas
11.7%Wood
9.1%Electricity
4.1%Coal or coke
1.6%Utility gas
1.4%Other fuel
Population in 1990: 3,825.
Place of birth for U.S.-born residents:
This state: 3,153
Northeast: 261
Midwest: 85
South: 77
West: 37
73% of the 13491 zip code residents lived in the same house 5 years ago. Out of people who lived in different houses, 50% lived in this county. Out of people who lived in different counties, 50% lived in New York.
93% of the 13491 zip code residents lived in the same house 1 year ago. Out of people who lived in different houses, 41% moved from this county. Out of people who lived in different houses, 47% moved from different county within same state. Out of people who lived in different houses, 3% moved from different state. Out of people who lived in different houses, 9% moved from abroad.
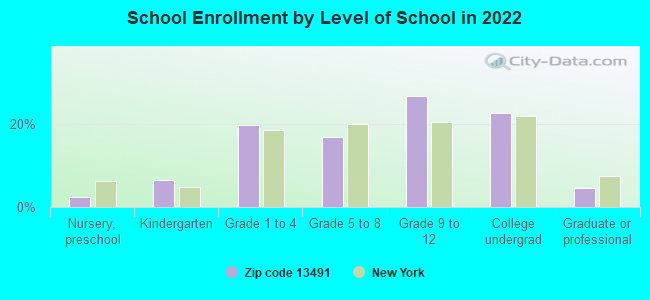
Private vs. public school enrollment:
Students in private schools in grades 1 to 8 (elementary and middle school): 30
Here:
9.5%
New York:
15.6%
Students in private schools in grades 9 to 12 (high school): 6
Here:
2.7%
New York:
15.0%
Students in private undergraduate colleges: 36
Here:
18.9%
New York:
39.2%
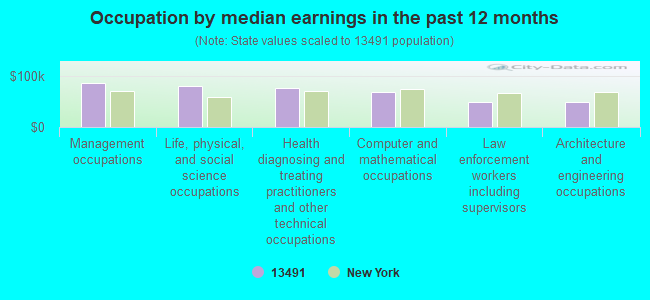
Occupation by median earnings in the past 12 months ($)
85,698Management occupations
80,608Life, physical, and social science occupations
76,058Health diagnosing and treating practitioners and other technical occupations
68,079Computer and mathematical occupations
49,173Law enforcement workers including supervisors
49,114Architecture and engineering occupations
Companies with federal contracts located in this zip code:
PRECISIONMATICS CO INC (1 HELMER AVE in WEST WINFIELD, NY; small business)
$4,194 with Army for Miscellaneous Fire Control Equipment. Signed on 2006-04-27. Completion date: 2006-06-16.
Top industries in this zip code by the number of employees in 2005:
Other Services (except Public Administration): Religious Organizations (10-19 employees: 1 establishment, 1-4 employees: 2 establishments)
Finance and Insurance: Insurance Agencies and Brokerages (10-19: 1)
Other Services (except Public Administration): General Automotive Repair (10-19: 1)
Administrative and Support and Waste Management and Remediation Services: Solid Waste Collection (10-19: 1)
Health Care and Social Assistance: All Other Outpatient Care Centers (10-19: 1)
Accommodation and Food Services: Limited-Service Restaurants (5-9: 2)
Construction: Residential Remodelers (1-4: 4)
Fatal accident statistics in 2012:
Fatal accident count: 1
Vehicles involved in fatal accidents: 2
Fatal accidents caused by drunken drivers: 0
Fatalities: 1
Persons involved in fatal accidents: 5
Pedestrians involved in fatal accidents: 0
Fatal accident statistics in 2011:
Fatal accident count: 1
Vehicles involved in fatal accidents: 2
Fatal accidents caused by drunken drivers: 0
Fatalities: 1
Persons involved in fatal accidents: 5
Pedestrians involved in fatal accidents: 0
Home Mortgage Disclosure Act Aggregated Statistics For Year 2009 (Based on 2 partial tracts)
A) FHA, FSA/RHS & VA Home Purchase Loans
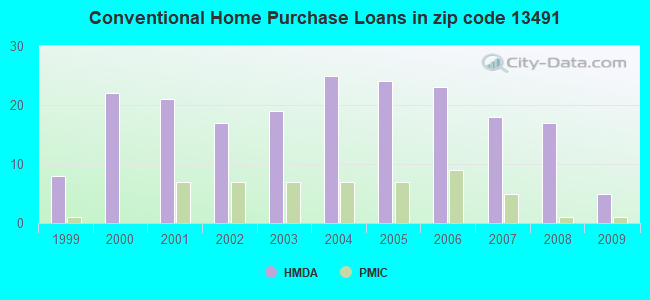
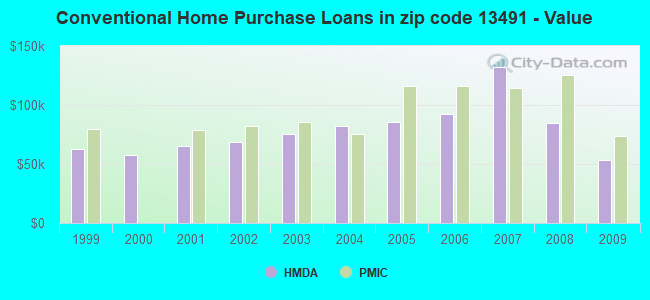
B) Conventional Home Purchase Loans
C) Refinancings
D) Home Improvement Loans
F) Non-occupant Loans on < 5 Family Dwellings (A B C & D)
G) Loans On Manufactured Home Dwelling (A B C & D)
Number
Average Value
Number
Average Value
Number
Average Value
Number
Average Value
Number
Average Value
Number
Average Value
LOANS ORIGINATED
6
$94,235
5
$53,768
37
$99,653
9
$19,322
1
$108,100
4
$60,748
APPLICATIONS APPROVED, NOT ACCEPTED
0
$0
1
$108,570
2
$122,200
1
$51,230
0
$0
0
$0
APPLICATIONS DENIED
1
$98,230
5
$69,936
12
$123,062
11
$20,338
0
$0
7
$46,463
APPLICATIONS WITHDRAWN
0
$0
0
$0
8
$124,080
0
$0
0
$0
1
$129,720
FILES CLOSED FOR INCOMPLETENESS
0
$0
0
$0
2
$207,270
0
$0
0
$0
0
$0
Aggregated Statistics For Year 2008 (Based on 2 partial tracts)
A) FHA, FSA/RHS & VA Home Purchase Loans
B) Conventional Home Purchase Loans
C) Refinancings
D) Home Improvement Loans
F) Non-occupant Loans on < 5 Family Dwellings (A B C & D)
G) Loans On Manufactured Home Dwelling (A B C & D)
Number
Average Value
Number
Average Value
Number
Average Value
Number
Average Value
Number
Average Value
Number
Average Value
LOANS ORIGINATED
6
$83,190
17
$85,070
33
$85,440
9
$45,851
1
$92,120
13
$65,185
APPLICATIONS APPROVED, NOT ACCEPTED
0
$0
6
$56,713
5
$84,882
1
$10,810
0
$0
5
$70,688
APPLICATIONS DENIED
0
$0
8
$120,026
29
$113,351
18
$27,286
2
$340,515
8
$64,390
APPLICATIONS WITHDRAWN
0
$0
1
$112,800
8
$127,664
1
$42,300
0
$0
0
$0
FILES CLOSED FOR INCOMPLETENESS
0
$0
1
$65,330
4
$140,412
0
$0
0
$0
0
$0
Aggregated Statistics For Year 2007 (Based on 2 partial tracts)
A) FHA, FSA/RHS & VA Home Purchase Loans
B) Conventional Home Purchase Loans
C) Refinancings
D) Home Improvement Loans
F) Non-occupant Loans on < 5 Family Dwellings (A B C & D)
G) Loans On Manufactured Home Dwelling (A B C & D)
Number
Average Value
Number
Average Value
Number
Average Value
Number
Average Value
Number
Average Value
Number
Average Value
LOANS ORIGINATED
3
$98,700
18
$132,331
34
$89,079
13
$36,082
4
$191,290
5
$64,672
APPLICATIONS APPROVED, NOT ACCEPTED
1
$67,680
7
$305,701
8
$93,471
4
$29,022
1
$963,500
5
$66,834
APPLICATIONS DENIED
0
$0
11
$275,634
35
$1,114,880
18
$37,704
1
$39,950
8
$75,846
APPLICATIONS WITHDRAWN
0
$0
1
$684,320
18
$109,693
1
$130,190
0
$0
2
$69,795
FILES CLOSED FOR INCOMPLETENESS
0
$0
0
$0
4
$119,850
0
$0
0
$0
0
$0
Aggregated Statistics For Year 2006 (Based on 2 partial tracts)
A) FHA, FSA/RHS & VA Home Purchase Loans
B) Conventional Home Purchase Loans
C) Refinancings
D) Home Improvement Loans
F) Non-occupant Loans on < 5 Family Dwellings (A B C & D)
G) Loans On Manufactured Home Dwelling (A B C & D)
Number
Average Value
Number
Average Value
Number
Average Value
Number
Average Value
Number
Average Value
Number
Average Value
LOANS ORIGINATED
5
$77,926
23
$92,345
37
$74,247
17
$26,431
4
$82,485
10
$49,773
APPLICATIONS APPROVED, NOT ACCEPTED
0
$0
5
$117,876
4
$90,828
4
$14,805
1
$79,430
1
$59,690
APPLICATIONS DENIED
2
$68,855
11
$105,280
42
$99,976
16
$32,577
3
$82,877
10
$60,959
APPLICATIONS WITHDRAWN
1
$68,620
4
$102,578
22
$94,299
2
$63,685
1
$72,850
2
$104,340
FILES CLOSED FOR INCOMPLETENESS
0
$0
1
$93,530
3
$119,067
0
$0
0
$0
0
$0
Aggregated Statistics For Year 2005 (Based on 2 partial tracts)
A) FHA, FSA/RHS & VA Home Purchase Loans
B) Conventional Home Purchase Loans
C) Refinancings
D) Home Improvement Loans
F) Non-occupant Loans on < 5 Family Dwellings (A B C & D)
G) Loans On Manufactured Home Dwelling (A B C & D)
Number
Average Value
Number
Average Value
Number
Average Value
Number
Average Value
Number
Average Value
Number
Average Value
LOANS ORIGINATED
7
$73,320
24
$85,305
38
$69,065
16
$33,429
3
$89,457
11
$61,057
APPLICATIONS APPROVED, NOT ACCEPTED
0
$0
0
$0
7
$101,923
1
$27,730
0
$0
0
$0
APPLICATIONS DENIED
1
$71,910
8
$140,706
49
$78,711
19
$31,762
3
$155,570
11
$61,997
APPLICATIONS WITHDRAWN
0
$0
3
$99,013
31
$96,714
1
$46,060
1
$57,810
3
$60,473
FILES CLOSED FOR INCOMPLETENESS
0
$0
2
$87,890
3
$127,370
1
$15,040
0
$0
0
$0
Aggregated Statistics For Year 2004 (Based on 2 partial tracts)
A) FHA, FSA/RHS & VA Home Purchase Loans
B) Conventional Home Purchase Loans
C) Refinancings
D) Home Improvement Loans
F) Non-occupant Loans on < 5 Family Dwellings (A B C & D)
G) Loans On Manufactured Home Dwelling (A B C & D)
Number
Average Value
Number
Average Value
Number
Average Value
Number
Average Value
Number
Average Value
Number
Average Value
LOANS ORIGINATED
6
$64,860
25
$82,382
47
$66,250
23
$25,748
3
$59,847
11
$48,367
APPLICATIONS APPROVED, NOT ACCEPTED
0
$0
3
$74,730
10
$78,302
1
$39,950
0
$0
1
$77,550
APPLICATIONS DENIED
1
$88,360
7
$62,376
34
$74,426
11
$34,267
1
$71,910
13
$59,328
APPLICATIONS WITHDRAWN
1
$41,360
3
$90,710
31
$78,429
3
$36,033
1
$50,760
6
$65,643
FILES CLOSED FOR INCOMPLETENESS
0
$0
2
$63,215
3
$79,743
2
$40,655
1
$81,310
0
$0
Aggregated Statistics For Year 2003 (Based on 2 partial tracts)
A) FHA, FSA/RHS & VA Home Purchase Loans
B) Conventional Home Purchase Loans
C) Refinancings
D) Home Improvement Loans
F) Non-occupant Loans on < 5 Family Dwellings (A B C & D)
Number
Average Value
Number
Average Value
Number
Average Value
Number
Average Value
Number
Average Value
LOANS ORIGINATED
5
$52,546
19
$75,546
62
$63,829
15
$25,067
2
$88,360
APPLICATIONS APPROVED, NOT ACCEPTED
0
$0
3
$60,160
11
$67,765
2
$21,855
1
$101,050
APPLICATIONS DENIED
0
$0
8
$62,686
42
$69,224
6
$15,275
3
$44,023
APPLICATIONS WITHDRAWN
1
$32,430
1
$104,810
32
$80,737
2
$45,825
1
$64,860
FILES CLOSED FOR INCOMPLETENESS
0
$0
0
$0
4
$73,085
0
$0
0
$0
Aggregated Statistics For Year 2002 (Based on 2 partial tracts)
A) FHA, FSA/RHS & VA Home Purchase Loans
B) Conventional Home Purchase Loans
C) Refinancings
D) Home Improvement Loans
F) Non-occupant Loans on < 5 Family Dwellings (A B C & D)
Number
Average Value
Number
Average Value
Number
Average Value
Number
Average Value
Number
Average Value
LOANS ORIGINATED
5
$65,612
17
$68,869
55
$63,168
21
$12,310
1
$113,270
APPLICATIONS APPROVED, NOT ACCEPTED
0
$0
1
$86,010
14
$49,182
1
$35,250
1
$48,880
APPLICATIONS DENIED
0
$0
8
$54,696
27
$62,249
9
$8,982
1
$53,110
APPLICATIONS WITHDRAWN
0
$0
1
$44,650
25
$67,172
2
$11,515
0
$0
FILES CLOSED FOR INCOMPLETENESS
0
$0
0
$0
4
$64,860
0
$0
0
$0
Aggregated Statistics For Year 2001 (Based on 2 partial tracts)
A) FHA, FSA/RHS & VA Home Purchase Loans
B) Conventional Home Purchase Loans
C) Refinancings
D) Home Improvement Loans
F) Non-occupant Loans on < 5 Family Dwellings (A B C & D)
Number
Average Value
Number
Average Value
Number
Average Value
Number
Average Value
Number
Average Value
LOANS ORIGINATED
2
$59,220
21
$65,599
39
$53,484
18
$18,931
1
$117,500
APPLICATIONS APPROVED, NOT ACCEPTED
0
$0
6
$44,728
11
$47,513
3
$66,740
0
$0
APPLICATIONS DENIED
0
$0
9
$56,452
36
$78,568
8
$22,619
3
$91,650
APPLICATIONS WITHDRAWN
1
$66,740
2
$59,220
21
$68,396
3
$28,200
2
$33,840
FILES CLOSED FOR INCOMPLETENESS
0
$0
0
$0
2
$57,575
0
$0
0
$0
Aggregated Statistics For Year 2000 (Based on 2 partial tracts)
A) FHA, FSA/RHS & VA Home Purchase Loans
B) Conventional Home Purchase Loans
C) Refinancings
D) Home Improvement Loans
F) Non-occupant Loans on < 5 Family Dwellings (A B C & D)
Number
Average Value
Number
Average Value
Number
Average Value
Number
Average Value
Number
Average Value
LOANS ORIGINATED
6
$52,875
22
$57,789
23
$51,557
32
$19,432
1
$98,700
APPLICATIONS APPROVED, NOT ACCEPTED
0
$0
6
$54,520
4
$59,102
4
$21,620
0
$0
APPLICATIONS DENIED
0
$0
19
$37,773
26
$53,580
13
$24,910
1
$45,590
APPLICATIONS WITHDRAWN
0
$0
1
$45,590
11
$56,186
1
$54,990
0
$0
FILES CLOSED FOR INCOMPLETENESS
0
$0
0
$0
4
$71,675
0
$0
0
$0
Aggregated Statistics For Year 1999 (Based on 1 partial tract)
A) FHA, FSA/RHS & VA Home Purchase Loans
B) Conventional Home Purchase Loans
C) Refinancings
D) Home Improvement Loans
F) Non-occupant Loans on < 5 Family Dwellings (A B C & D)
Detailed PMIC statistics for the following Tracts:0101.00
2002 - 2018 National Fire Incident Reporting System (NFIRS) incidents
Based on the data from the years 2002 - 2018 the average number of fire incidents per year is 8. The highest number of reported fire incidents - 14 took place in 2007, and the least - 2 in 2012. The data has a constant trend.
When looking into fire subcategories, the most incidents belonged to: Structure Fires (80.5%), and Other (7.0%).
Fire incident types reported to NFIRS in Zip Code 13491
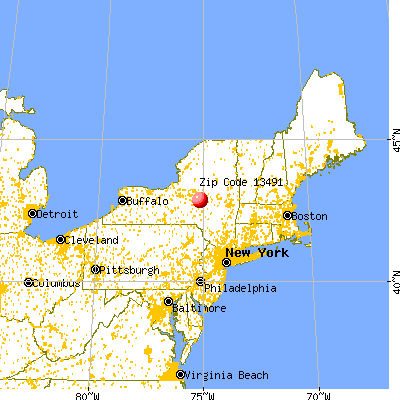


 Nearest zip codes: 13322, 13313, 13318, 13364, 13315, 13357.
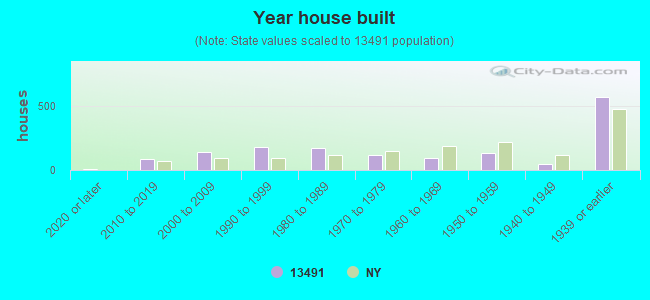


 Based on the data from the years 2002 - 2018 the average number of fire incidents per year is 8. The highest number of reported fire incidents - 14 took place in 2007, and the least - 2 in 2012. The data has a constant trend.
 When looking into fire subcategories, the most incidents belonged to: Structure Fires (80.5%), and Other (7.0%).