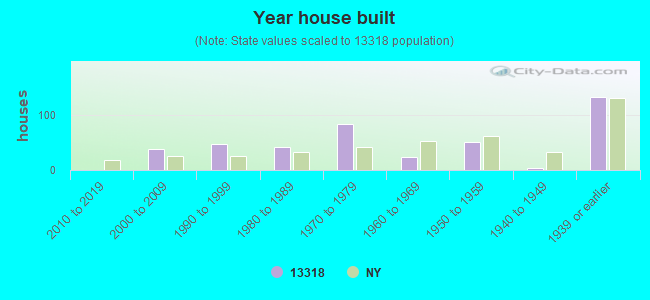
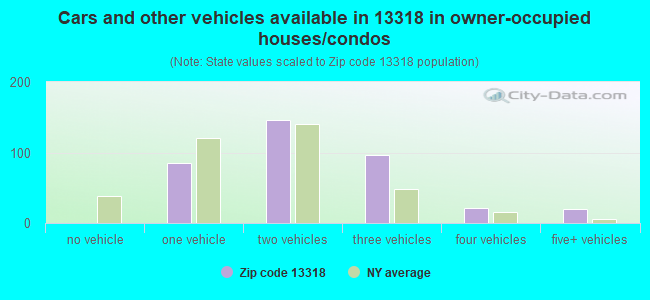
Estimated zip code population in 2022: 1,039 Zip code population in 2010: 1,325 Zip code population in 2000: 1,429
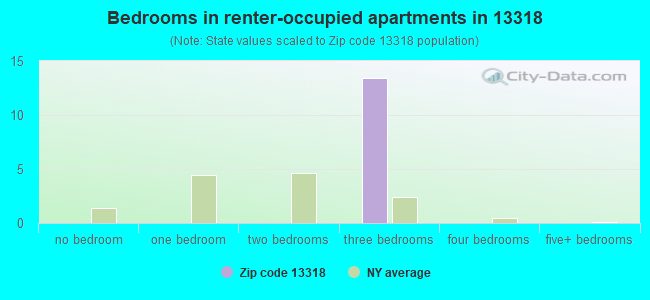
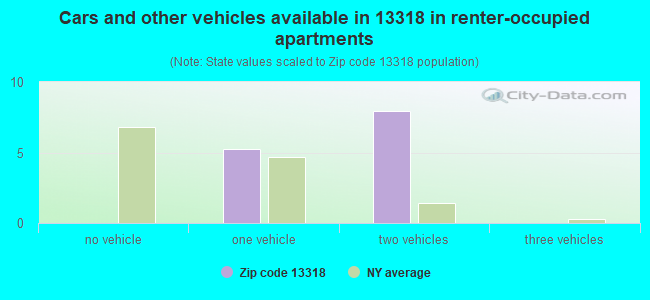
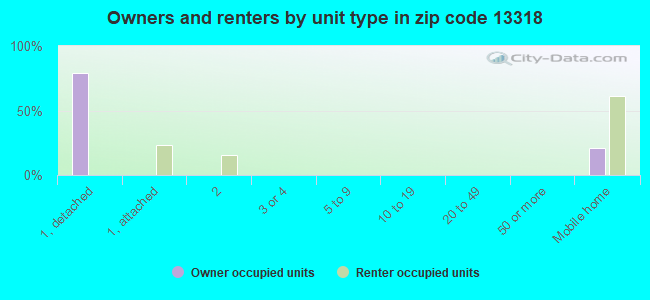
Houses and condos: 430 Renter-occupied apartments: 13
% of renters here:
3%
State:
46%
March 2022 cost of living index in zip code 13318: 92.4 (less than average, U.S. average is 100)
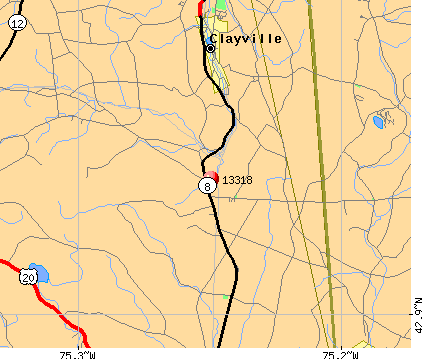
Land area: 25.4 sq. mi. Water area: 0.0 sq. mi.
Population density: 41 people per square mile
(very low).
OSM Map
General Map
Google Map
MSN Map
OSM Map
General Map
Google Map
MSN Map
OSM Map
General Map
Google Map
MSN Map
OSM Map
General Map
Google Map
MSN Map
Please wait while loading the map...
Real estate property taxes paid for housing units in 2022:
This zip code:
2.0% ($3,284)
New York:
1.5% ($6,180)
Median real estate property taxes paid for housing units with mortgages in 2022: $3,203 (1.9%) Median real estate property taxes paid for housing units with no mortgage in 2022: $3,278 (2.1%)
Business Search- 14 Million verified businesses
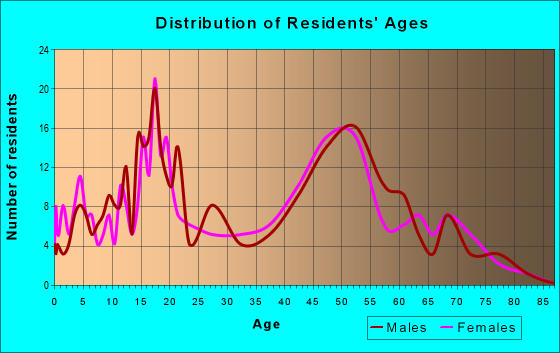
Males: 529
(51.0%)
Females: 509
(49.0%)
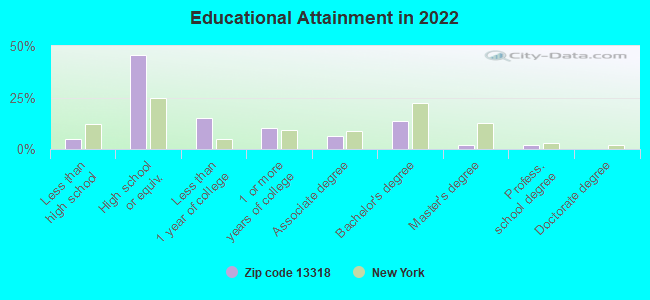
For population 25 years and over in 13318:
High school or higher: 93.7%
Bachelor's degree or higher: 17.4%
Graduate or professional degree: 4.0%
Unemployed: 1.8%
Mean travel time to work (commute): 22.3 minutes
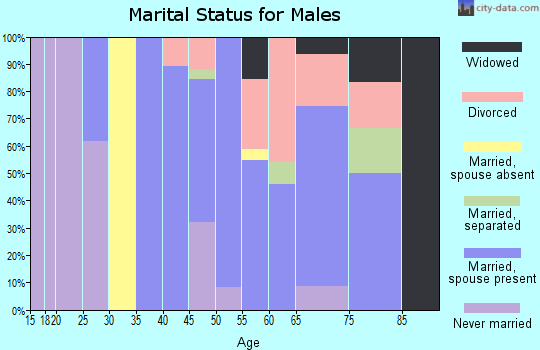
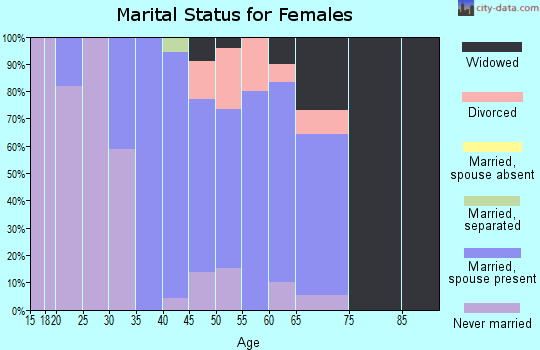
For population 15 years and over in 13318:
Never married: 35.6%
Now married: 49.9%
Separated: 2.2%
Widowed: 4.2%
Divorced: 8.2%
Zip code 13318 compared to state average:
Median house value significantly below state average.
Unemployed percentage below state average.
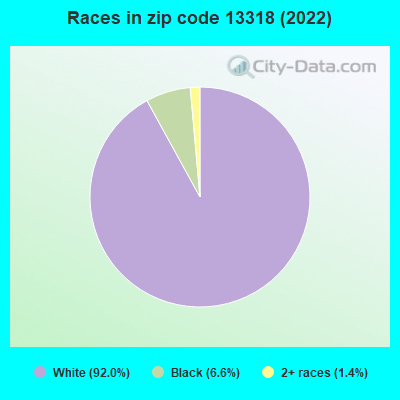
Black race population percentage below state average.
Hispanic race population percentage significantly below state average.
Foreign-born population percentage significantly below state average.
Renting percentage significantly below state average.
Length of stay since moving in significantly above state average.
Number of rooms per house above state average.
Percentage of population with a bachelor's degree or higher significantly below state average.
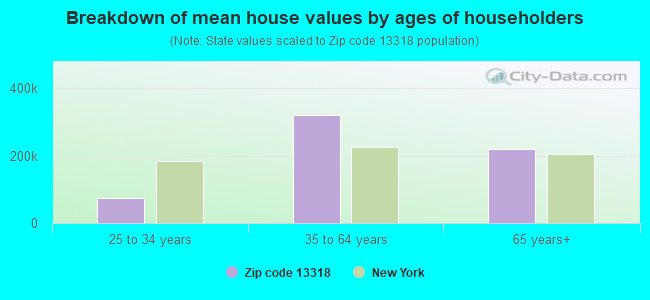
Estimated median house/condo value in 2022: $164,080
13318:
$164,080
New York:
$400,400
Median resident age:
This zip code:
39.5 years
New York median age:
40.0 years
Average household size:
This zip code:
2.7 people
New York:
2.5 people
Averages for the 2020 tax year for zip code 13318, filed in 2021:
Average Adjusted Gross Income (AGI) in 2020: $56,280 (Individual Income Tax Returns)
Here:
$56,280
State:
$90,930
Salary/wage: $45,888 (reported on 86.7% of returns)
Here:
$45,888
State:
$72,104
(% of AGI for various income ranges: 1202.5% for AGIs below $25k, 3812.1% for AGIs $25k-50k, 6671.4% for AGIs $50k-75k, 10155.0% for AGIs $75k-100k, 20875.0% for AGIs $100k-200k)
Taxable interest for individuals: $490 (reported on 35.0% of returns)
This zip code:
$490
New York:
$3,075
(% of AGI for various income ranges: 4.2% for AGIs below $25k, 17.9% for AGIs $25k-50k, 15.7% for AGIs $50k-75k, 32.5% for AGIs $75k-100k, 122.5% for AGIs $100k-200k)
Ordinary dividends: $3,067 (reported on 20.0% of returns)
Here:
$3,067
State:
$11,095
(% of AGI for various income ranges: 11.7% for AGIs below $25k, 21.4% for AGIs $25k-50k, 85.7% for AGIs $50k-75k, 660.0% for AGIs $100k-200k)
Net capital gain/loss in AGI: +$23,762 (reported on 13.3% of returns)
Here:
+$23,762
State:
+$44,925
(% of AGI for various income ranges: 48.3% for AGIs below $25k, 27.1% for AGIs $50k-75k, 4560.0% for AGIs $100k-200k)
Profit/loss from business: +$5,486 (reported on 11.7% of returns)
Here:
+$5,486
State:
+$14,940
(% of AGI for various income ranges: 194.3% for AGIs $25k-50k, 280.0% for AGIs $75k-100k)
Taxable individual retirement arrangement distribution: $8,780 (reported on 8.3% of returns)
13318:
$8,780
New York:
$19,609
(% of AGI for various income ranges: 124.2% for AGIs below $25k, 414.3% for AGIs $50k-75k)
Earned income credit: $2,267 (reported on 15.0% of returns)
Here:
$2,267
State:
$2,138
(% of AGI for various income ranges: 102.5% for AGIs below $25k, 57.9% for AGIs $25k-50k)
Percentage of individuals using paid preparers for their 2020 taxes: 95.0%
Here:
95%
State:
95%
(% for various income ranges: 94.1% for AGIs below $25k, 94.4% for AGIs $25k-50k, 90.0% for AGIs $50k-75k, 100.0% for AGIs $75k-100k, 100.0% for AGIs $100k-200k)
Averages for the 2012 tax year for zip code 13318, filed in 2013:
Average Adjusted Gross Income (AGI) in 2012: $43,427 (Individual Income Tax Returns)
Here:
$43,427
State:
$77,088
Salary/wage: $38,151 (reported on 88.3% of returns)
Here:
$38,151
State:
$60,593
(% of AGI for various income ranges: 77.6% for AGIs below $25k, 82.4% for AGIs $25k-50k, 78.2% for AGIs $50k-75k, 82.7% for AGIs $75k-100k, 69.3% for AGIs $100k-200k)
Taxable interest for individuals: $400 (reported on 35.0% of returns)
This zip code:
$400
New York:
$3,125
(% of AGI for various income ranges: 0.8% for AGIs below $25k, 0.4% for AGIs $25k-50k, 0.2% for AGIs $50k-75k, 0.1% for AGIs $75k-100k, 0.3% for AGIs $100k-200k)
Ordinary dividends: $1,583 (reported on 20.0% of returns)
Here:
$1,583
State:
$10,299
(% of AGI for various income ranges: 0.9% for AGIs below $25k, 1.6% for AGIs $25k-50k, 0.3% for AGIs $50k-75k, 0.6% for AGIs $100k-200k)
Net capital gain/loss in AGI: +$9,140 (reported on 8.3% of returns)
Here:
+$9,140
State:
+$42,474
Profit/loss from business: +$4,957 (reported on 11.7% of returns)
Here:
+$4,957
State:
+$16,168
Taxable individual retirement arrangement distribution: $10,300 (reported on 8.3% of returns)
13318:
$10,300
New York:
$17,621
Total itemized deductions: $16,633 (19% of AGI, reported on 20.0% of returns)
Here:
$16,633
State:
$34,985
Here:
19.1% of AGI
State:
21.3% of AGI
(% of AGI for various income ranges: 11.6% for AGIs below $25k, 9.2% for AGIs $50k-75k, 8.8% for AGIs $75k-100k, 11.5% for AGIs $100k-200k)
Charity contributions: $1,540 (reported on 16.7% of returns)
Here:
$1,540
State:
$5,572
(% of AGI for various income ranges: 1.4% for AGIs $50k-75k, 1.0% for AGIs $100k-200k)
Taxes paid: $7,800 (reported on 21.7% of returns)
13318:
$7,800
State:
$18,656
(% of AGI for various income ranges: 4.0% for AGIs below $25k, 4.1% for AGIs $50k-75k, 4.2% for AGIs $75k-100k, 7.3% for AGIs $100k-200k)
Earned income credit: $2,244 (reported on 15.0% of returns)
Here:
$2,244
State:
$2,230
(% of AGI for various income ranges: 4.6% for AGIs below $25k, 1.2% for AGIs $25k-50k)
Percentage of individuals using paid preparers for their 2012 taxes: 51.7%
Here:
52%
State:
66%
(% for various income ranges: 50.0% for AGIs below $25k, 47.4% for AGIs $25k-50k, 55.6% for AGIs $50k-75k, 60.0% for AGIs $75k-100k, 60.0% for AGIs $100k-200k)
Averages for the 2004 tax year for zip code 13318, filed in 2005:
Average Adjusted Gross Income (AGI) in 2004: $37,898 (Individual Income Tax Returns)
Here:
$37,898
State:
$59,519
Salary/wage: $34,443 (reported on 89.8% of returns)
Here:
$34,443
State:
$50,673
(% of AGI for various income ranges: 89.3% for AGIs below $10k, 82.1% for AGIs $10k-25k, 88.5% for AGIs $25k-50k, 82.8% for AGIs $50k-75k, 87.4% for AGIs $75k-100k, 59.0% for AGIs over 100k)
Taxable interest for individuals: $702 (reported on 48.2% of returns)
This zip code:
$702
New York:
$2,377
(% of AGI for various income ranges: 2.2% for AGIs below $10k, 1.7% for AGIs $10k-25k, 0.6% for AGIs $25k-50k, 1.2% for AGIs $50k-75k, 0.4% for AGIs $75k-100k, 0.7% for AGIs over 100k)
Taxable dividends: $1,238 (reported on 22.9% of returns)
Here:
$1,238
State:
$5,394
(% of AGI for various income ranges: 0.6% for AGIs below $10k, 0.9% for AGIs $10k-25k, 1.1% for AGIs $25k-50k, 0.8% for AGIs $50k-75k, 0.1% for AGIs $75k-100k, 0.7% for AGIs over 100k)
Net capital gain/loss: +$4,437 (reported on 15.8% of returns)
Here:
+$4,437
State:
+$23,581
(% of AGI for various income ranges: 6.1% for AGIs below $10k, 0.2% for AGIs $10k-25k, 2.6% for AGIs $25k-50k, 0.8% for AGIs $50k-75k, 4.9% for AGIs over 100k)
Profit/loss from business: +$4,130 (reported on 9.8% of returns)
Here:
+$4,130
State:
+$13,809
Total itemized deductions: $15,108 (20% of AGI, reported on 21.8% of returns)
Here:
$15,108
State:
$25,864
Here:
19.6% of AGI
State:
21.9% of AGI
(% of AGI for various income ranges: 7.7% for AGIs $25k-50k, 9.4% for AGIs $50k-75k, 12.8% for AGIs $75k-100k, 12.5% for AGIs over 100k)
Charity contributions deductions: $1,577 (2% of AGI, reported on 18.9% of returns)
Here:
$1,577
State:
$4,439
Here:
2.0% of AGI
State:
3.6% of AGI
(% of AGI for various income ranges: 0.4% for AGIs $25k-50k, 0.8% for AGIs $50k-75k, 1.5% for AGIs $75k-100k, 1.4% for AGIs over 100k)
Total tax: $3,961 (reported on 73.8% of returns)
13318:
$3,961
State:
$11,730
(% of AGI for various income ranges: 1.6% for AGIs below $10k, 4.3% for AGIs $10k-25k, 5.8% for AGIs $25k-50k, 8.3% for AGIs $50k-75k, 9.5% for AGIs $75k-100k, 11.6% for AGIs over 100k)
Earned income credit: $1,576 (reported on 16.7% of returns)
Here:
$1,576
State:
$1,757
Percentage of individuals using paid preparers for their 2004 taxes: 56.7%
Here:
57%
State:
67%
(% for various income ranges: 55.0% for AGIs below $10k, 55.0% for AGIs $10k-25k, 58.8% for AGIs $25k-50k, 55.2% for AGIs $50k-75k, 59.1% for AGIs $75k-100k, 63.2% for AGIs over 100k)
Household received Food Stamps/SNAP in the past 12 months: 60 Household did not receive Food Stamps/SNAP in the past 12 months: 330
Women who had a birth in the past 12 months: 4 (0 now married, 4 unmarried) Women who did not have a birth in the past 12 months: 183 (69 now married, 113 unmarried)
Housing units in zip code 13318 with a mortgage: 183 (4 second mortgage, 4 both second mortgage and home equity loan) Houses without a mortgage: 12
Median monthly owner costs for units with a mortgage: $1,311 Median monthly owner costs for units without a mortgage: $644
Residents with income below the poverty level in 2022:
This zip code:
9.0%
Whole state:
14.3%
Residents with income below 50% of the poverty level in 2022:
This zip code:
5.5%
Whole state:
6.8%
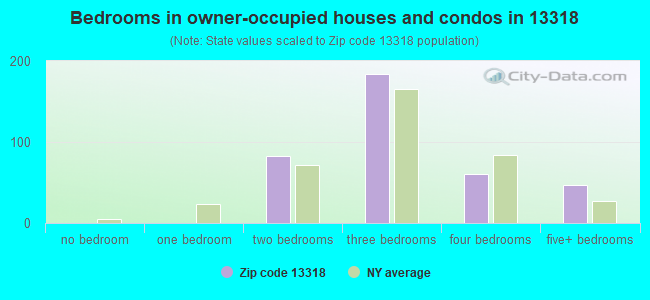
Median number of rooms in houses and condos:
Here:
6.9
State:
6.3
Median number of rooms in apartments:
Here:
4.3
State:
3.8
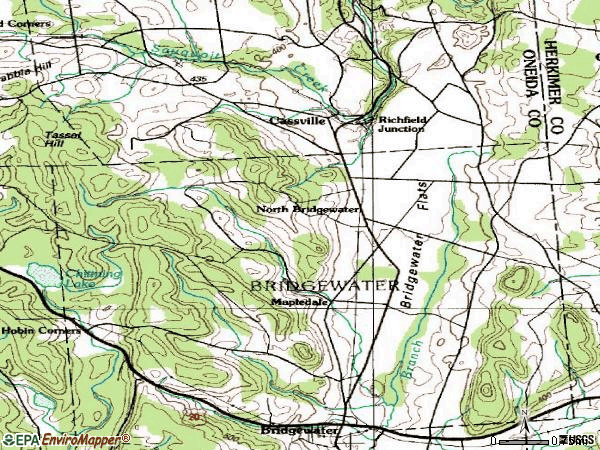
Notable locations in this zip code not listed on our city pages
Size of family households: 151 2-persons, 60 3-persons, 67 4-persons, 16 5-persons, 10 7-or-more-persons
Size of nonfamily households: 54 1-person, 24 2-persons, 4 4-persons
30 married couples with children.
126 single-parent households (71 men, 55 women).
99.5% of residents of 13318 zip code speak English at home.
0.3% of residents speak other Indo-European language at home (100% very well).
Foreign born population: 0 (0.0%)
:
0.0%
Whole state:
22.7%
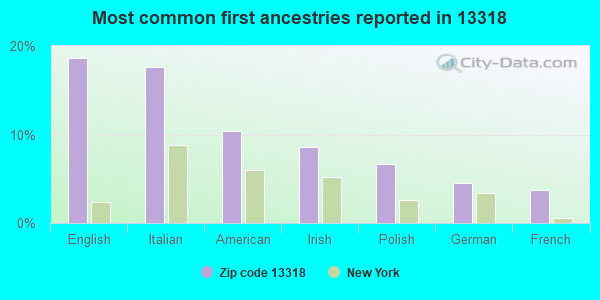
19%English
18%Italian
10%American
9%Irish
7%Polish
5%German
4%French
Facilities with environmental interests located in this zip code:
CURTIN DAIRY (MAPLEDALE ROAD in CASSVILLE, NY)
STATE MASTER (New York facility tracking) - National Pollutant Discharge Elimination System Permit National Pollutant Discharge Elimination System NON-MAJOR (Tracking pollutant discharge elimination systems) - permit Business SIC classification: GENERAL FARMS, PRIMARILY LIVESTOCK AND ANIMAL SPECIALTIES Organizations: JOHN CURTIN (CONTACT/OWNER)
Alternative names: JOHN CURTIN
Housing units lacking complete plumbing facilities: 3.7%
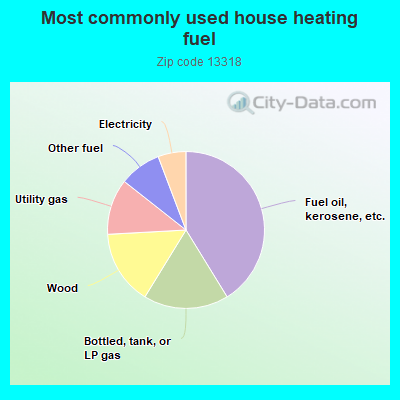
41.6%Fuel oil, kerosene, etc.
17.7%Bottled, tank, or LP gas
15.5%Wood
11.6%Utility gas
8.7%Other fuel
5.8%Electricity
Population in 1990: 1,566.
Place of birth for U.S.-born residents:
This state: 973
Northeast: 24
Midwest: 19
South: 16
West: 1
72% of the 13318 zip code residents lived in the same house 5 years ago. Out of people who lived in different houses, 68% lived in this county. Out of people who lived in different counties, 50% lived in New York.
98% of the 13318 zip code residents lived in the same house 1 year ago. Out of people who lived in different houses, 38% moved from this county. Out of people who lived in different houses, 50% moved from different county within same state.
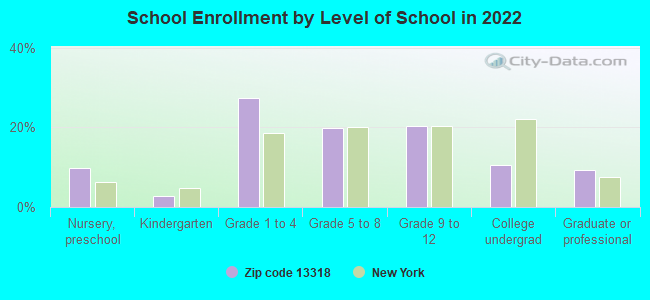
Private vs. public school enrollment:
Students in private schools in grades 1 to 8 (elementary and middle school):
Here:
0.0%
New York:
15.6%
Students in private schools in grades 9 to 12 (high school):
Here:
0.0%
New York:
15.0%
Students in private undergraduate colleges:
Here:
0.0%
New York:
39.2%
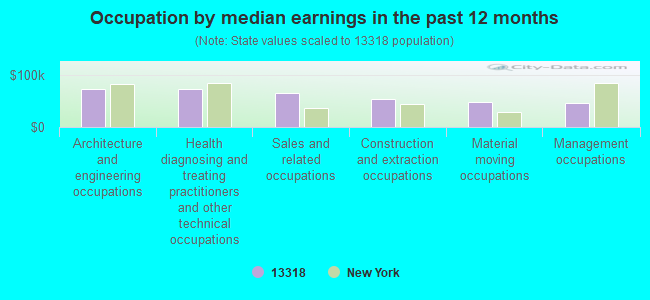
Occupation by median earnings in the past 12 months ($)
72,718Architecture and engineering occupations
71,833Health diagnosing and treating practitioners and other technical occupations
65,572Sales and related occupations
53,536Construction and extraction occupations
47,672Material moving occupations
45,817Management occupations
Top industries in this zip code by the number of employees in 2005:
Other Services (except Public Administration): Other Similar Organizations (except Business, Professional, Labor, and Political Organizations) (1-4 employees: 1 establishment)
Administrative and Support and Waste Management and Remediation Services: Janitorial Services (1-4: 1)
Other Services (except Public Administration): Pet Care (except Veterinary) Services (1-4: 1)
Construction: Water and Sewer Line and Related Structures Construction (1-4: 1)
Other Services (except Public Administration): Religious Organizations (1-4: 1)
Construction: All Other Specialty Trade Contractors (1-4: 1)
Fatal accident statistics in 2014:
Fatal accident count: 1
Vehicles involved in fatal accidents: 1
Fatal accidents caused by drunken drivers: 1
Fatalities: 1
Persons involved in fatal accidents: 2
Pedestrians involved in fatal accidents: 0
Fatal accident statistics in 2013:
Fatal accident count: 1
Vehicles involved in fatal accidents: 1
Fatal accidents caused by drunken drivers: 0
Fatalities: 1
Persons involved in fatal accidents: 3
Pedestrians involved in fatal accidents: 1
Home Mortgage Disclosure Act Aggregated Statistics For Year 2009 (Based on 4 partial tracts)
A) FHA, FSA/RHS & VA Home Purchase Loans
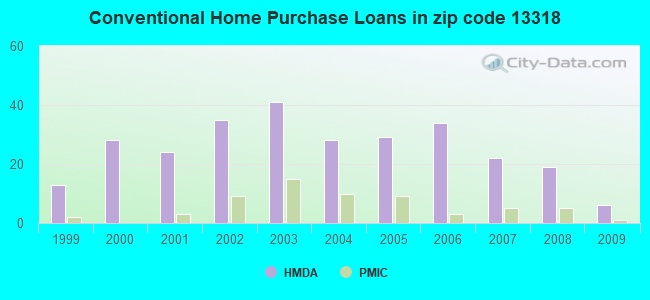
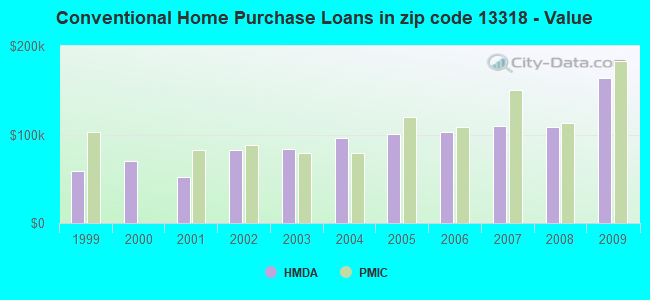
B) Conventional Home Purchase Loans
C) Refinancings
D) Home Improvement Loans
G) Loans On Manufactured Home Dwelling (A B C & D)
Number
Average Value
Number
Average Value
Number
Average Value
Number
Average Value
Number
Average Value
LOANS ORIGINATED
6
$105,427
6
$163,688
47
$110,877
8
$21,399
0
$0
APPLICATIONS APPROVED, NOT ACCEPTED
0
$0
0
$0
5
$62,626
2
$7,690
3
$54,253
APPLICATIONS DENIED
5
$95,206
2
$134,560
19
$111,006
9
$11,113
5
$84,994
APPLICATIONS WITHDRAWN
1
$146,150
1
$83,640
11
$121,356
0
$0
0
$0
FILES CLOSED FOR INCOMPLETENESS
0
$0
0
$0
1
$77,720
0
$0
0
$0
Aggregated Statistics For Year 2008 (Based on 4 partial tracts)
A) FHA, FSA/RHS & VA Home Purchase Loans
B) Conventional Home Purchase Loans
C) Refinancings
D) Home Improvement Loans
F) Non-occupant Loans on < 5 Family Dwellings (A B C & D)
G) Loans On Manufactured Home Dwelling (A B C & D)
Number
Average Value
Number
Average Value
Number
Average Value
Number
Average Value
Number
Average Value
Number
Average Value
LOANS ORIGINATED
5
$103,946
19
$107,943
26
$90,684
14
$21,950
0
$0
6
$77,102
APPLICATIONS APPROVED, NOT ACCEPTED
0
$0
3
$47,580
2
$119,330
2
$57,445
0
$0
2
$52,575
APPLICATIONS DENIED
1
$100,530
7
$48,623
26
$115,258
25
$22,690
4
$67,185
10
$57,915
APPLICATIONS WITHDRAWN
3
$90,420
0
$0
15
$82,452
2
$9,435
0
$0
0
$0
FILES CLOSED FOR INCOMPLETENESS
0
$0
0
$0
2
$161,780
0
$0
0
$0
0
$0
Aggregated Statistics For Year 2007 (Based on 4 partial tracts)
A) FHA, FSA/RHS & VA Home Purchase Loans
B) Conventional Home Purchase Loans
C) Refinancings
D) Home Improvement Loans
F) Non-occupant Loans on < 5 Family Dwellings (A B C & D)
G) Loans On Manufactured Home Dwelling (A B C & D)
Number
Average Value
Number
Average Value
Number
Average Value
Number
Average Value
Number
Average Value
Number
Average Value
LOANS ORIGINATED
9
$91,008
22
$110,032
44
$78,372
26
$39,453
1
$148,680
11
$45,695
APPLICATIONS APPROVED, NOT ACCEPTED
1
$83,640
4
$77,992
6
$127,223
2
$7,535
0
$0
3
$78,363
APPLICATIONS DENIED
0
$0
16
$58,270
37
$87,281
22
$24,967
3
$56,820
10
$35,290
APPLICATIONS WITHDRAWN
0
$0
4
$189,985
13
$117,813
5
$31,964
0
$0
0
$0
FILES CLOSED FOR INCOMPLETENESS
0
$0
1
$104,760
5
$103,856
0
$0
0
$0
0
$0
Aggregated Statistics For Year 2006 (Based on 4 partial tracts)
A) FHA, FSA/RHS & VA Home Purchase Loans
B) Conventional Home Purchase Loans
C) Refinancings
D) Home Improvement Loans
F) Non-occupant Loans on < 5 Family Dwellings (A B C & D)
G) Loans On Manufactured Home Dwelling (A B C & D)
Number
Average Value
Number
Average Value
Number
Average Value
Number
Average Value
Number
Average Value
Number
Average Value
LOANS ORIGINATED
7
$66,526
34
$102,824
44
$74,767
20
$31,192
2
$111,725
10
$63,352
APPLICATIONS APPROVED, NOT ACCEPTED
0
$0
4
$109,848
7
$109,776
2
$25,265
0
$0
2
$52,845
APPLICATIONS DENIED
2
$30,140
14
$67,621
63
$87,492
34
$23,315
0
$0
16
$65,691
APPLICATIONS WITHDRAWN
0
$0
5
$102,648
26
$98,750
2
$119,600
3
$77,670
2
$37,675
FILES CLOSED FOR INCOMPLETENESS
5
$66,006
1
$139,810
4
$88,580
0
$0
0
$0
0
$0
Aggregated Statistics For Year 2005 (Based on 4 partial tracts)
A) FHA, FSA/RHS & VA Home Purchase Loans
B) Conventional Home Purchase Loans
C) Refinancings
D) Home Improvement Loans
F) Non-occupant Loans on < 5 Family Dwellings (A B C & D)
G) Loans On Manufactured Home Dwelling (A B C & D)
Number
Average Value
Number
Average Value
Number
Average Value
Number
Average Value
Number
Average Value
Number
Average Value
LOANS ORIGINATED
6
$89,353
29
$101,084
49
$78,628
18
$24,052
2
$57,870
8
$64,200
APPLICATIONS APPROVED, NOT ACCEPTED
0
$0
4
$46,868
11
$67,612
5
$24,112
0
$0
3
$46,017
APPLICATIONS DENIED
0
$0
20
$61,950
43
$86,173
39
$20,273
5
$10,290
24
$40,893
APPLICATIONS WITHDRAWN
2
$79,115
2
$99,055
24
$99,729
9
$88,747
0
$0
3
$88,077
FILES CLOSED FOR INCOMPLETENESS
0
$0
1
$64,630
4
$112,875
3
$32,030
0
$0
0
$0
Aggregated Statistics For Year 2004 (Based on 4 partial tracts)
A) FHA, FSA/RHS & VA Home Purchase Loans
B) Conventional Home Purchase Loans
C) Refinancings
D) Home Improvement Loans
F) Non-occupant Loans on < 5 Family Dwellings (A B C & D)
G) Loans On Manufactured Home Dwelling (A B C & D)
Number
Average Value
Number
Average Value
Number
Average Value
Number
Average Value
Number
Average Value
Number
Average Value
LOANS ORIGINATED
10
$86,555
28
$95,520
50
$80,731
24
$25,818
2
$123,340
9
$83,443
APPLICATIONS APPROVED, NOT ACCEPTED
0
$0
4
$41,932
6
$88,840
5
$21,920
0
$0
2
$18,085
APPLICATIONS DENIED
0
$0
7
$40,954
47
$70,987
14
$20,672
2
$36,285
12
$40,615
APPLICATIONS WITHDRAWN
2
$46,615
4
$104,358
39
$94,146
2
$45,875
0
$0
14
$66,308
FILES CLOSED FOR INCOMPLETENESS
0
$0
1
$65,890
4
$55,302
1
$37,590
0
$0
0
$0
Aggregated Statistics For Year 2003 (Based on 4 partial tracts)
A) FHA, FSA/RHS & VA Home Purchase Loans
B) Conventional Home Purchase Loans
C) Refinancings
D) Home Improvement Loans
F) Non-occupant Loans on < 5 Family Dwellings (A B C & D)
Number
Average Value
Number
Average Value
Number
Average Value
Number
Average Value
Number
Average Value
LOANS ORIGINATED
9
$98,250
41
$83,350
98
$83,134
15
$20,553
1
$74,760
APPLICATIONS APPROVED, NOT ACCEPTED
2
$19,590
12
$69,747
9
$67,047
1
$22,390
3
$94,940
APPLICATIONS DENIED
0
$0
9
$71,377
56
$61,467
5
$26,538
3
$36,447
APPLICATIONS WITHDRAWN
0
$0
5
$73,312
30
$91,024
0
$0
0
$0
FILES CLOSED FOR INCOMPLETENESS
0
$0
1
$94,200
3
$95,993
0
$0
0
$0
Aggregated Statistics For Year 2002 (Based on 4 partial tracts)
A) FHA, FSA/RHS & VA Home Purchase Loans
B) Conventional Home Purchase Loans
C) Refinancings
D) Home Improvement Loans
F) Non-occupant Loans on < 5 Family Dwellings (A B C & D)
Number
Average Value
Number
Average Value
Number
Average Value
Number
Average Value
Number
Average Value
LOANS ORIGINATED
12
$71,171
35
$82,781
69
$65,955
21
$18,439
4
$46,205
APPLICATIONS APPROVED, NOT ACCEPTED
0
$0
7
$53,741
10
$50,821
5
$20,482
0
$0
APPLICATIONS DENIED
1
$74,760
9
$42,898
59
$61,913
13
$13,573
0
$0
APPLICATIONS WITHDRAWN
2
$63,465
4
$74,068
55
$60,705
3
$16,580
0
$0
FILES CLOSED FOR INCOMPLETENESS
0
$0
0
$0
5
$54,150
0
$0
0
$0
Aggregated Statistics For Year 2001 (Based on 4 partial tracts)
A) FHA, FSA/RHS & VA Home Purchase Loans
B) Conventional Home Purchase Loans
C) Refinancings
D) Home Improvement Loans
F) Non-occupant Loans on < 5 Family Dwellings (A B C & D)
Number
Average Value
Number
Average Value
Number
Average Value
Number
Average Value
Number
Average Value
LOANS ORIGINATED
5
$83,538
24
$52,272
63
$56,289
21
$11,165
4
$27,692
APPLICATIONS APPROVED, NOT ACCEPTED
0
$0
5
$46,274
5
$66,548
5
$18,656
0
$0
APPLICATIONS DENIED
0
$0
18
$44,781
35
$49,112
18
$18,324
1
$35,480
APPLICATIONS WITHDRAWN
0
$0
1
$78,570
26
$56,783
4
$28,515
0
$0
FILES CLOSED FOR INCOMPLETENESS
0
$0
0
$0
6
$106,050
2
$15,825
2
$66,310
Aggregated Statistics For Year 2000 (Based on 4 partial tracts)
A) FHA, FSA/RHS & VA Home Purchase Loans
B) Conventional Home Purchase Loans
C) Refinancings
D) Home Improvement Loans
Number
Average Value
Number
Average Value
Number
Average Value
Number
Average Value
LOANS ORIGINATED
4
$75,398
28
$70,612
17
$46,304
22
$31,919
APPLICATIONS APPROVED, NOT ACCEPTED
0
$0
8
$50,935
6
$24,540
3
$32,173
APPLICATIONS DENIED
4
$38,550
19
$59,684
25
$50,635
16
$8,829
APPLICATIONS WITHDRAWN
2
$37,675
2
$61,795
8
$41,226
3
$36,360
FILES CLOSED FOR INCOMPLETENESS
0
$0
0
$0
4
$64,375
0
$0
Aggregated Statistics For Year 1999 (Based on 2 partial tracts)
A) FHA, FSA/RHS & VA Home Purchase Loans
B) Conventional Home Purchase Loans
C) Refinancings
D) Home Improvement Loans
F) Non-occupant Loans on < 5 Family Dwellings (A B C & D)
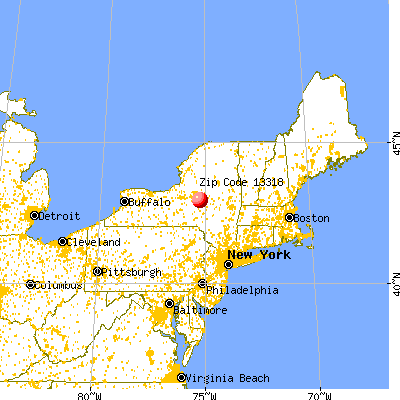


 Nearest zip codes: 13313, 13322, 13456, 13480, 13319, 13491.