Estimated zip code population in 2022: 3,913 Zip code population in 2010: 4,164 Zip code population in 2000: 4,277
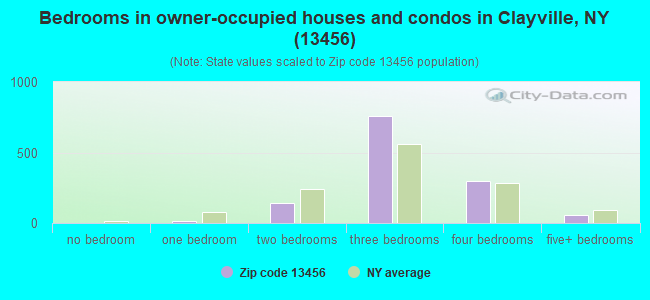
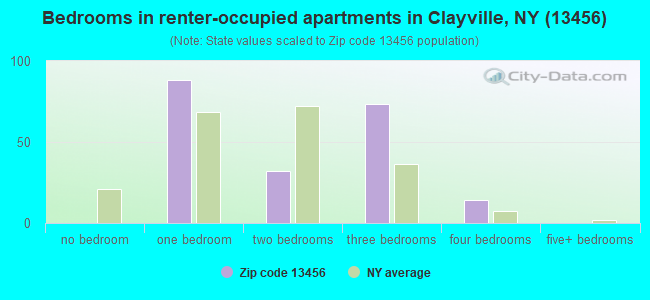
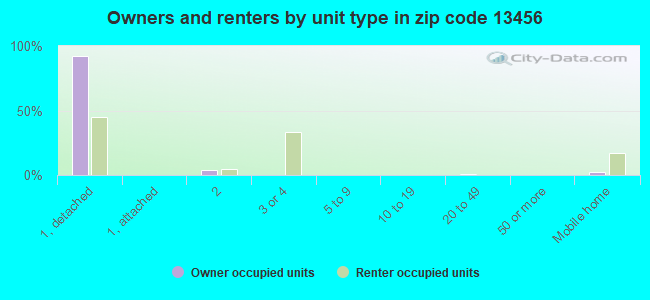
Houses and condos: 1,537 Renter-occupied apartments: 208
% of renters here:
14%
State:
46%
March 2022 cost of living index in zip code 13456: 94.9 (less than average, U.S. average is 100)
Land area: 28.1 sq. mi. Water area: 0.0 sq. mi.
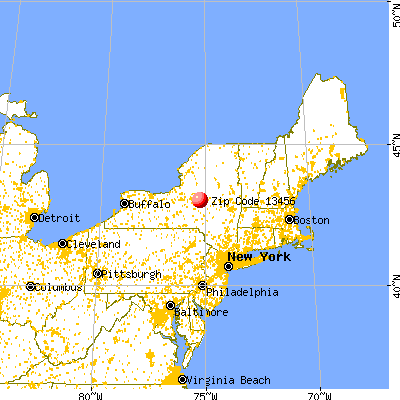
Population density: 139 people per square mile
(very low).
OSM Map
General Map
Google Map
MSN Map
OSM Map
General Map
Google Map
MSN Map
OSM Map
General Map
Google Map
MSN Map
OSM Map
General Map
Google Map
MSN Map
Please wait while loading the map...
Real estate property taxes paid for housing units in 2022:
This zip code:
2.0% ($4,643)
New York:
1.5% ($6,180)
Median real estate property taxes paid for housing units with mortgages in 2022: $5,197 (2.0%) Median real estate property taxes paid for housing units with no mortgage in 2022: $4,194 (2.3%)
Business Search- 14 Million verified businesses
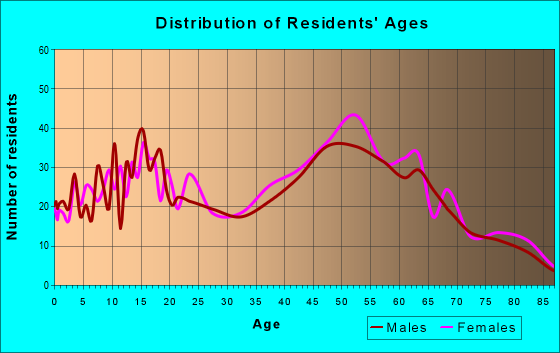
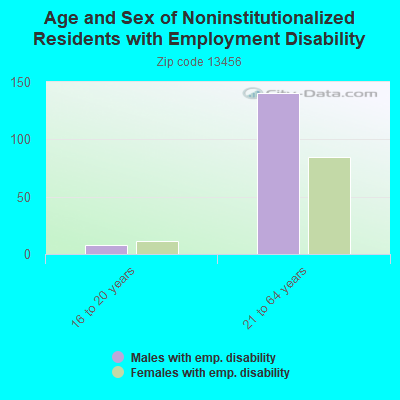
Males: 2,012
(51.4%)
Females: 1,901
(48.6%)
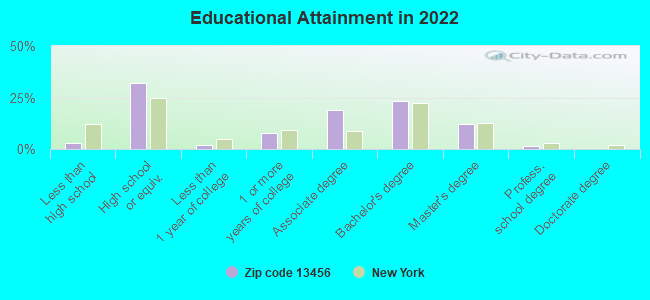
For population 25 years and over in 13456:
High school or higher: 97.2%
Bachelor's degree or higher: 37.0%
Graduate or professional degree: 13.8%
Unemployed: 2.0%
Mean travel time to work (commute): 18.7 minutes
For population 15 years and over in 13456:
Never married: 25.9%
Now married: 61.9%
Separated: 0.7%
Widowed: 2.6%
Divorced: 8.9%
Zip code 13456 compared to state average:
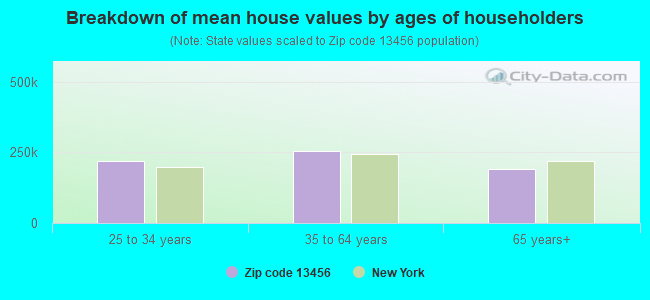
Median house value below state average.
Unemployed percentage below state average.
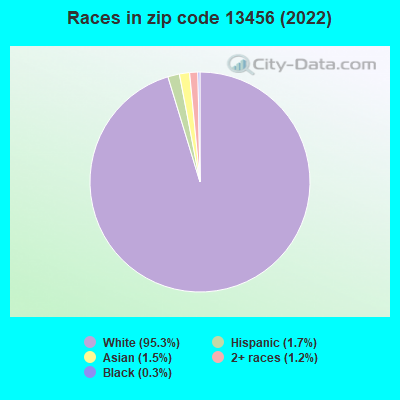
Black race population percentage significantly below state average.
Hispanic race population percentage significantly below state average.
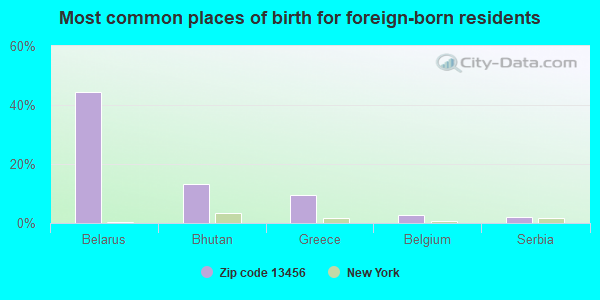
Foreign-born population percentage significantly below state average.
Renting percentage significantly below state average.
Estimated median house/condo value in 2022: $238,093
13456:
$238,093
New York:
$400,400
According to our research of New York and other state lists, there were 2 registered sex offenders living in 13456 zip code as of May 05, 2024. The ratio of all residents to sex offenders in zip code 13456 is 2,099 to 1. The ratio of registered sex offenders to all residents in this zip code is lower than the state average.
Median resident age:
This zip code:
39.6 years
New York median age:
40.0 years
Average household size:
This zip code:
2.6 people
New York:
2.5 people
Averages for the 2020 tax year for zip code 13456, filed in 2021:
Average Adjusted Gross Income (AGI) in 2020: $68,605 (Individual Income Tax Returns)
Here:
$68,605
State:
$90,930
Salary/wage: $59,380 (reported on 81.4% of returns)
Here:
$59,380
State:
$72,104
(% of AGI for various income ranges: 1143.4% for AGIs below $25k, 3754.1% for AGIs $25k-50k, 5882.9% for AGIs $50k-75k, 9966.2% for AGIs $75k-100k, 17745.5% for AGIs $100k-200k, 68285.0% for AGIs over 200k)
Taxable interest for individuals: $831 (reported on 48.7% of returns)
This zip code:
$831
New York:
$3,075
(% of AGI for various income ranges: 24.1% for AGIs below $25k, 32.1% for AGIs $25k-50k, 43.3% for AGIs $50k-75k, 92.3% for AGIs $75k-100k, 121.8% for AGIs $100k-200k, 640.0% for AGIs over 200k)
Ordinary dividends: $3,461 (reported on 25.6% of returns)
Here:
$3,461
State:
$11,095
(% of AGI for various income ranges: 43.1% for AGIs below $25k, 28.5% for AGIs $25k-50k, 128.8% for AGIs $50k-75k, 206.2% for AGIs $75k-100k, 296.4% for AGIs $100k-200k, 1505.0% for AGIs over 200k)
Net capital gain/loss in AGI: +$7,649 (reported on 20.6% of returns)
Here:
+$7,649
State:
+$44,925
(% of AGI for various income ranges: 22.8% for AGIs below $25k, 42.6% for AGIs $25k-50k, 52.5% for AGIs $50k-75k, 309.2% for AGIs $75k-100k, 445.0% for AGIs $100k-200k, 7055.0% for AGIs over 200k)
Profit/loss from business: +$14,771 (reported on 14.1% of returns)
Here:
+$14,771
State:
+$14,940
(% of AGI for various income ranges: 137.2% for AGIs below $25k, 110.0% for AGIs $25k-50k, 199.2% for AGIs $50k-75k, 411.5% for AGIs $75k-100k, 423.2% for AGIs $100k-200k, 6895.0% for AGIs over 200k)
Taxable individual retirement arrangement distribution: $18,212 (reported on 12.1% of returns)
13456:
$18,212
New York:
$19,609
(% of AGI for various income ranges: 94.7% for AGIs below $25k, 153.2% for AGIs $25k-50k, 204.6% for AGIs $50k-75k, 530.8% for AGIs $75k-100k, 1075.5% for AGIs $100k-200k)
Total itemized deductions: $28,214 (reported on 3.5% of returns)
Here:
$28,214
State:
$39,326
(% of AGI for various income ranges: 466.7% for AGIs $50k-75k, 388.6% for AGIs $100k-200k)
Charity contributions: $4,000 (reported on 2.5% of returns)
Here:
$4,000
State:
$15,420
(% of AGI for various income ranges: 24.1% for AGIs $25k-50k, 53.6% for AGIs $100k-200k)
Taxes paid: $8,800 (reported on 3.5% of returns)
13456:
$8,800
State:
$9,183
(% of AGI for various income ranges: 142.9% for AGIs $50k-75k, 124.1% for AGIs $100k-200k)
Earned income credit: $2,010 (reported on 10.6% of returns)
Here:
$2,010
State:
$2,138
(% of AGI for various income ranges: 73.4% for AGIs below $25k, 55.0% for AGIs $25k-50k)
Percentage of individuals using paid preparers for their 2020 taxes: 95.0%
Here:
95%
State:
95%
(% for various income ranges: 96.1% for AGIs below $25k, 93.6% for AGIs $25k-50k, 96.9% for AGIs $50k-75k, 95.5% for AGIs $75k-100k, 94.9% for AGIs $100k-200k, 87.5% for AGIs over 200k)
Averages for the 2012 tax year for zip code 13456, filed in 2013:
Average Adjusted Gross Income (AGI) in 2012: $53,693 (Individual Income Tax Returns)
Here:
$53,693
State:
$77,088
Salary/wage: $48,624 (reported on 83.7% of returns)
Here:
$48,624
State:
$60,593
(% of AGI for various income ranges: 72.6% for AGIs below $25k, 78.0% for AGIs $25k-50k, 74.8% for AGIs $50k-75k, 76.0% for AGIs $75k-100k, 78.5% for AGIs $100k-200k, 64.9% for AGIs over 200k)
Taxable interest for individuals: $772 (reported on 50.0% of returns)
This zip code:
$772
New York:
$3,125
(% of AGI for various income ranges: 1.4% for AGIs below $25k, 0.5% for AGIs $25k-50k, 0.8% for AGIs $50k-75k, 1.0% for AGIs $75k-100k, 0.6% for AGIs $100k-200k, 0.3% for AGIs over 200k)
Ordinary dividends: $2,516 (reported on 27.2% of returns)
Here:
$2,516
State:
$10,299
(% of AGI for various income ranges: 2.0% for AGIs below $25k, 0.7% for AGIs $25k-50k, 1.2% for AGIs $50k-75k, 1.8% for AGIs $75k-100k, 1.1% for AGIs $100k-200k, 1.3% for AGIs over 200k)
Net capital gain/loss in AGI: +$1,951 (reported on 17.3% of returns)
Here:
+$1,951
State:
+$42,474
(% of AGI for various income ranges: 0.1% for AGIs $25k-50k, 0.6% for AGIs $50k-75k, 0.8% for AGIs $75k-100k, 1.2% for AGIs $100k-200k)
Profit/loss from business: +$11,032 (reported on 13.9% of returns)
Here:
+$11,032
State:
+$16,168
(% of AGI for various income ranges: 5.8% for AGIs below $25k, 1.9% for AGIs $25k-50k, 2.2% for AGIs $50k-75k, 2.1% for AGIs $75k-100k, 4.1% for AGIs $100k-200k)
Taxable individual retirement arrangement distribution: $9,750 (reported on 11.9% of returns)
13456:
$9,750
New York:
$17,621
(% of AGI for various income ranges: 4.0% for AGIs below $25k, 2.5% for AGIs $25k-50k, 1.5% for AGIs $50k-75k, 2.0% for AGIs $75k-100k, 2.5% for AGIs $100k-200k)
Total itemized deductions: $18,956 (19% of AGI, reported on 31.2% of returns)
Here:
$18,956
State:
$34,985
Here:
19.5% of AGI
State:
21.3% of AGI
(% of AGI for various income ranges: 5.8% for AGIs below $25k, 6.5% for AGIs $25k-50k, 9.2% for AGIs $50k-75k, 12.9% for AGIs $75k-100k, 13.6% for AGIs $100k-200k, 14.1% for AGIs over 200k)
Charity contributions: $2,289 (reported on 26.2% of returns)
Here:
$2,289
State:
$5,572
(% of AGI for various income ranges: 0.6% for AGIs $25k-50k, 0.8% for AGIs $50k-75k, 1.3% for AGIs $75k-100k, 1.5% for AGIs $100k-200k, 1.8% for AGIs over 200k)
Taxes paid: $10,016 (reported on 31.2% of returns)
13456:
$10,016
State:
$18,656
(% of AGI for various income ranges: 1.8% for AGIs below $25k, 3.0% for AGIs $25k-50k, 4.1% for AGIs $50k-75k, 6.1% for AGIs $75k-100k, 8.0% for AGIs $100k-200k, 9.5% for AGIs over 200k)
Earned income credit: $1,871 (reported on 11.9% of returns)
Here:
$1,871
State:
$2,230
(% of AGI for various income ranges: 3.6% for AGIs below $25k, 0.8% for AGIs $25k-50k)
Percentage of individuals using paid preparers for their 2012 taxes: 57.4%
Here:
57%
State:
66%
(% for various income ranges: 52.8% for AGIs below $25k, 52.1% for AGIs $25k-50k, 60.0% for AGIs $50k-75k, 66.7% for AGIs $75k-100k, 64.3% for AGIs $100k-200k, 100.0% for AGIs over 200k)
Averages for the 2004 tax year for zip code 13456, filed in 2005:
Average Adjusted Gross Income (AGI) in 2004: $41,828 (Individual Income Tax Returns)
Here:
$41,828
State:
$59,519
Salary/wage: $39,196 (reported on 84.1% of returns)
Here:
$39,196
State:
$50,673
(% of AGI for various income ranges: 119.7% for AGIs below $10k, 75.6% for AGIs $10k-25k, 79.9% for AGIs $25k-50k, 79.7% for AGIs $50k-75k, 85.0% for AGIs $75k-100k, 72.0% for AGIs over 100k)
Taxable interest for individuals: $895 (reported on 57.4% of returns)
This zip code:
$895
New York:
$2,377
(% of AGI for various income ranges: 7.1% for AGIs below $10k, 2.0% for AGIs $10k-25k, 1.3% for AGIs $25k-50k, 1.3% for AGIs $50k-75k, 1.1% for AGIs $75k-100k, 0.7% for AGIs over 100k)
Taxable dividends: $1,568 (reported on 33.9% of returns)
Here:
$1,568
State:
$5,394
(% of AGI for various income ranges: 6.1% for AGIs below $10k, 1.9% for AGIs $10k-25k, 0.9% for AGIs $25k-50k, 1.4% for AGIs $50k-75k, 1.5% for AGIs $75k-100k, 0.8% for AGIs over 100k)
Net capital gain/loss: +$4,948 (reported on 22.9% of returns)
Here:
+$4,948
State:
+$23,581
(% of AGI for various income ranges: 9.2% for AGIs below $10k, 0.8% for AGIs $10k-25k, 1.0% for AGIs $25k-50k, 0.5% for AGIs $50k-75k, 1.0% for AGIs $75k-100k, 7.2% for AGIs over 100k)
Profit/loss from business: +$9,236 (reported on 13.5% of returns)
Here:
+$9,236
State:
+$13,809
(% of AGI for various income ranges: 18.4% for AGIs below $10k, 4.0% for AGIs $10k-25k, 2.3% for AGIs $25k-50k, 2.9% for AGIs $50k-75k, 0.9% for AGIs $75k-100k, 3.9% for AGIs over 100k)
Profit/loss from farming: +$1,654 (reported on 1.3% of returns)
Here:
+$1,654
State:
-$2,666
IRA payment deduction: $2,981 (reported on 2.7% of returns)
13456:
$2,981
New York:
$3,115
(% of AGI for various income ranges: 0.4% for AGIs $10k-25k, 0.3% for AGIs $25k-50k, 0.3% for AGIs $50k-75k, 0.2% for AGIs $75k-100k)
Total itemized deductions: $16,976 (21% of AGI, reported on 30.4% of returns)
Here:
$16,976
State:
$25,864
Here:
20.6% of AGI
State:
21.9% of AGI
(% of AGI for various income ranges: 20.5% for AGIs below $10k, 4.4% for AGIs $10k-25k, 9.9% for AGIs $25k-50k, 12.8% for AGIs $50k-75k, 14.3% for AGIs $75k-100k, 14.4% for AGIs over 100k)
Charity contributions deductions: $2,290 (3% of AGI, reported on 28.4% of returns)
Here:
$2,290
State:
$4,439
Here:
2.7% of AGI
State:
3.6% of AGI
(% of AGI for various income ranges: 0.4% for AGIs $10k-25k, 1.1% for AGIs $25k-50k, 1.5% for AGIs $50k-75k, 1.9% for AGIs $75k-100k, 2.2% for AGIs over 100k)
Total tax: $5,927 (reported on 75.0% of returns)
13456:
$5,927
State:
$11,730
(% of AGI for various income ranges: 4.9% for AGIs below $10k, 4.4% for AGIs $10k-25k, 6.7% for AGIs $25k-50k, 8.3% for AGIs $50k-75k, 9.9% for AGIs $75k-100k, 18.1% for AGIs over 100k)
Earned income credit: $1,392 (reported on 10.8% of returns)
Here:
$1,392
State:
$1,757
Percentage of individuals using paid preparers for their 2004 taxes: 58.6%
Here:
59%
State:
67%
(% for various income ranges: 56.2% for AGIs below $10k, 56.3% for AGIs $10k-25k, 58.5% for AGIs $25k-50k, 60.8% for AGIs $50k-75k, 61.7% for AGIs $75k-100k, 63.8% for AGIs over 100k)
Household received Food Stamps/SNAP in the past 12 months: 131 Household did not receive Food Stamps/SNAP in the past 12 months: 1,346
Women who had a birth in the past 12 months: 38 (20 now married, 19 unmarried) Women who did not have a birth in the past 12 months: 869 (494 now married, 366 unmarried)
Housing units in zip code 13456 with a mortgage: 765 (100 second mortgage, 85 both second mortgage and home equity loan) Houses without a mortgage: 26
Median monthly owner costs for units with a mortgage: $1,663 Median monthly owner costs for units without a mortgage: $714
Residents with income below the poverty level in 2022:
This zip code:
6.2%
Whole state:
14.3%
Residents with income below 50% of the poverty level in 2022:
This zip code:
3.1%
Whole state:
6.8%
Median number of rooms in houses and condos:
Here:
6.8
State:
6.3
Median number of rooms in apartments:
Here:
4.9
State:
3.8
Notable locations in this zip code not listed on our city pages
Notable locations in zip code 13456: Sauquoit Knolls Golf Club (A), Meadowbee Herb Farm (B), Ludlow Corners (C), Sulphur Springs Golf Course (D), Massoud's Tree Farm (E). Display/hide their locations on the map
Churches in zip code 13456 include: Union Presbyterian Church (A), Kingdom Hall of Jehovahs Witnesses (B), Living Faith Bible Church (C), Reach Out Family Worship Center (D), Sauquoit United Methodist Church (E), Word of Life Christian Church (F). Display/hide their locations on the map
Cemeteries: Saint Marys Cemetery (1), Saint Paul Cemetery (2), Sauquoit Valley Cemetery (3), Norwich Corners Cemetery (4), Hiller Street Cemetery (5). Display/hide their locations on the map
In group quarters: 35 (-1 institutionalized population)
Size of family households: 432 2-persons, 210 3-persons, 369 4-persons, 58 5-persons, 10 6-persons, 14 7-or-more-persons
Size of nonfamily households: 317 1-person, 63 2-persons
905 married couples with children.
95 single-parent households (35 men, 60 women).
96.2% of residents of 13456 zip code speak English at home.
0.4% of residents speak Spanish at home (77% very well, 23% not well).
2.5% of residents speak other Indo-European language at home (16% very well, 82% well, 2% not well).
0.3% of residents speak Asian or Pacific Island language at home (100% well).
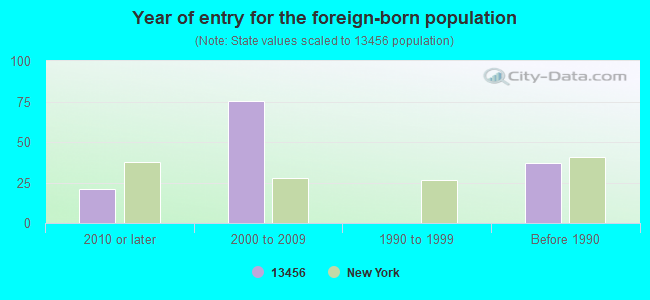
Foreign born population: 108 (2.8%) (83.1% of them are naturalized citizens)
This zip code:
2.8%
Whole state:
22.7%
44%Belarus
13%Bhutan
9%Greece
3%Belgium
2%Serbia
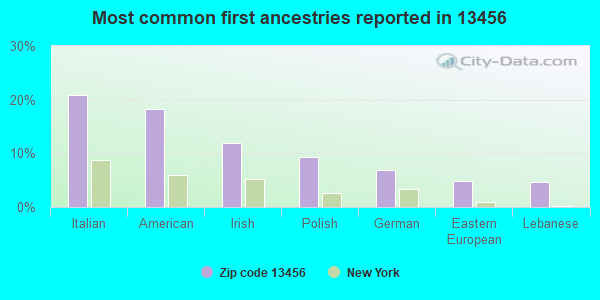
21%Italian
18%American
12%Irish
9%Polish
7%German
5%Eastern European
5%Lebanese
Year of entry for the foreign-born population
212010 or later
752000 to 2009
01990 to 1999
37Before 1990
Public high school in in zip code 13456 not listed on the city page:
Housing units lacking complete plumbing facilities: 0.5% Housing units lacking complete kitchen facilities: 1.0%
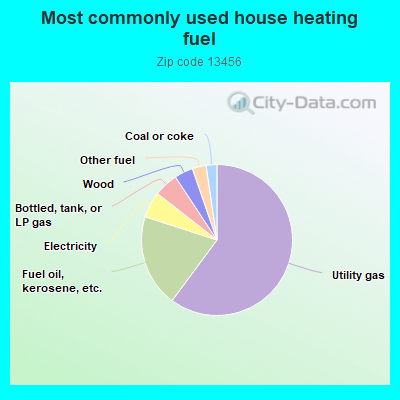
60.4%Utility gas
19.9%Fuel oil, kerosene, etc.
5.6%Electricity
5.2%Bottled, tank, or LP gas
4.0%Wood
3.0%Other fuel
2.3%Coal or coke
Population in 1990: 5,652.
Place of birth for U.S.-born residents:
This state: 3,332
Northeast: 140
Midwest: 72
South: 162
West: 57
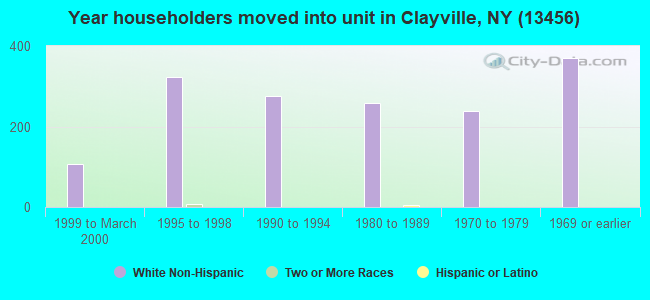
74% of the 13456 zip code residents lived in the same house 5 years ago. Out of people who lived in different houses, 73% lived in this county. Out of people who lived in different counties, 50% lived in New York.
94% of the 13456 zip code residents lived in the same house 1 year ago. Out of people who lived in different houses, 77% moved from this county. Out of people who lived in different houses, 13% moved from different county within same state. Out of people who lived in different houses, 5% moved from different state.
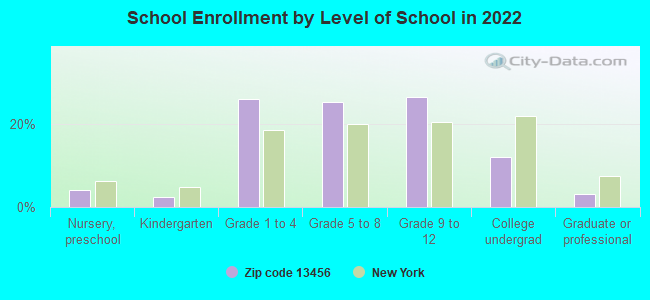
Private vs. public school enrollment:
Students in private schools in grades 1 to 8 (elementary and middle school): 11
Here:
2.1%
New York:
15.6%
Students in private schools in grades 9 to 12 (high school):
Here:
0.3%
New York:
15.0%
Students in private undergraduate colleges: 49
Here:
39.8%
New York:
39.2%
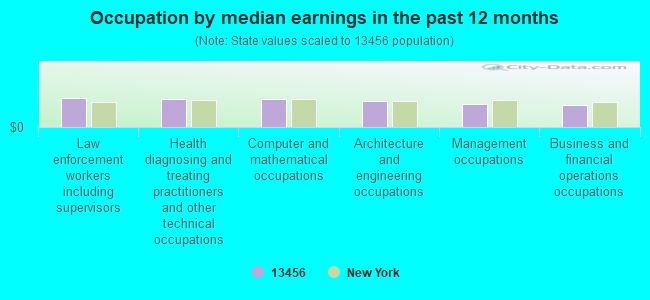
Occupation by median earnings in the past 12 months ($)
86,592Law enforcement workers including supervisors
83,544Health diagnosing and treating practitioners and other technical occupations
83,202Computer and mathematical occupations
77,153Architecture and engineering occupations
67,303Management occupations
65,931Business and financial operations occupations
Companies with federal contracts located in this zip code:
DIGENDRA K DAS (10056 MALLORY ROAD in SAUQUOIT, NY; small business) : $115,350 in 3 contractsin 2000
$58,000 with Air Force for Other Professional Services. Signed on 2000-01-07. Completion date: 2000-09-30.
$57,350, same as above.Signed on 2000-11-30. Completion date: 2001-09-30.
$0, same as above.Signed on 2000-01-07. Completion date: 2000-09-30.
LEM ART STUDIO (2694 CHURCH RD in SAUQUOIT, NY; small business)
$830 with Air Force for Miscellaneous Printed Matter. Signed on 2005-08-04. Completion date: 2005-08-10.
Top industries in this zip code by the number of employees in 2005:
Educational Services: Fine Arts Schools (20-49 employees: 1 establishment)
Accommodation and Food Services: Limited-Service Restaurants (20-49: 1)
Other Services (except Public Administration): Commercial and Industrial Machinery and Equipment (except Automotive and Electronic) Repair and Maintenance (20-49: 1)
Health Care and Social Assistance: Offices of Physicians (except Mental Health Specialists) (10-19: 2, 1-4: 1)
Construction: Poured Concrete Foundation and Structure Contractors (10-19: 1, 1-4: 2)
Construction: Commercial and Institutional Building Construction (10-19: 1)
Professional, Scientific, and Technical Services: Veterinary Services (5-9: 2)
Other Services (except Public Administration): General Automotive Repair (5-9: 1, 1-4: 2)
Construction: Plumbing, Heating, and Air-Conditioning Contractors (5-9: 1, 1-4: 1)
People in group quarters in 2010:
28 people in group homes intended for adults
People in group quarters in 2000:
15 people in homes for the mentally retarded
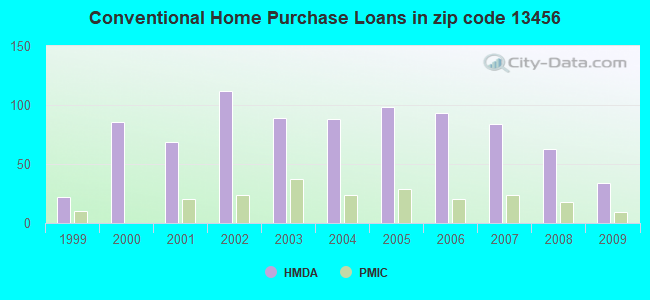
Home Mortgage Disclosure Act Aggregated Statistics For Year 2009 (Based on 4 partial tracts)
A) FHA, FSA/RHS & VA Home Purchase Loans
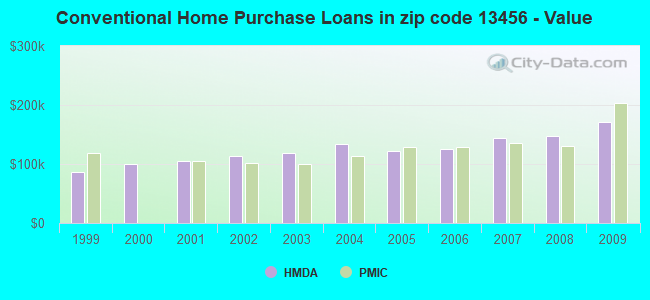
B) Conventional Home Purchase Loans
C) Refinancings
D) Home Improvement Loans
F) Non-occupant Loans on < 5 Family Dwellings (A B C & D)
G) Loans On Manufactured Home Dwelling (A B C & D)
Number
Average Value
Number
Average Value
Number
Average Value
Number
Average Value
Number
Average Value
Number
Average Value
LOANS ORIGINATED
17
$137,942
34
$171,316
142
$144,221
32
$40,841
3
$109,843
0
$0
APPLICATIONS APPROVED, NOT ACCEPTED
0
$0
1
$153,940
9
$137,411
2
$42,405
0
$0
0
$0
APPLICATIONS DENIED
6
$126,697
2
$213,965
42
$145,819
17
$15,936
1
$13,230
0
$0
APPLICATIONS WITHDRAWN
4
$142,908
3
$125,957
30
$130,862
1
$79,350
1
$55,550
1
$110,030
FILES CLOSED FOR INCOMPLETENESS
0
$0
1
$111,620
3
$144,317
0
$0
1
$50,780
0
$0
Aggregated Statistics For Year 2008 (Based on 4 partial tracts)
A) FHA, FSA/RHS & VA Home Purchase Loans
B) Conventional Home Purchase Loans
C) Refinancings
D) Home Improvement Loans
F) Non-occupant Loans on < 5 Family Dwellings (A B C & D)
G) Loans On Manufactured Home Dwelling (A B C & D)
Number
Average Value
Number
Average Value
Number
Average Value
Number
Average Value
Number
Average Value
Number
Average Value
LOANS ORIGINATED
13
$112,355
63
$146,969
78
$131,395
37
$37,745
3
$101,603
5
$82,214
APPLICATIONS APPROVED, NOT ACCEPTED
0
$0
6
$135,082
10
$113,828
7
$66,537
1
$42,850
2
$98,045
APPLICATIONS DENIED
3
$140,033
7
$96,417
50
$132,458
19
$35,184
4
$178,558
3
$71,327
APPLICATIONS WITHDRAWN
3
$132,250
2
$376,385
22
$124,269
2
$41,470
1
$76,840
0
$0
FILES CLOSED FOR INCOMPLETENESS
0
$0
1
$137,540
7
$150,639
0
$0
0
$0
0
$0
Aggregated Statistics For Year 2007 (Based on 4 partial tracts)
A) FHA, FSA/RHS & VA Home Purchase Loans
B) Conventional Home Purchase Loans
C) Refinancings
D) Home Improvement Loans
F) Non-occupant Loans on < 5 Family Dwellings (A B C & D)
G) Loans On Manufactured Home Dwelling (A B C & D)
Number
Average Value
Number
Average Value
Number
Average Value
Number
Average Value
Number
Average Value
Number
Average Value
LOANS ORIGINATED
16
$101,507
84
$143,398
100
$98,691
49
$49,444
5
$126,338
1
$75,560
APPLICATIONS APPROVED, NOT ACCEPTED
3
$84,520
5
$139,930
14
$146,286
3
$37,030
1
$61,360
0
$0
APPLICATIONS DENIED
1
$101,170
19
$79,495
73
$114,014
27
$37,714
5
$74,086
5
$49,490
APPLICATIONS WITHDRAWN
0
$0
12
$141,229
31
$130,852
8
$95,960
1
$56,600
1
$23,050
FILES CLOSED FOR INCOMPLETENESS
0
$0
6
$107,595
16
$150,444
1
$52,900
1
$115,850
0
$0
Aggregated Statistics For Year 2006 (Based on 4 partial tracts)
A) FHA, FSA/RHS & VA Home Purchase Loans
B) Conventional Home Purchase Loans
C) Refinancings
D) Home Improvement Loans
E) Loans on Dwellings For 5+ Families
F) Non-occupant Loans on < 5 Family Dwellings (A B C & D)
G) Loans On Manufactured Home Dwelling (A B C & D)
Number
Average Value
Number
Average Value
Number
Average Value
Number
Average Value
Number
Average Value
Number
Average Value
Number
Average Value
LOANS ORIGINATED
12
$105,986
93
$125,729
114
$98,430
61
$39,418
1
$230,510
10
$99,061
3
$37,313
APPLICATIONS APPROVED, NOT ACCEPTED
0
$0
11
$155,725
11
$106,766
4
$46,460
1
$84,640
1
$48,660
3
$23,050
APPLICATIONS DENIED
1
$28,040
24
$110,394
87
$114,430
30
$56,283
0
$0
0
$0
7
$57,190
APPLICATIONS WITHDRAWN
0
$0
10
$153,784
50
$121,998
4
$80,228
0
$0
4
$128,090
0
$0
FILES CLOSED FOR INCOMPLETENESS
0
$0
6
$122,048
14
$115,241
1
$35,970
0
$0
0
$0
0
$0
Aggregated Statistics For Year 2005 (Based on 4 partial tracts)
A) FHA, FSA/RHS & VA Home Purchase Loans
B) Conventional Home Purchase Loans
C) Refinancings
D) Home Improvement Loans
F) Non-occupant Loans on < 5 Family Dwellings (A B C & D)
G) Loans On Manufactured Home Dwelling (A B C & D)
Number
Average Value
Number
Average Value
Number
Average Value
Number
Average Value
Number
Average Value
Number
Average Value
LOANS ORIGINATED
12
$120,278
98
$122,838
126
$101,568
36
$54,959
7
$78,617
1
$44,820
APPLICATIONS APPROVED, NOT ACCEPTED
0
$0
5
$99,520
20
$94,176
7
$43,494
2
$50,960
1
$25,610
APPLICATIONS DENIED
0
$0
24
$99,755
104
$100,521
34
$40,371
3
$33,723
14
$47,630
APPLICATIONS WITHDRAWN
0
$0
9
$100,590
84
$112,917
10
$79,943
1
$68,770
2
$107,525
FILES CLOSED FOR INCOMPLETENESS
0
$0
5
$154,720
12
$120,709
4
$47,702
1
$102,450
0
$0
Aggregated Statistics For Year 2004 (Based on 4 partial tracts)
A) FHA, FSA/RHS & VA Home Purchase Loans
B) Conventional Home Purchase Loans
C) Refinancings
D) Home Improvement Loans
E) Loans on Dwellings For 5+ Families
F) Non-occupant Loans on < 5 Family Dwellings (A B C & D)
G) Loans On Manufactured Home Dwelling (A B C & D)
Number
Average Value
Number
Average Value
Number
Average Value
Number
Average Value
Number
Average Value
Number
Average Value
Number
Average Value
LOANS ORIGINATED
17
$88,958
88
$134,252
132
$101,328
53
$30,443
1
$55,550
10
$92,614
1
$56,350
APPLICATIONS APPROVED, NOT ACCEPTED
0
$0
5
$100,672
11
$101,986
7
$36,399
0
$0
1
$34,910
0
$0
APPLICATIONS DENIED
1
$113,970
11
$102,505
77
$98,492
32
$31,695
0
$0
4
$92,480
1
$38,420
APPLICATIONS WITHDRAWN
1
$99,890
9
$125,646
85
$118,404
6
$59,987
0
$0
3
$66,633
0
$0
FILES CLOSED FOR INCOMPLETENESS
0
$0
4
$143,578
9
$100,352
3
$46,630
0
$0
0
$0
0
$0
Aggregated Statistics For Year 2003 (Based on 4 partial tracts)
A) FHA, FSA/RHS & VA Home Purchase Loans
B) Conventional Home Purchase Loans
C) Refinancings
D) Home Improvement Loans
E) Loans on Dwellings For 5+ Families
F) Non-occupant Loans on < 5 Family Dwellings (A B C & D)
Number
Average Value
Number
Average Value
Number
Average Value
Number
Average Value
Number
Average Value
Number
Average Value
LOANS ORIGINATED
17
$90,194
89
$118,870
294
$102,976
36
$32,270
1
$28,040
5
$65,118
APPLICATIONS APPROVED, NOT ACCEPTED
0
$0
6
$51,943
30
$101,560
3
$29,677
0
$0
0
$0
APPLICATIONS DENIED
1
$42,320
13
$75,465
94
$92,300
12
$32,297
0
$0
4
$50,635
APPLICATIONS WITHDRAWN
1
$101,170
3
$132,057
71
$108,157
2
$48,650
0
$0
3
$91,013
FILES CLOSED FOR INCOMPLETENESS
0
$0
4
$109,482
5
$115,190
2
$20,740
0
$0
0
$0
Aggregated Statistics For Year 2002 (Based on 4 partial tracts)
A) FHA, FSA/RHS & VA Home Purchase Loans
B) Conventional Home Purchase Loans
C) Refinancings
D) Home Improvement Loans
F) Non-occupant Loans on < 5 Family Dwellings (A B C & D)
Number
Average Value
Number
Average Value
Number
Average Value
Number
Average Value
Number
Average Value
LOANS ORIGINATED
15
$80,575
112
$113,059
210
$93,184
46
$27,751
9
$55,578
APPLICATIONS APPROVED, NOT ACCEPTED
0
$0
9
$85,788
24
$69,908
10
$25,073
0
$0
APPLICATIONS DENIED
3
$75,557
10
$62,892
70
$87,660
20
$15,122
1
$22,750
APPLICATIONS WITHDRAWN
3
$58,873
7
$135,120
69
$84,228
2
$33,995
1
$66,650
FILES CLOSED FOR INCOMPLETENESS
0
$0
1
$99,890
4
$115,125
0
$0
0
$0
Aggregated Statistics For Year 2001 (Based on 4 partial tracts)
A) FHA, FSA/RHS & VA Home Purchase Loans
B) Conventional Home Purchase Loans
C) Refinancings
D) Home Improvement Loans
F) Non-occupant Loans on < 5 Family Dwellings (A B C & D)
Number
Average Value
Number
Average Value
Number
Average Value
Number
Average Value
Number
Average Value
LOANS ORIGINATED
18
$82,598
69
$105,585
141
$84,168
41
$17,218
5
$47,112
APPLICATIONS APPROVED, NOT ACCEPTED
0
$0
2
$89,480
16
$70,238
12
$23,207
0
$0
APPLICATIONS DENIED
1
$158,790
14
$53,198
67
$71,990
24
$17,499
3
$46,437
APPLICATIONS WITHDRAWN
0
$0
5
$59,594
54
$91,940
8
$34,689
1
$40,730
FILES CLOSED FOR INCOMPLETENESS
0
$0
2
$44,475
8
$142,628
0
$0
1
$42,850
Aggregated Statistics For Year 2000 (Based on 4 partial tracts)
A) FHA, FSA/RHS & VA Home Purchase Loans
B) Conventional Home Purchase Loans
C) Refinancings
D) Home Improvement Loans
F) Non-occupant Loans on < 5 Family Dwellings (A B C & D)
Number
Average Value
Number
Average Value
Number
Average Value
Number
Average Value
Number
Average Value
LOANS ORIGINATED
19
$72,152
86
$100,842
55
$58,873
40
$31,630
3
$62,940
APPLICATIONS APPROVED, NOT ACCEPTED
0
$0
8
$55,788
8
$67,356
3
$19,673
0
$0
APPLICATIONS DENIED
4
$68,842
19
$44,517
37
$81,929
22
$19,373
0
$0
APPLICATIONS WITHDRAWN
1
$25,390
4
$90,932
23
$56,591
6
$37,702
1
$49,200
FILES CLOSED FOR INCOMPLETENESS
0
$0
0
$0
9
$81,786
1
$15,870
1
$30,150
Aggregated Statistics For Year 1999 (Based on 2 partial tracts)
A) FHA, FSA/RHS & VA Home Purchase Loans
B) Conventional Home Purchase Loans
C) Refinancings
D) Home Improvement Loans
F) Non-occupant Loans on < 5 Family Dwellings (A B C & D)
Detailed PMIC statistics for the following Tracts:0254.00
, 0255.00
2002 - 2018 National Fire Incident Reporting System (NFIRS) incidents
Based on the data from the years 2002 - 2018 the average number of fires per year is 7. The highest number of reported fires - 22 took place in 2016, and the least - 0 in 2005. The data has a constant trend.
When looking into fire subcategories, the most reports belonged to: Structure Fires (64.5%), and Outside Fires (18.2%).
Fire incident types reported to NFIRS in Zip Code 13456


+$1,654
-$2,666
 Nearest zip codes: 13319, 13413, 13322, 13318, 13501, 13417.


 (Students: 395, Location: 2601 ONEIDA ST, Grades: 9-12)


 Based on the data from the years 2002 - 2018 the average number of fires per year is 7. The highest number of reported fires - 22 took place in 2016, and the least - 0 in 2005. The data has a constant trend.
 When looking into fire subcategories, the most reports belonged to: Structure Fires (64.5%), and Outside Fires (18.2%).