Estimated zip code population in 2022: 587 Zip code population in 2010: 526 Zip code population in 2000: 620
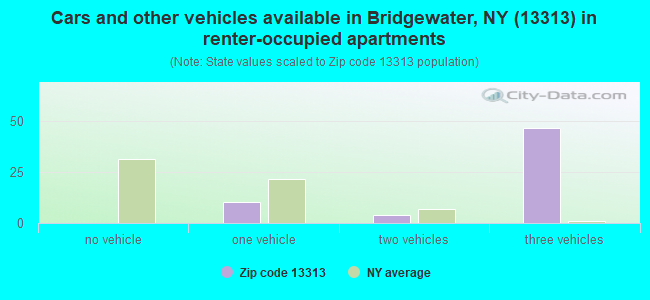
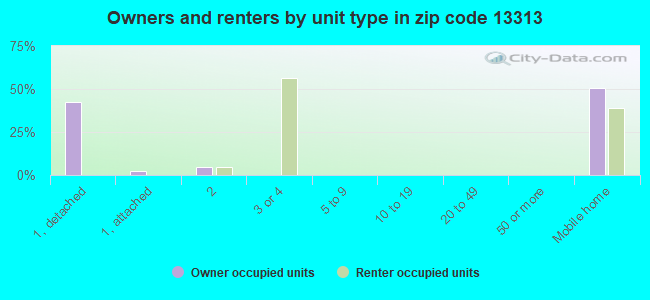
Houses and condos: 288 Renter-occupied apartments: 63
% of renters here:
27%
State:
46%
March 2022 cost of living index in zip code 13313: 93.5 (less than average, U.S. average is 100)
Land area: 2.3 sq. mi. Water area: 0.0 sq. mi.
Population density: 261 people per square mile
(very low).
OSM Map
General Map
Google Map
MSN Map
OSM Map
General Map
Google Map
MSN Map
OSM Map
General Map
Google Map
MSN Map
OSM Map
General Map
Google Map
MSN Map
Please wait while loading the map...
Real estate property taxes paid for housing units in 2022:
This zip code:
3.3% ($2,438)
New York:
1.5% ($6,180)
Median real estate property taxes paid for housing units with mortgages in 2022: $2,464 (2.8%) Median real estate property taxes paid for housing units with no mortgage in 2022: $2,422 (3.5%)
Business Search- 14 Million verified businesses
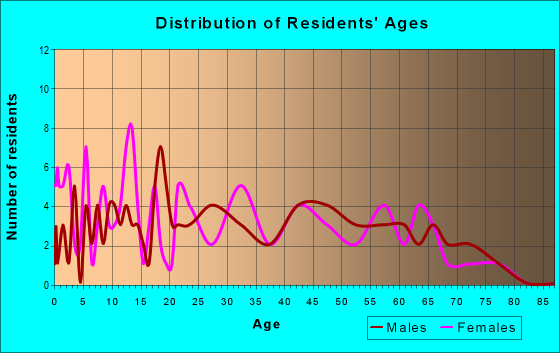
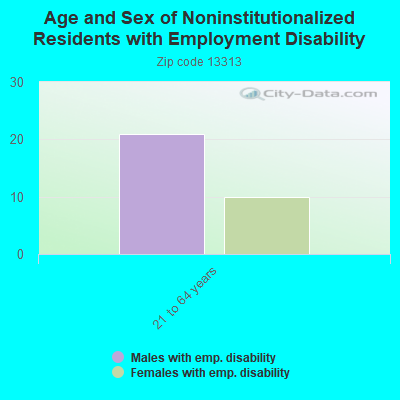
Males: 315
(53.6%)
Females: 272
(46.4%)
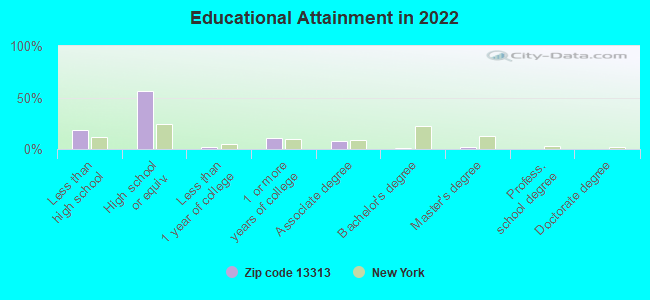
For population 25 years and over in 13313:
High school or higher: 78.6%
Bachelor's degree or higher: 3.8%
Graduate or professional degree: 2.4%
Unemployed: 1.9%
Mean travel time to work (commute): 26.9 minutes
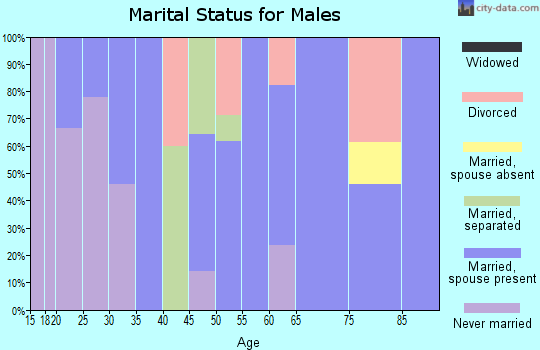
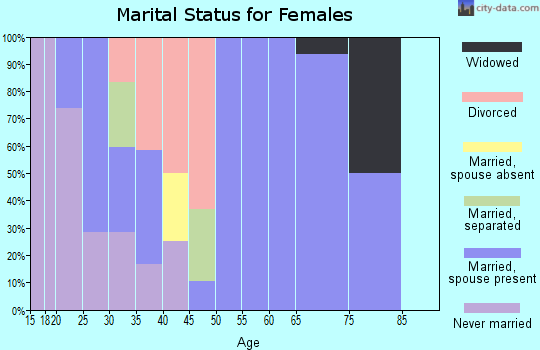
For population 15 years and over in 13313:
Never married: 29.5%
Now married: 55.7%
Separated: 1.4%
Widowed: 9.5%
Divorced: 3.9%
Zip code 13313 compared to state average:
Median household income significantly below state average.
Median house value significantly below state average.
Unemployed percentage below state average.
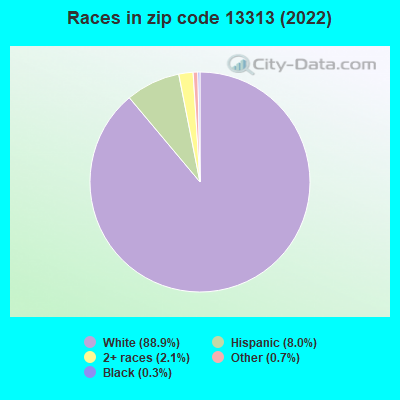
Black race population percentage significantly below state average.
Hispanic race population percentage below state average.
Foreign-born population percentage significantly below state average.
Renting percentage below state average.
Length of stay since moving in significantly above state average.
Percentage of population with a bachelor's degree or higher significantly below state average.
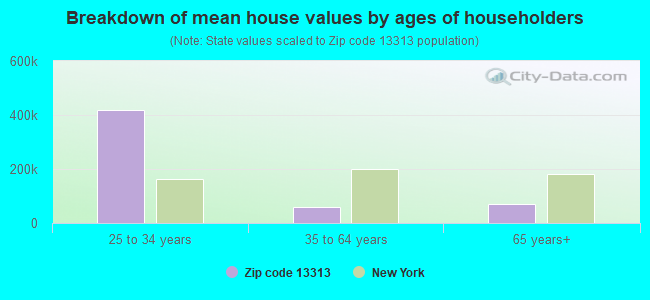
Estimated median house/condo value in 2022: $73,179
13313:
$73,179
New York:
$400,400
According to our research of New York and other state lists, there was 1 registered sex offender living in 13313 zip code as of April 27, 2024. The ratio of all residents to sex offenders in zip code 13313 is 518 to 1.
Median resident age:
This zip code:
39.5 years
New York median age:
40.0 years
Average household size:
This zip code:
2.4 people
New York:
2.5 people
Averages for the 2004 tax year for zip code 13313, filed in 2005:
Average Adjusted Gross Income (AGI) in 2004: $26,482 (Individual Income Tax Returns)
Here:
$26,482
State:
$59,519
Salary/wage: $24,314 (reported on 91.7% of returns)
Here:
$24,314
State:
$50,673
(% of AGI for various income ranges: 83.8% for AGIs below $10k, 89.2% for AGIs $10k-25k, 84.2% for AGIs $25k-50k, 80.2% for AGIs $50k-75k)
Taxable interest for individuals: $309 (reported on 25.9% of returns)
This zip code:
$309
New York:
$2,377
Taxable dividends: $286 (reported on 8.9% of returns)
Here:
$286
State:
$5,394
Profit/loss from business: +$3,769 (reported on 8.3% of returns)
Here:
+$3,769
State:
+$13,809
Total itemized deductions: $14,630 (32% of AGI, reported on 8.6% of returns)
Here:
$14,630
State:
$25,864
Here:
32.4% of AGI
State:
21.9% of AGI
Charity contributions deductions: $727 (1% of AGI, reported on 7.0% of returns)
Here:
$727
State:
$4,439
Here:
1.5% of AGI
State:
3.6% of AGI
Total tax: $2,434 (reported on 67.7% of returns)
13313:
$2,434
State:
$11,730
(% of AGI for various income ranges: 0.6% for AGIs below $10k, 3.4% for AGIs $10k-25k, 5.8% for AGIs $25k-50k, 9.8% for AGIs $50k-75k)
Earned income credit: $2,114 (reported on 25.2% of returns)
Here:
$2,114
State:
$1,757
Percentage of individuals using paid preparers for their 2004 taxes: 59.7%
Here:
60%
State:
67%
(% for various income ranges: 47.5% for AGIs below $10k, 63.7% for AGIs $10k-25k, 57.0% for AGIs $25k-50k, 73.0% for AGIs $50k-75k)
Household received Food Stamps/SNAP in the past 12 months: 99 Household did not receive Food Stamps/SNAP in the past 12 months: 147
Women who did not have a birth in the past 12 months: 141 (60 now married, 80 unmarried)
Housing units in zip code 13313 with a mortgage: 48 (10 second mortgage, 6 both second mortgage and home equity loan) Median monthly owner costs for units with a mortgage: $1,109 Median monthly owner costs for units without a mortgage: $501
Residents with income below the poverty level in 2022:
This zip code:
23.2%
Whole state:
14.3%
Residents with income below 50% of the poverty level in 2022:
This zip code:
7.4%
Whole state:
6.8%
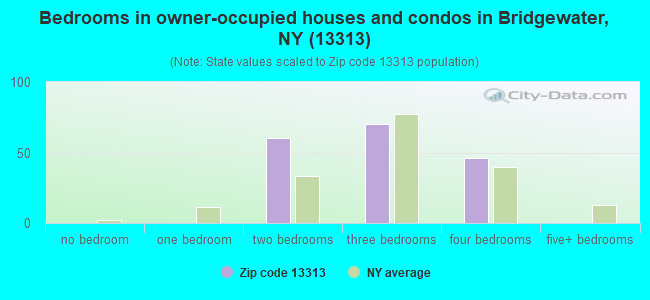
Median number of rooms in houses and condos:
Here:
5.9
State:
6.3
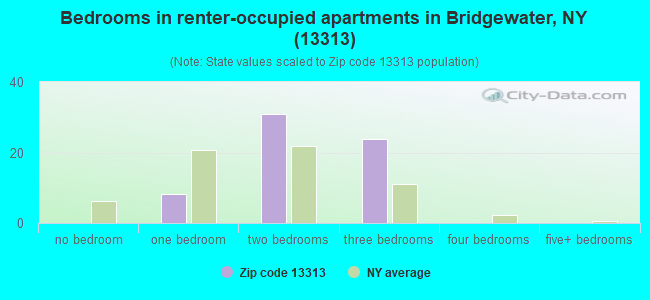
Median number of rooms in apartments:
Here:
4.4
State:
3.8
Notable locations in this zip code not listed on our city pages
Size of family households: 85 2-persons, 47 3-persons, 19 4-persons, 5 5-persons, 5 6-persons, 17 7-or-more-persons
Size of nonfamily households: 53 1-person, 4 2-persons
36 married couples with children.
45 single-parent households (17 men, 28 women).
94.3% of residents of 13313 zip code speak English at home.
5.1% of residents speak Spanish at home (100% very well).
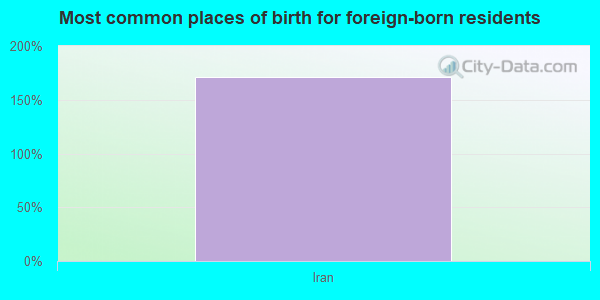
Foreign born population: 8 (1.4%) (100.0% of them are naturalized citizens)
This zip code:
1.4%
Whole state:
22.7%
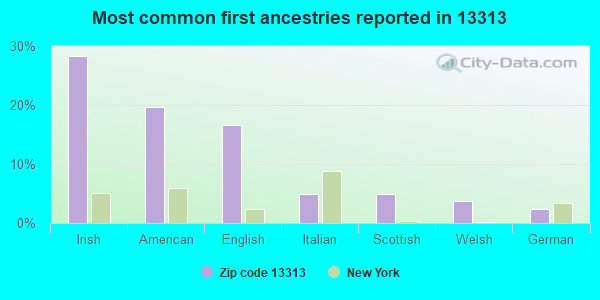
171%Iran
28%Irish
20%American
17%English
5%Italian
5%Scottish
4%Welsh
2%German
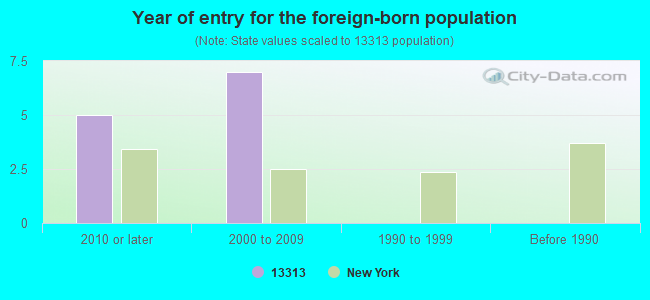
Year of entry for the foreign-born population
52010 or later
72000 to 2009
01990 to 1999
0Before 1990
Housing units lacking complete plumbing facilities: 5.1% Housing units lacking complete kitchen facilities: 2.9%
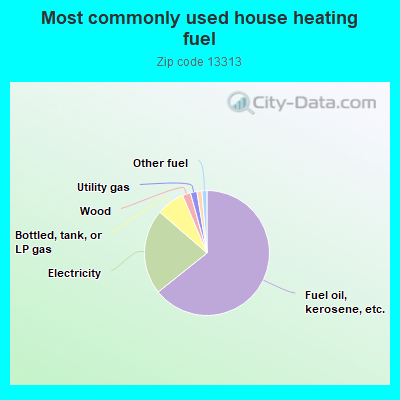
64.6%Fuel oil, kerosene, etc.
22.2%Electricity
7.3%Bottled, tank, or LP gas
2.1%Wood
1.7%Utility gas
1.3%Coal or coke
1.3%Other fuel
Place of birth for U.S.-born residents:
This state: 410
Northeast: 154
South: 5
West: 2
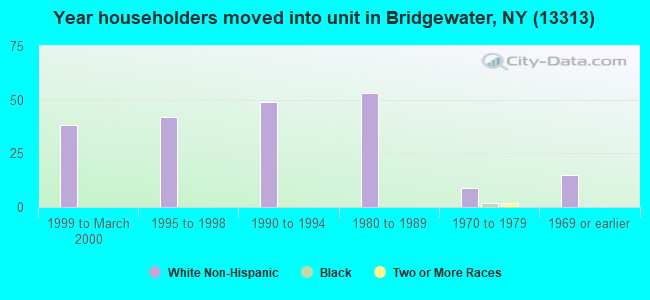
64% of the 13313 zip code residents lived in the same house 5 years ago. Out of people who lived in different houses, 39% lived in this county. Out of people who lived in different counties, 50% lived in New York.
86% of the 13313 zip code residents lived in the same house 1 year ago. Out of people who lived in different houses, 86% moved from this county. Out of people who lived in different houses, 10% moved from different county within same state.
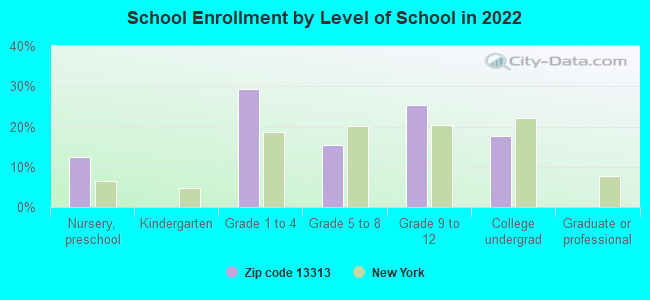
Private vs. public school enrollment:
Students in private schools in grades 1 to 8 (elementary and middle school):
Here:
0.0%
New York:
15.6%
Students in private schools in grades 9 to 12 (high school):
Here:
0.0%
New York:
15.0%
Students in private undergraduate colleges: 8
Here:
37.8%
New York:
39.2%
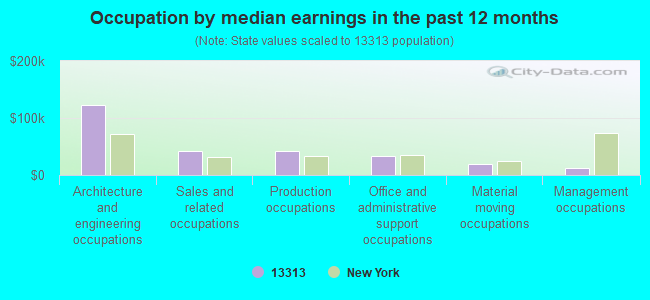
Occupation by median earnings in the past 12 months ($)
122,528Architecture and engineering occupations
42,193Sales and related occupations
41,933Production occupations
34,024Office and administrative support occupations
19,429Material moving occupations
12,049Management occupations
Top industries in this zip code by the number of employees in 2005:
Educational Services: Elementary and Secondary Schools (1-4 employees: 1 establishment)
Other Services (except Public Administration): General Automotive Repair (1-4: 1)
Accommodation and Food Services: Hotels (except Casino Hotels) and Motels (1-4: 1)
Information: Libraries and Archives (1-4: 1)
Construction: Framing Contractors (1-4: 1)
Professional, Scientific, and Technical Services: Surveying and Mapping (except Geophysical) Services (1-4: 1)
Home Mortgage Disclosure Act Aggregated Statistics For Year 2009 (Based on 2 partial tracts)
C) Refinancings
Number
Average Value
LOANS ORIGINATED
2
$96,800
APPLICATIONS APPROVED, NOT ACCEPTED
0
$0
APPLICATIONS DENIED
1
$97,520
APPLICATIONS WITHDRAWN
0
$0
FILES CLOSED FOR INCOMPLETENESS
0
$0
Aggregated Statistics For Year 2008 (Based on 2 partial tracts)
B) Conventional Home Purchase Loans
C) Refinancings
D) Home Improvement Loans
G) Loans On Manufactured Home Dwelling (A B C & D)
Number
Average Value
Number
Average Value
Number
Average Value
Number
Average Value
LOANS ORIGINATED
1
$82,610
1
$103,940
1
$15,400
0
$0
APPLICATIONS APPROVED, NOT ACCEPTED
0
$0
0
$0
0
$0
0
$0
APPLICATIONS DENIED
1
$27,910
1
$151,580
2
$25,985
1
$57,100
APPLICATIONS WITHDRAWN
0
$0
1
$62,720
0
$0
0
$0
FILES CLOSED FOR INCOMPLETENESS
0
$0
0
$0
0
$0
0
$0
Aggregated Statistics For Year 2007 (Based on 2 partial tracts)
B) Conventional Home Purchase Loans
C) Refinancings
D) Home Improvement Loans
G) Loans On Manufactured Home Dwelling (A B C & D)
Number
Average Value
Number
Average Value
Number
Average Value
Number
Average Value
LOANS ORIGINATED
1
$49,400
2
$64,800
2
$29,595
1
$50,850
APPLICATIONS APPROVED, NOT ACCEPTED
0
$0
0
$0
0
$0
0
$0
APPLICATIONS DENIED
1
$71,540
2
$73,225
2
$17,000
1
$35,450
APPLICATIONS WITHDRAWN
0
$0
1
$85,010
0
$0
0
$0
FILES CLOSED FOR INCOMPLETENESS
0
$0
0
$0
0
$0
0
$0
Aggregated Statistics For Year 2006 (Based on 2 partial tracts)
B) Conventional Home Purchase Loans
C) Refinancings
D) Home Improvement Loans
G) Loans On Manufactured Home Dwelling (A B C & D)
Number
Average Value
Number
Average Value
Number
Average Value
Number
Average Value
LOANS ORIGINATED
2
$103,055
2
$58,945
1
$9,300
1
$63,520
APPLICATIONS APPROVED, NOT ACCEPTED
0
$0
0
$0
0
$0
0
$0
APPLICATIONS DENIED
1
$20,690
4
$84,210
3
$15,130
1
$98,970
APPLICATIONS WITHDRAWN
0
$0
2
$75,630
0
$0
0
$0
FILES CLOSED FOR INCOMPLETENESS
0
$0
0
$0
0
$0
0
$0
Aggregated Statistics For Year 2005 (Based on 2 partial tracts)
B) Conventional Home Purchase Loans
C) Refinancings
D) Home Improvement Loans
G) Loans On Manufactured Home Dwelling (A B C & D)
Number
Average Value
Number
Average Value
Number
Average Value
Number
Average Value
LOANS ORIGINATED
1
$125,430
2
$71,220
1
$21,170
1
$53,090
APPLICATIONS APPROVED, NOT ACCEPTED
0
$0
1
$49,080
0
$0
0
$0
APPLICATIONS DENIED
1
$69,290
2
$78,595
3
$16,843
2
$42,585
APPLICATIONS WITHDRAWN
0
$0
0
$0
1
$59,030
0
$0
FILES CLOSED FOR INCOMPLETENESS
0
$0
0
$0
0
$0
0
$0
Aggregated Statistics For Year 2004 (Based on 2 partial tracts)
A) FHA, FSA/RHS & VA Home Purchase Loans
B) Conventional Home Purchase Loans
C) Refinancings
D) Home Improvement Loans
G) Loans On Manufactured Home Dwelling (A B C & D)
Number
Average Value
Number
Average Value
Number
Average Value
Number
Average Value
Number
Average Value
LOANS ORIGINATED
1
$61,910
1
$107,310
2
$67,850
1
$33,040
1
$77,950
APPLICATIONS APPROVED, NOT ACCEPTED
0
$0
0
$0
0
$0
0
$0
0
$0
APPLICATIONS DENIED
0
$0
0
$0
3
$60,523
1
$5,130
1
$50,530
APPLICATIONS WITHDRAWN
0
$0
0
$0
2
$60,390
0
$0
1
$98,810
FILES CLOSED FOR INCOMPLETENESS
0
$0
0
$0
0
$0
0
$0
0
$0
Aggregated Statistics For Year 2003 (Based on 2 partial tracts)
B) Conventional Home Purchase Loans
C) Refinancings
D) Home Improvement Loans
Number
Average Value
Number
Average Value
Number
Average Value
LOANS ORIGINATED
3
$58,707
4
$83,970
1
$6,740
APPLICATIONS APPROVED, NOT ACCEPTED
1
$79,240
0
$0
0
$0
APPLICATIONS DENIED
1
$51,650
4
$46,475
0
$0
APPLICATIONS WITHDRAWN
0
$0
1
$115,490
0
$0
FILES CLOSED FOR INCOMPLETENESS
0
$0
0
$0
0
$0
Aggregated Statistics For Year 2002 (Based on 2 partial tracts)
A) FHA, FSA/RHS & VA Home Purchase Loans
B) Conventional Home Purchase Loans
C) Refinancings
D) Home Improvement Loans
Number
Average Value
Number
Average Value
Number
Average Value
Number
Average Value
LOANS ORIGINATED
1
$72,020
2
$54,135
3
$55,553
1
$12,350
APPLICATIONS APPROVED, NOT ACCEPTED
0
$0
1
$29,830
0
$0
0
$0
APPLICATIONS DENIED
0
$0
1
$29,670
4
$57,705
1
$11,230
APPLICATIONS WITHDRAWN
0
$0
0
$0
4
$55,820
0
$0
FILES CLOSED FOR INCOMPLETENESS
0
$0
0
$0
0
$0
0
$0
Aggregated Statistics For Year 2001 (Based on 2 partial tracts)
B) Conventional Home Purchase Loans
C) Refinancings
D) Home Improvement Loans
Number
Average Value
Number
Average Value
Number
Average Value
LOANS ORIGINATED
1
$43,790
4
$48,762
1
$9,620
APPLICATIONS APPROVED, NOT ACCEPTED
0
$0
0
$0
0
$0
APPLICATIONS DENIED
2
$37,615
2
$33,685
1
$24,540
APPLICATIONS WITHDRAWN
0
$0
2
$35,770
0
$0
FILES CLOSED FOR INCOMPLETENESS
0
$0
0
$0
0
$0
Aggregated Statistics For Year 2000 (Based on 2 partial tracts)
B) Conventional Home Purchase Loans
C) Refinancings
D) Home Improvement Loans
Number
Average Value
Number
Average Value
Number
Average Value
LOANS ORIGINATED
1
$84,690
1
$20,210
1
$42,510
APPLICATIONS APPROVED, NOT ACCEPTED
1
$32,400
0
$0
0
$0
APPLICATIONS DENIED
1
$96,240
2
$42,505
1
$5,770
APPLICATIONS WITHDRAWN
0
$0
0
$0
0
$0
FILES CLOSED FOR INCOMPLETENESS
0
$0
0
$0
0
$0
Aggregated Statistics For Year 1999 (Based on 1 partial tract)
Detailed HMDA statistics for the following Tracts:0258.00
Private Mortgage Insurance Companies Aggregated Statistics For Year 2003 (Based on 2 partial tracts)
A) Conventional Home Purchase Loans
Number
Average Value
LOANS ORIGINATED
1
$43,950
APPLICATIONS APPROVED, NOT ACCEPTED
0
$0
APPLICATIONS DENIED
0
$0
APPLICATIONS WITHDRAWN
0
$0
FILES CLOSED FOR INCOMPLETENESS
0
$0
Detailed PMIC statistics for the following Tracts:0258.00
2002 - 2018 National Fire Incident Reporting System (NFIRS) incidents
Based on the data from the years 2002 - 2018 the average number of fires per year is 12. The highest number of reported fires - 21 took place in 2006, and the least - 4 in 2004. The data has a constant trend.
When looking into fire subcategories, the most reports belonged to: Structure Fires (56.0%), and Outside Fires (20.8%).
Fire incident types reported to NFIRS in Zip Code 13313
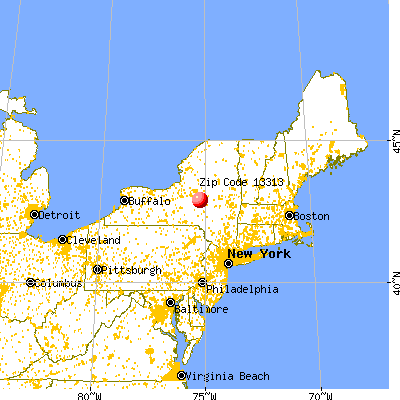


 Nearest zip codes: 13318, 13364, 13314, 13480, 13485, 13322.


 Based on the data from the years 2002 - 2018 the average number of fires per year is 12. The highest number of reported fires - 21 took place in 2006, and the least - 4 in 2004. The data has a constant trend.
 When looking into fire subcategories, the most reports belonged to: Structure Fires (56.0%), and Outside Fires (20.8%).