Estimated zip code population in 2022: 7,360 Zip code population in 2010: 8,205 Zip code population in 2000: 7,937
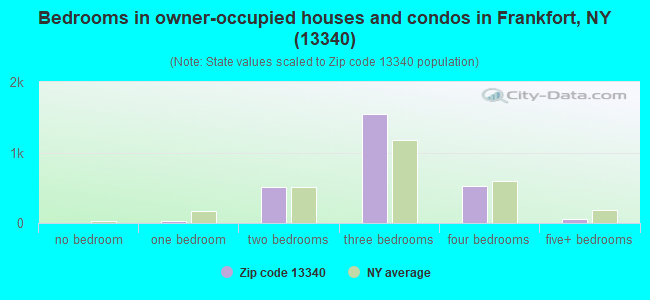
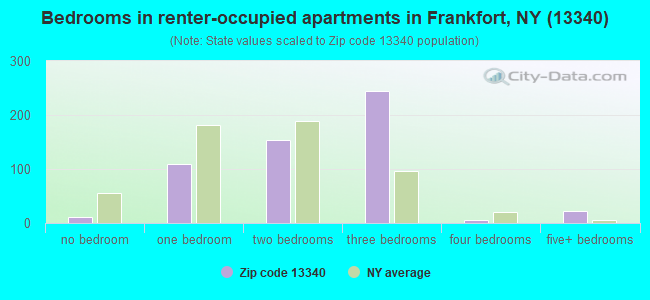
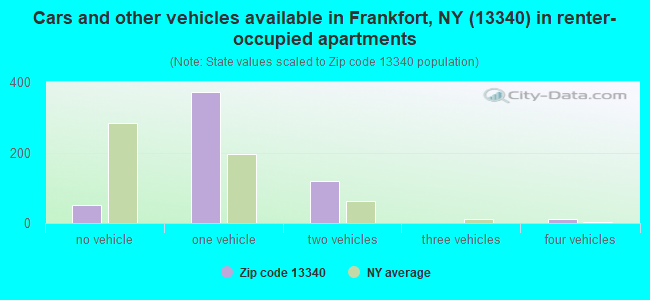
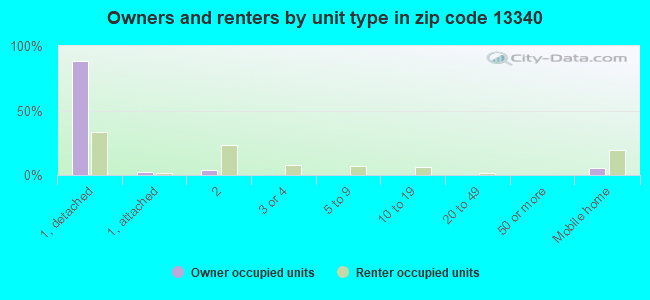
Houses and condos: 3,471 Renter-occupied apartments: 550
% of renters here:
17%
State:
46%
March 2022 cost of living index in zip code 13340: 99.0 (near average, U.S. average is 100)
Land area: 57.9 sq. mi. Water area: 0.3 sq. mi.
Population density: 127 people per square mile
(very low).
OSM Map
General Map
Google Map
MSN Map
OSM Map
General Map
Google Map
MSN Map
OSM Map
General Map
Google Map
MSN Map
OSM Map
General Map
Google Map
MSN Map
Please wait while loading the map...
Real estate property taxes paid for housing units in 2022:
This zip code:
2.4% ($3,472)
New York:
1.5% ($6,180)
Median real estate property taxes paid for housing units with mortgages in 2022: $3,529 (2.4%) Median real estate property taxes paid for housing units with no mortgage in 2022: $3,357 (2.3%)
Business Search- 14 Million verified businesses
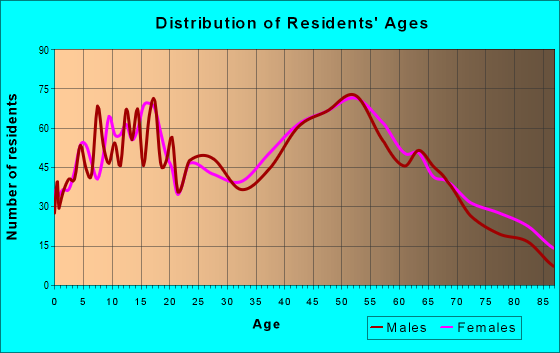
Males: 3,749
(50.9%)
Females: 3,610
(49.1%)
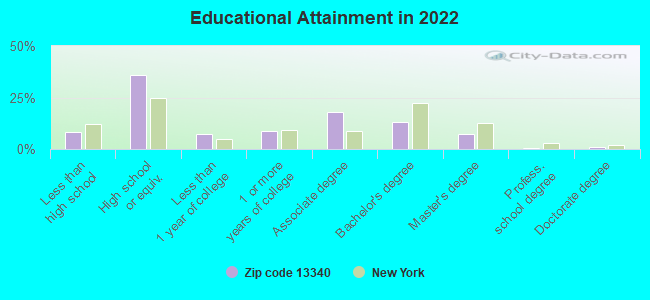
For population 25 years and over in 13340:
High school or higher: 91.2%
Bachelor's degree or higher: 22.2%
Graduate or professional degree: 9.1%
Unemployed: 2.1%
Mean travel time to work (commute): 24.8 minutes
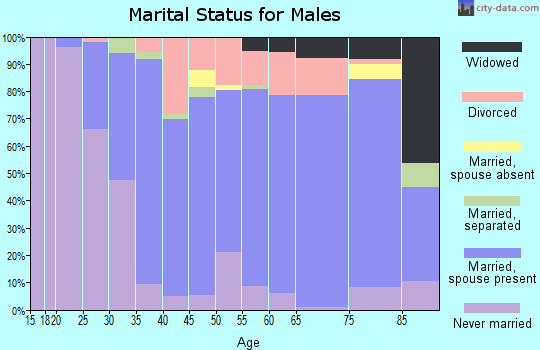
For population 15 years and over in 13340:
Never married: 26.8%
Now married: 55.1%
Separated: 2.2%
Widowed: 7.1%
Divorced: 8.8%
Zip code 13340 compared to state average:
Median house value significantly below state average.
Unemployed percentage below state average.
Black race population percentage significantly below state average.
Hispanic race population percentage significantly below state average.
Foreign-born population percentage significantly below state average.
Renting percentage significantly below state average.
Length of stay since moving in above state average.
Number of rooms per house above state average.
Number of college students below state average.
Percentage of population with a bachelor's degree or higher below state average.
Averages for the 2020 tax year for zip code 13340, filed in 2021:
Average Adjusted Gross Income (AGI) in 2020: $56,411 (Individual Income Tax Returns)
Here:
$56,411
State:
$90,930
Salary/wage: $48,854 (reported on 81.4% of returns)
Here:
$48,854
State:
$72,104
(% of AGI for various income ranges: 1246.4% for AGIs below $25k, 3495.6% for AGIs $25k-50k, 6696.8% for AGIs $50k-75k, 9771.9% for AGIs $75k-100k, 17098.0% for AGIs $100k-200k, 69430.0% for AGIs over 200k)
Taxable interest for individuals: $841 (reported on 38.6% of returns)
This zip code:
$841
New York:
$3,075
(% of AGI for various income ranges: 21.4% for AGIs below $25k, 18.5% for AGIs $25k-50k, 46.8% for AGIs $50k-75k, 110.0% for AGIs $75k-100k, 124.3% for AGIs $100k-200k, 625.0% for AGIs over 200k)
Ordinary dividends: $3,275 (reported on 18.1% of returns)
Here:
$3,275
State:
$11,095
(% of AGI for various income ranges: 14.7% for AGIs below $25k, 37.1% for AGIs $25k-50k, 66.2% for AGIs $50k-75k, 135.7% for AGIs $75k-100k, 246.3% for AGIs $100k-200k, 2730.0% for AGIs over 200k)
Net capital gain/loss in AGI: +$8,111 (reported on 13.9% of returns)
Here:
+$8,111
State:
+$44,925
(% of AGI for various income ranges: 16.5% for AGIs below $25k, 28.3% for AGIs $25k-50k, 50.0% for AGIs $50k-75k, 241.9% for AGIs $75k-100k, 421.7% for AGIs $100k-200k, 9805.0% for AGIs over 200k)
Profit/loss from business: +$12,622 (reported on 11.8% of returns)
Here:
+$12,622
State:
+$14,940
(% of AGI for various income ranges: 98.2% for AGIs below $25k, 124.0% for AGIs $25k-50k, 150.8% for AGIs $50k-75k, 158.1% for AGIs $75k-100k, 982.3% for AGIs $100k-200k)
Taxable individual retirement arrangement distribution: $12,606 (reported on 8.7% of returns)
13340:
$12,606
New York:
$19,609
(% of AGI for various income ranges: 63.4% for AGIs below $25k, 64.9% for AGIs $25k-50k, 148.8% for AGIs $50k-75k, 401.0% for AGIs $75k-100k, 563.3% for AGIs $100k-200k)
Total itemized deductions: $25,708 (reported on 3.4% of returns)
Here:
$25,708
State:
$39,326
(% of AGI for various income ranges: 249.5% for AGIs $50k-75k, 286.7% for AGIs $75k-100k, 580.7% for AGIs $100k-200k)
Charity contributions: $4,722 (reported on 2.4% of returns)
Here:
$4,722
State:
$15,420
(% of AGI for various income ranges: 31.0% for AGIs $50k-75k, 25.2% for AGIs $75k-100k, 82.7% for AGIs $100k-200k)
Taxes paid: $7,562 (reported on 3.4% of returns)
13340:
$7,562
State:
$9,183
(% of AGI for various income ranges: 72.5% for AGIs $50k-75k, 119.5% for AGIs $75k-100k, 147.3% for AGIs $100k-200k)
Earned income credit: $1,896 (reported on 13.9% of returns)
Here:
$1,896
State:
$2,138
(% of AGI for various income ranges: 67.4% for AGIs below $25k, 57.9% for AGIs $25k-50k)
Percentage of individuals using paid preparers for their 2020 taxes: 94.5%
Here:
94%
State:
95%
(% for various income ranges: 92.4% for AGIs below $25k, 95.4% for AGIs $25k-50k, 93.3% for AGIs $50k-75k, 97.1% for AGIs $75k-100k, 96.1% for AGIs $100k-200k, 100.0% for AGIs over 200k)
Averages for the 2012 tax year for zip code 13340, filed in 2013:
Average Adjusted Gross Income (AGI) in 2012: $44,620 (Individual Income Tax Returns)
Here:
$44,620
State:
$77,088
Salary/wage: $40,383 (reported on 83.8% of returns)
Here:
$40,383
State:
$60,593
(% of AGI for various income ranges: 70.5% for AGIs below $25k, 79.2% for AGIs $25k-50k, 77.8% for AGIs $50k-75k, 78.6% for AGIs $75k-100k, 78.0% for AGIs $100k-200k, 47.7% for AGIs over 200k)
Taxable interest for individuals: $693 (reported on 40.2% of returns)
This zip code:
$693
New York:
$3,125
(% of AGI for various income ranges: 1.5% for AGIs below $25k, 0.5% for AGIs $25k-50k, 0.7% for AGIs $50k-75k, 0.7% for AGIs $75k-100k, 0.3% for AGIs $100k-200k, 0.2% for AGIs over 200k)
Ordinary dividends: $2,092 (reported on 21.3% of returns)
Here:
$2,092
State:
$10,299
(% of AGI for various income ranges: 1.3% for AGIs below $25k, 0.8% for AGIs $25k-50k, 1.1% for AGIs $50k-75k, 1.0% for AGIs $75k-100k, 1.2% for AGIs $100k-200k)
Net capital gain/loss in AGI: +$2,273 (reported on 12.0% of returns)
Here:
+$2,273
State:
+$42,474
(% of AGI for various income ranges: 0.4% for AGIs $25k-50k, 0.3% for AGIs $50k-75k, 0.8% for AGIs $75k-100k, 1.4% for AGIs $100k-200k)
Profit/loss from business: +$9,829 (reported on 11.2% of returns)
Here:
+$9,829
State:
+$16,168
(% of AGI for various income ranges: 4.9% for AGIs below $25k, 2.2% for AGIs $25k-50k, 1.8% for AGIs $50k-75k, 2.2% for AGIs $75k-100k, 2.9% for AGIs $100k-200k)
Taxable individual retirement arrangement distribution: $8,959 (reported on 9.0% of returns)
13340:
$8,959
New York:
$17,621
(% of AGI for various income ranges: 2.8% for AGIs below $25k, 1.7% for AGIs $25k-50k, 1.9% for AGIs $50k-75k, 1.9% for AGIs $75k-100k, 1.8% for AGIs $100k-200k)
Total itemized deductions: $18,612 (21% of AGI, reported on 22.6% of returns)
Here:
$18,612
State:
$34,985
Here:
21.5% of AGI
State:
21.3% of AGI
(% of AGI for various income ranges: 3.7% for AGIs below $25k, 6.1% for AGIs $25k-50k, 8.9% for AGIs $50k-75k, 9.9% for AGIs $75k-100k, 13.8% for AGIs $100k-200k, 15.4% for AGIs over 200k)
Charity contributions: $2,257 (reported on 17.8% of returns)
Here:
$2,257
State:
$5,572
(% of AGI for various income ranges: 0.2% for AGIs below $25k, 0.4% for AGIs $25k-50k, 0.8% for AGIs $50k-75k, 1.0% for AGIs $75k-100k, 1.7% for AGIs $100k-200k, 0.7% for AGIs over 200k)
Taxes paid: $8,286 (reported on 22.6% of returns)
13340:
$8,286
State:
$18,656
(% of AGI for various income ranges: 1.3% for AGIs below $25k, 2.4% for AGIs $25k-50k, 3.2% for AGIs $50k-75k, 4.2% for AGIs $75k-100k, 7.3% for AGIs $100k-200k, 7.3% for AGIs over 200k)
Earned income credit: $2,029 (reported on 17.6% of returns)
Here:
$2,029
State:
$2,230
(% of AGI for various income ranges: 5.0% for AGIs below $25k, 1.2% for AGIs $25k-50k)
Percentage of individuals using paid preparers for their 2012 taxes: 52.1%
Here:
52%
State:
66%
(% for various income ranges: 47.0% for AGIs below $25k, 49.0% for AGIs $25k-50k, 58.2% for AGIs $50k-75k, 60.6% for AGIs $75k-100k, 65.6% for AGIs $100k-200k, 66.7% for AGIs over 200k)
Averages for the 2004 tax year for zip code 13340, filed in 2005:
Average Adjusted Gross Income (AGI) in 2004: $35,875 (Individual Income Tax Returns)
Here:
$35,875
State:
$59,519
Salary/wage: $33,859 (reported on 85.8% of returns)
Here:
$33,859
State:
$50,673
(% of AGI for various income ranges: 107.9% for AGIs below $10k, 75.8% for AGIs $10k-25k, 82.6% for AGIs $25k-50k, 83.3% for AGIs $50k-75k, 82.4% for AGIs $75k-100k, 72.9% for AGIs over 100k)
Taxable interest for individuals: $988 (reported on 48.7% of returns)
This zip code:
$988
New York:
$2,377
(% of AGI for various income ranges: 4.8% for AGIs below $10k, 2.3% for AGIs $10k-25k, 0.9% for AGIs $25k-50k, 1.5% for AGIs $50k-75k, 0.9% for AGIs $75k-100k, 0.9% for AGIs over 100k)
Taxable dividends: $1,148 (reported on 26.0% of returns)
Here:
$1,148
State:
$5,394
(% of AGI for various income ranges: 2.3% for AGIs below $10k, 1.2% for AGIs $10k-25k, 0.6% for AGIs $25k-50k, 0.8% for AGIs $50k-75k, 0.9% for AGIs $75k-100k, 0.8% for AGIs over 100k)
Net capital gain/loss: +$2,245 (reported on 17.1% of returns)
Here:
+$2,245
State:
+$23,581
(% of AGI for various income ranges: 3.4% for AGIs below $10k, 0.4% for AGIs $10k-25k, 0.6% for AGIs $25k-50k, 0.8% for AGIs $50k-75k, 1.5% for AGIs $75k-100k, 2.2% for AGIs over 100k)
Profit/loss from business: +$4,113 (reported on 11.8% of returns)
Here:
+$4,113
State:
+$13,809
(% of AGI for various income ranges: 4.4% for AGIs below $10k, 3.0% for AGIs $10k-25k, 1.8% for AGIs $25k-50k, 1.4% for AGIs $50k-75k, -0.2% for AGIs $75k-100k, 0.2% for AGIs over 100k)
Profit/loss from farming: +$1,133 (reported on 0.8% of returns)
Here:
+$1,133
State:
-$2,666
IRA payment deduction: $2,667 (reported on 2.7% of returns)
13340:
$2,667
New York:
$3,115
(% of AGI for various income ranges: 0.2% for AGIs $10k-25k, 0.3% for AGIs $25k-50k, 0.3% for AGIs $50k-75k, 0.2% for AGIs $75k-100k)
Total itemized deductions: $15,356 (22% of AGI, reported on 22.1% of returns)
Here:
$15,356
State:
$25,864
Here:
21.8% of AGI
State:
21.9% of AGI
(% of AGI for various income ranges: 4.3% for AGIs below $10k, 3.7% for AGIs $10k-25k, 7.1% for AGIs $25k-50k, 10.3% for AGIs $50k-75k, 11.9% for AGIs $75k-100k, 15.2% for AGIs over 100k)
Charity contributions deductions: $2,233 (3% of AGI, reported on 20.1% of returns)
Here:
$2,233
State:
$4,439
Here:
3.1% of AGI
State:
3.6% of AGI
(% of AGI for various income ranges: 0.5% for AGIs $10k-25k, 0.7% for AGIs $25k-50k, 1.2% for AGIs $50k-75k, 1.5% for AGIs $75k-100k, 2.8% for AGIs over 100k)
Total tax: $4,287 (reported on 73.4% of returns)
13340:
$4,287
State:
$11,730
(% of AGI for various income ranges: 2.5% for AGIs below $10k, 3.9% for AGIs $10k-25k, 6.7% for AGIs $25k-50k, 8.5% for AGIs $50k-75k, 9.9% for AGIs $75k-100k, 16.7% for AGIs over 100k)
Earned income credit: $1,721 (reported on 15.3% of returns)
Here:
$1,721
State:
$1,757
Percentage of individuals using paid preparers for their 2004 taxes: 58.8%
Here:
59%
State:
67%
(% for various income ranges: 53.3% for AGIs below $10k, 57.7% for AGIs $10k-25k, 60.6% for AGIs $25k-50k, 60.6% for AGIs $50k-75k, 61.3% for AGIs $75k-100k, 71.8% for AGIs over 100k)
Likely homosexual households (counted as self-reported same-sex unmarried-partner households)
Lesbian couples: 0.3% of all households
Gay men: 0.0% of all households
Household received Food Stamps/SNAP in the past 12 months: 412 Household did not receive Food Stamps/SNAP in the past 12 months: 2,803
Women who had a birth in the past 12 months: 55 (49 now married, 5 unmarried) Women who did not have a birth in the past 12 months: 1,523 (708 now married, 807 unmarried)
Housing units in zip code 13340 with a mortgage: 1,490 (132 second mortgage, 114 both second mortgage and home equity loan) Houses without a mortgage: 32
Median monthly owner costs for units with a mortgage: $1,242 Median monthly owner costs for units without a mortgage: $568
Residents with income below the poverty level in 2022:
This zip code:
9.7%
Whole state:
14.3%
Residents with income below 50% of the poverty level in 2022:
This zip code:
6.9%
Whole state:
6.8%
Median number of rooms in houses and condos:
Here:
6.3
State:
6.3
Median number of rooms in apartments:
Here:
4.9
State:
3.8
Notable locations in this zip code not listed on our city pages
Notable locations in zip code 13340: Kinne Corners (A), Sheaf Corners (B), Frankfort 5S North Business Park (C), Frankfort Harbor Marina (D), Pine Hills Golf Course (E), Maple Crest Golf Course (F), Schuyler Westbound Rest Area (G), Hill Side Farm (H), Salamone Farms (I), Frankfort Hill (J), Minott Corners (K), Parker Corners (L), Camp Ballou (M), Frankfort Free Library (N), Frankfort Town Hall (O), Frankfort Fire Department (P), Frankfort Center Fire Department (Q), Frankfort Hill Volunteer Fire Company (R). Display/hide their locations on the map
Churches in zip code 13340 include: First Methodist Church (A), Christian Assembly Church (B), Saint Mary's Roman Catholic Church (C), Saint Peter And Pauls Roman Catholic Church (D), Christian and Missionary Alliance Church (E), First Baptist Church (F), East Schuyler Church (G), Frankfort United Methodist Church (H), Valley Baptist Church (I). Display/hide their locations on the map
Cemeteries: Rose Cemetery (1), Saint Agnes Cemetery (2), Frankfort Hill Cemetery (3), Budlong Cemetery (4), Parker Cemetery (5), Frankfort Center Cemetery (6), Smith Cemetery (7). Display/hide their locations on the map
Streams, rivers, and creeks: Moyer Creek (A), Bridenbecker Creek (B), Ferguson Creek (C), Pratt Creek (D), Bonny Brook (E), Black Creek (F), Sterling Creek (G). Display/hide their locations on the map
In group quarters: 29 (-1 institutionalized population)
Size of family households: 849 2-persons, 577 3-persons, 357 4-persons, 88 5-persons, 39 6-persons, 35 7-or-more-persons
Size of nonfamily households: 1,067 1-person, 207 2-persons, 8 3-persons
1,045 married couples with children.
398 single-parent households (74 men, 324 women).
90.4% of residents of 13340 zip code speak English at home.
0.6% of residents speak Spanish at home (10% very well, 90% well).
8.8% of residents speak other Indo-European language at home (78% very well, 11% well, 11% not well).
0.1% of residents speak Asian or Pacific Island language at home (100% very well).
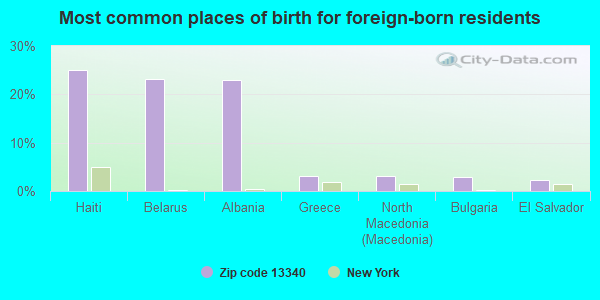
Foreign born population: 493 (6.7%) (88.9% of them are naturalized citizens)
This zip code:
6.7%
Whole state:
22.7%
25%Haiti
23%Belarus
23%Albania
3%Greece
3%North Macedonia (Macedonia)
3%Bulgaria
2%El Salvador
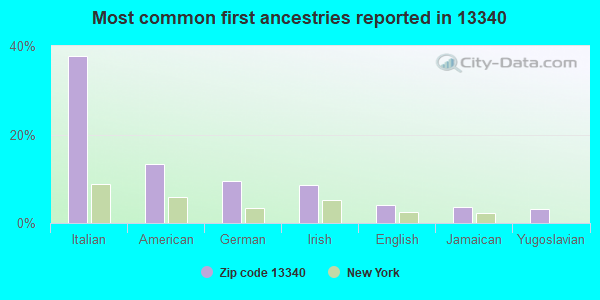
38%Italian
13%American
9%German
9%Irish
4%English
4%Jamaican
3%Yugoslavian
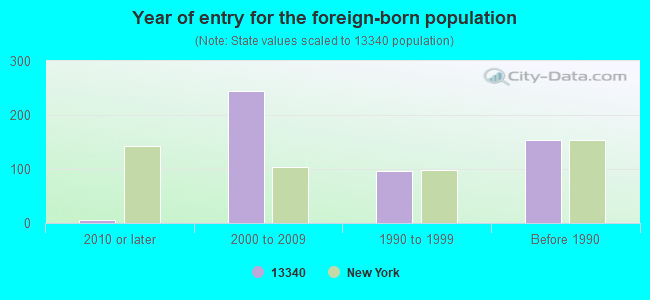
Year of entry for the foreign-born population
52010 or later
2442000 to 2009
961990 to 1999
153Before 1990
Facilities with environmental interests located in this zip code:
CHICAGO PNEUMATIC TOOL CO (2200 BLEECKER ST in FRANKFORT, NY)
SUPERFUND (Superfund database) STATE MASTER (New York facility tracking) - AIR PROGRAM, National Pollutant Discharge Elimination System Permit, National Pollutant Discharge Elimination System Permit, HAZARDOUS WASTE PROGRAM, CRITERIA AND HAZARDOUS AIR POLLUTANT INVENTORY (Inventory of air pollution sources) National Pollutant Discharge Elimination System NON-MAJOR (Tracking pollutant discharge elimination systems) - permit HAZARDOUS WASTE BIENNIAL REPORTER (Resource Conservation and Recovery Act (tracking hazardous waste)) Large Quantity Generators, more that 1000 kg of hazardous waste/month (Resource Conservation and Recovery Act (tracking hazardous waste)) TRI REPORTER (Tracking of toxic chemicals releasing facilities) Business SIC classification: MACHINE TOOLS, METAL CUTTING TYPES; POWER-DRIVEN HANDTOOLS; AIR AND WATER RESOURCE AND SOLID WASTE MANAGEMENT Organizations: FORMER CHICAGO PNEUMATIC TOOL (CONTACT/OWNER)
Alternative names: O'BRIEN & GERE OPERATIONS
GRANNYS KITCHENS LLC (10 INDUSTRIAL PARK DRIVE in FRANKFORT, NY)
AIR MINOR (AIRS/AFS) STATE MASTER (New York facility tracking) - AIR PROGRAM, Business SIC classification: BREAD AND OTHER BAKERY PRODUCTS, EXCEPT COOKIES AND CRACKERS Organizations: GRANNY S KITCHENS LLC, GRANNYS KITCHENS LTD (LEGALLY RESPONSIBLE PARTY)
Alternative names: GRANNYS KITCHENS LTD
H M QUACKENBUSH (RTE 5 S in FRANKFORT, NY)
STATE MASTER (New York facility tracking) - AIR PROGRAM Large Quantity Generators, more that 1000 kg of hazardous waste/month (Resource Conservation and Recovery Act (tracking hazardous waste)) - notification Business SIC and NAICS classification: ELECTROPLATING, PLATING, POLISHING, ANODIZING, AND COLORING Organizations: HERKIMER COUNTY INDUSTRIAL DEVEL AGENCY (CONTACT/OWNER)
, H M QUACKENBUSH INC (LEGALLY RESPONSIBLE PARTY)
AAR POWER SERVICES (1 FRANKFORT INDUSTRIAL PARK in FRANKFORT, NY)
AIR SYNTHETIC MINOR (AIRS/AFS) CRITERIA AND HAZARDOUS AIR POLLUTANT INVENTORY (Inventory of air pollution sources) HAZARDOUS WASTE BIENNIAL REPORTER (Resource Conservation and Recovery Act (tracking hazardous waste)) Large Quantity Generators, more that 1000 kg of hazardous waste/month (Resource Conservation and Recovery Act (tracking hazardous waste)) Business SIC classification: AIRCRAFT ENGINES AND ENGINE PARTS Organizations: AAR CORP (CONTACT/OPERATOR)
Alternative names: AAR ENGINE COMPONENT SERVICES, AAR ENGINE COMPONENT SYSTEMS
A A R ENGINE COMPONENT SERVICES (148 INDUSTRIAL PARK DR in FRANKFORT, NY)
Large Quantity Generators, more that 1000 kg of hazardous waste/month (Resource Conservation and Recovery Act (tracking hazardous waste)) - notification Organizations: AAR ENGINE SERVICES INC (CONTACT/OWNER)
GRANNYS KITCHENS (178 INDUSTRIAL PARK DR in FRANKFORT, NY)
Small Quantity Generators, between 100 kg and 1000 kg of hazardous waste/month (Resource Conservation and Recovery Act (tracking hazardous waste)) Organizations: DAN HARDING (CONTACT/OPERATOR)
, ALAN ROSENBLUM (CONTACT/OWNER)
Housing units lacking complete plumbing facilities: 1.0% Housing units lacking complete kitchen facilities: 1.0%
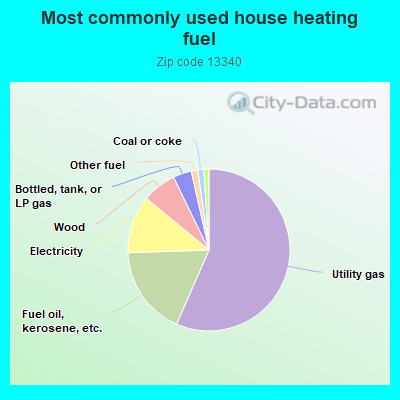
56.5%Utility gas
17.9%Fuel oil, kerosene, etc.
11.5%Electricity
6.8%Wood
3.7%Bottled, tank, or LP gas
1.3%Other fuel
1.2%Coal or coke
1.0%Solar energy
Population in 1990: 8,546.
Place of birth for U.S.-born residents:
This state: 6,398
Northeast: 190
Midwest: 38
South: 157
West: 22
69% of the 13340 zip code residents lived in the same house 5 years ago. Out of people who lived in different houses, 51% lived in this county. Out of people who lived in different counties, 50% lived in New York.
93% of the 13340 zip code residents lived in the same house 1 year ago. Out of people who lived in different houses, 47% moved from this county. Out of people who lived in different houses, 46% moved from different county within same state. Out of people who lived in different houses, 6% moved from different state.
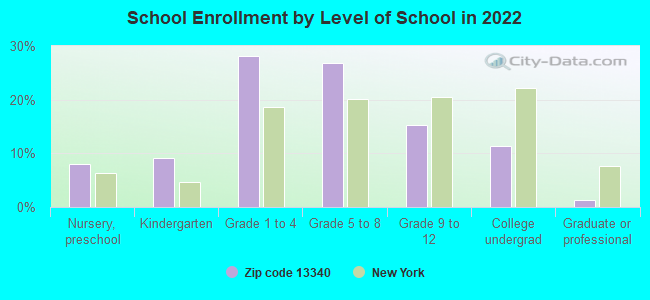
Private vs. public school enrollment:
Students in private schools in grades 1 to 8 (elementary and middle school): 71
Here:
9.7%
New York:
15.6%
Students in private schools in grades 9 to 12 (high school):
Here:
0.0%
New York:
15.0%
Students in private undergraduate colleges: 35
Here:
23.6%
New York:
39.2%
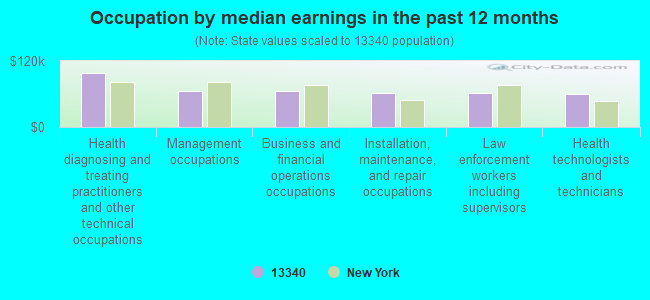
Occupation by median earnings in the past 12 months ($)
99,036Health diagnosing and treating practitioners and other technical occupations
66,106Management occupations
64,860Business and financial operations occupations
61,582Installation, maintenance, and repair occupations
61,266Law enforcement workers including supervisors
59,846Health technologists and technicians
Companies with federal contracts located in this zip code (FRANKFORT, NY):
AAR PARTS TRADING, INC (148 INDUSTRIAL PARK DRIVE) : $14,592,356 in 65 contractsfrom 2000 to 2006
Contracts for Gas Turbines and Jet Engines, Aircraft; Prime Moving, and Components, Maintenance, Repair and Rebuilding of Equipment -- Engines, Turbines, and Components by Air Force Signed by year:2000: $814,138; 2001: $295,815; 2002: $2,683,654; 2003: $2,337,406; 2004: $384,314; 2005: $5,726,720; 2006: $2,350,309.
Biggest contracts:
$1,334,946 with Air Force for Gas Turbines and Jet Engines, Aircraft; Prime Moving, and Components. Signed on 2005-10-28. Completion date: 2006-06-30.
$1,210,736 with Air Force for Maintenance, Repair and Rebuilding of Equipment -- Engines, Turbines, and Components. Signed on 2005-02-04. Completion date: 2005-12-30.
$1,071,395 with Air Force for Gas Turbines and Jet Engines, Aircraft; Prime Moving, and Components. Signed on 2002-12-05. Completion date: 2003-12-31.
$772,740, same as above.Signed on 2006-05-09. Completion date: 2006-12-29.
SAVOY-JOSEPH INC (2237 EAST BROAD STREET; small business) : $1,044,642 in 4 contractsfrom 2001 to 2003
$497,400 with Air Force for Maintenance, Repair or Alteration of Real Property -- Office Buildings. Signed on 2001-06-28. Completion date: 2002-01-12.
$375,000, same as above.Signed on 2001-09-12. Completion date: 2002-04-15.
$159,850, same as above.Signed on 2002-09-27. Completion date: 2002-12-17.
$12,392, same as above.Signed on 2003-07-29. Completion date: 2003-07-31.
EVERIS, INC (889 CLEMONS, RD; small business) : $149,600 in 3 contractsin 2005
$84,600 with Air Force for Other Defense -- Basic Research (R&D). Signed on 2005-11-07. Completion date: 2006-08-16.
$50,000, same as above.Signed on 2005-08-19. Completion date: 2006-08-16.
$15,000, same as above.Signed on 2005-10-25. Completion date: 2006-08-16.
J GRIPPE INDUSTRIAL SUPPLY, I (4160 ACME ROAD; small business) : $73,443 in 19 contractsfrom 2004 to 2006
Contracts for Cabinets, Lockers, Bins, and Shelving, Cutting Tools for Machine Tools, Tool and Hardware Boxes, Fans, Air Circulators, and Blower Equipment, and moreby Army Signed by year:2000: $0; 2001: $0; 2002: $0; 2003: $0; 2004: $30,969; 2005: $28,635; 2006: $13,839.
Biggest contracts:
$10,595 with Army for Cabinets, Lockers, Bins, and Shelving. Signed on 2004-03-23. Completion date: 2004-04-29.
$7,001 with Army for Cutting Tools for Machine Tools. Signed on 2006-06-20. Completion date: 2006-08-31.
$6,697, same as above.Signed on 2004-01-30. Completion date: 2004-03-22.
$5,500 with Army for Tool and Hardware Boxes. Signed on 2005-01-18. Completion date: 2005-02-04.
RONS SERVICE STATION (132 E MAIN STREET; small business) : -$25 in 2 contractsin 2002
$0 with Navy for Snow Removal/Salt Service (also spreading aggregate or other snow melting material). Signed on 2002-10-01. Completion date: 2002-04-30.
-$25, same as above.Signed on 2002-10-01. Completion date: 2002-04-30.
Top industries in this zip code by the number of employees in 2005:
2002 - 2018 National Fire Incident Reporting System (NFIRS) incidents
According to the data from the years 2002 - 2018 the average number of fires per year is 31. The highest number of fires - 58 took place in 2007, and the least - 9 in 2010. The data has a growing trend.
When looking into fire subcategories, the most incidents belonged to: Structure Fires (49.3%), and Outside Fires (18.5%).
Fire incident types reported to NFIRS in Zip Code 13340


+$1,133
-$2,666
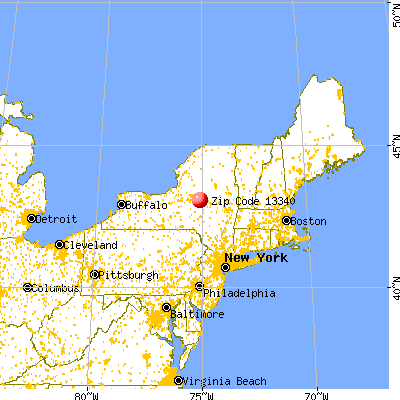
 Nearest zip codes: 13502, 13501, 13357, 13350, 13322, 13456.


 According to the data from the years 2002 - 2018 the average number of fires per year is 31. The highest number of fires - 58 took place in 2007, and the least - 9 in 2010. The data has a growing trend.
 When looking into fire subcategories, the most incidents belonged to: Structure Fires (49.3%), and Outside Fires (18.5%).