Estimated zip code population in 2022: 1,908 Zip code population in 2010: 2,069 Zip code population in 2000: 1,840
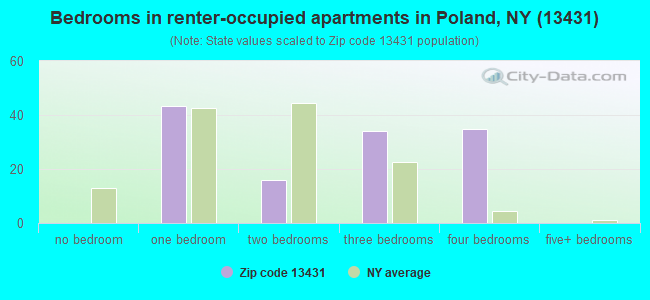
Houses and condos: 806 Renter-occupied apartments: 129
% of renters here:
18%
State:
46%
March 2022 cost of living index in zip code 13431: 94.3 (less than average, U.S. average is 100)
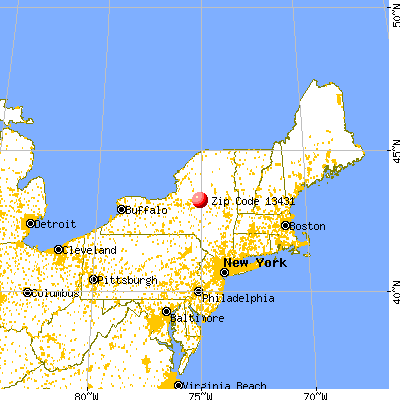
Land area: 36.9 sq. mi. Water area: 0.3 sq. mi.
Population density: 52 people per square mile
(very low).
OSM Map
General Map
Google Map
MSN Map
OSM Map
General Map
Google Map
MSN Map
OSM Map
General Map
Google Map
MSN Map
OSM Map
General Map
Google Map
MSN Map
Please wait while loading the map...
Real estate property taxes paid for housing units in 2022:
This zip code:
1.4% ($2,565)
New York:
1.5% ($6,180)
Median real estate property taxes paid for housing units with mortgages in 2022: $2,979 (1.5%) Median real estate property taxes paid for housing units with no mortgage in 2022: $1,442 (0.9%)
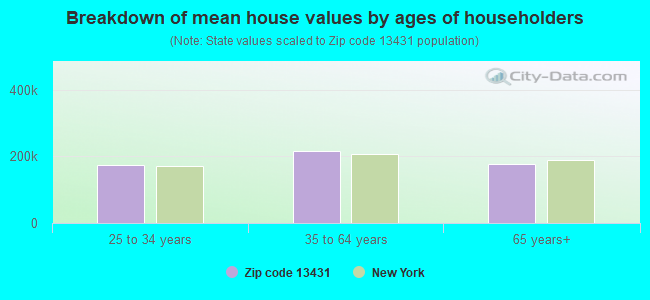
Estimated median house/condo value in 2022: $185,554
13431:
$185,554
New York:
$400,400
According to our research of New York and other state lists, there were 2 registered sex offenders living in 13431 zip code as of April 27, 2024. The ratio of all residents to sex offenders in zip code 13431 is 950 to 1. The ratio of registered sex offenders to all residents in this zip code is near the state average.
Median resident age:
This zip code:
40.2 years
New York median age:
40.0 years
Average household size:
This zip code:
2.6 people
New York:
2.5 people
Averages for the 2020 tax year for zip code 13431, filed in 2021:
Average Adjusted Gross Income (AGI) in 2020: $63,999 (Individual Income Tax Returns)
Here:
$63,999
State:
$90,930
Salary/wage: $57,572 (reported on 79.1% of returns)
Here:
$57,572
State:
$72,104
(% of AGI for various income ranges: 1083.6% for AGIs below $25k, 3735.9% for AGIs $25k-50k, 5920.8% for AGIs $50k-75k, 8341.4% for AGIs $75k-100k, 20048.0% for AGIs $100k-200k)
Taxable interest for individuals: $695 (reported on 40.7% of returns)
This zip code:
$695
New York:
$3,075
(% of AGI for various income ranges: 48.6% for AGIs below $25k, 22.9% for AGIs $25k-50k, 20.8% for AGIs $50k-75k, 48.6% for AGIs $75k-100k, 89.0% for AGIs $100k-200k)
Ordinary dividends: $3,310 (reported on 23.1% of returns)
Here:
$3,310
State:
$11,095
(% of AGI for various income ranges: 70.7% for AGIs below $25k, 28.2% for AGIs $25k-50k, 56.9% for AGIs $50k-75k, 75.7% for AGIs $75k-100k, 421.0% for AGIs $100k-200k)
Net capital gain/loss in AGI: +$4,807 (reported on 16.5% of returns)
Here:
+$4,807
State:
+$44,925
(% of AGI for various income ranges: 61.2% for AGIs $25k-50k, 15.4% for AGIs $50k-75k, 108.6% for AGIs $75k-100k, 523.0% for AGIs $100k-200k)
Profit/loss from business: +$12,464 (reported on 15.4% of returns)
Here:
+$12,464
State:
+$14,940
(% of AGI for various income ranges: 252.9% for AGIs below $25k, 51.2% for AGIs $25k-50k, 209.2% for AGIs $50k-75k, 475.7% for AGIs $75k-100k, 699.0% for AGIs $100k-200k)
Taxable individual retirement arrangement distribution: $14,811 (reported on 9.9% of returns)
13431:
$14,811
New York:
$19,609
(% of AGI for various income ranges: 160.6% for AGIs $25k-50k, 318.5% for AGIs $50k-75k, 646.0% for AGIs $100k-200k)
Total itemized deductions: $18,800 (reported on 3.3% of returns)
Here:
$18,800
State:
$39,326
(% of AGI for various income ranges: 433.8% for AGIs $50k-75k)
Taxes paid: $7,367 (reported on 3.3% of returns)
13431:
$7,367
State:
$9,183
(% of AGI for various income ranges: 170.0% for AGIs $50k-75k)
Earned income credit: $2,070 (reported on 11.0% of returns)
Here:
$2,070
State:
$2,138
(% of AGI for various income ranges: 87.1% for AGIs below $25k, 50.0% for AGIs $25k-50k)
Percentage of individuals using paid preparers for their 2020 taxes: 94.5%
Here:
95%
State:
95%
(% for various income ranges: 91.3% for AGIs below $25k, 95.7% for AGIs $25k-50k, 94.1% for AGIs $50k-75k, 100.0% for AGIs $75k-100k, 93.8% for AGIs $100k-200k, 100.0% for AGIs over 200k)
Averages for the 2012 tax year for zip code 13431, filed in 2013:
Average Adjusted Gross Income (AGI) in 2012: $48,624 (Individual Income Tax Returns)
Here:
$48,624
State:
$77,088
Salary/wage: $44,167 (reported on 84.3% of returns)
Here:
$44,167
State:
$60,593
(% of AGI for various income ranges: 71.9% for AGIs below $25k, 73.9% for AGIs $25k-50k, 74.4% for AGIs $50k-75k, 73.5% for AGIs $75k-100k, 82.3% for AGIs $100k-200k)
Taxable interest for individuals: $513 (reported on 42.7% of returns)
This zip code:
$513
New York:
$3,125
(% of AGI for various income ranges: 1.2% for AGIs below $25k, 0.6% for AGIs $25k-50k, 0.4% for AGIs $50k-75k, 0.3% for AGIs $75k-100k, 0.3% for AGIs $100k-200k)
Ordinary dividends: $2,145 (reported on 22.5% of returns)
Here:
$2,145
State:
$10,299
(% of AGI for various income ranges: 0.8% for AGIs below $25k, 1.2% for AGIs $25k-50k, 0.8% for AGIs $50k-75k, 0.8% for AGIs $75k-100k, 1.2% for AGIs $100k-200k)
Net capital gain/loss in AGI: +$2,062 (reported on 14.6% of returns)
Here:
+$2,062
State:
+$42,474
(% of AGI for various income ranges: 1.3% for AGIs $25k-50k, 1.4% for AGIs $50k-75k, 0.5% for AGIs $100k-200k)
Profit/loss from business: +$8,050 (reported on 15.7% of returns)
Here:
+$8,050
State:
+$16,168
(% of AGI for various income ranges: 9.4% for AGIs below $25k, 2.8% for AGIs $25k-50k, 0.9% for AGIs $50k-75k, 4.3% for AGIs $75k-100k, 0.5% for AGIs $100k-200k)
Taxable individual retirement arrangement distribution: $6,967 (reported on 10.1% of returns)
13431:
$6,967
New York:
$17,621
(% of AGI for various income ranges: 2.1% for AGIs below $25k, 3.2% for AGIs $25k-50k, 3.5% for AGIs $75k-100k)
Total itemized deductions: $18,795 (21% of AGI, reported on 23.6% of returns)
Here:
$18,795
State:
$34,985
Here:
21.0% of AGI
State:
21.3% of AGI
(% of AGI for various income ranges: 7.9% for AGIs $25k-50k, 9.9% for AGIs $50k-75k, 9.1% for AGIs $75k-100k, 11.8% for AGIs $100k-200k)
Charity contributions: $1,838 (reported on 18.0% of returns)
Here:
$1,838
State:
$5,572
(% of AGI for various income ranges: 0.7% for AGIs below $25k, 0.5% for AGIs $50k-75k, 0.6% for AGIs $75k-100k, 1.1% for AGIs $100k-200k)
Taxes paid: $7,729 (reported on 23.6% of returns)
13431:
$7,729
State:
$18,656
(% of AGI for various income ranges: 2.0% for AGIs $25k-50k, 3.4% for AGIs $50k-75k, 3.7% for AGIs $75k-100k, 5.9% for AGIs $100k-200k)
Earned income credit: $2,107 (reported on 15.7% of returns)
Here:
$2,107
State:
$2,230
(% of AGI for various income ranges: 5.4% for AGIs below $25k, 1.0% for AGIs $25k-50k)
Percentage of individuals using paid preparers for their 2012 taxes: 60.7%
Here:
61%
State:
66%
(% for various income ranges: 55.9% for AGIs below $25k, 57.9% for AGIs $25k-50k, 64.3% for AGIs $50k-75k, 63.6% for AGIs $75k-100k, 72.7% for AGIs $100k-200k)
Averages for the 2004 tax year for zip code 13431, filed in 2005:
Average Adjusted Gross Income (AGI) in 2004: $38,158 (Individual Income Tax Returns)
Here:
$38,158
State:
$59,519
Salary/wage: $36,674 (reported on 83.5% of returns)
Here:
$36,674
State:
$50,673
(% of AGI for various income ranges: 109.8% for AGIs below $10k, 67.2% for AGIs $10k-25k, 76.5% for AGIs $25k-50k, 84.2% for AGIs $50k-75k, 90.1% for AGIs $75k-100k, 72.8% for AGIs over 100k)
Taxable interest for individuals: $907 (reported on 52.1% of returns)
This zip code:
$907
New York:
$2,377
(% of AGI for various income ranges: 4.5% for AGIs below $10k, 1.9% for AGIs $10k-25k, 1.4% for AGIs $25k-50k, 1.0% for AGIs $50k-75k, 0.3% for AGIs $75k-100k, 1.6% for AGIs over 100k)
Taxable dividends: $1,552 (reported on 28.8% of returns)
Here:
$1,552
State:
$5,394
(% of AGI for various income ranges: 3.8% for AGIs below $10k, 2.5% for AGIs $10k-25k, 0.7% for AGIs $25k-50k, 0.6% for AGIs $50k-75k, 0.4% for AGIs $75k-100k, 2.7% for AGIs over 100k)
Net capital gain/loss: +$1,335 (reported on 18.5% of returns)
Here:
+$1,335
State:
+$23,581
(% of AGI for various income ranges: 2.3% for AGIs below $10k, 0.0% for AGIs $10k-25k, 0.5% for AGIs $25k-50k, 1.9% for AGIs $50k-75k, -0.1% for AGIs $75k-100k, 0.2% for AGIs over 100k)
Profit/loss from business: +$2,101 (reported on 14.9% of returns)
Here:
+$2,101
State:
+$13,809
(% of AGI for various income ranges: -9.9% for AGIs below $10k, 6.9% for AGIs $10k-25k, 0.4% for AGIs $25k-50k, 0.6% for AGIs $50k-75k)
Profit/loss from farming: +$2,300 (reported on 3.5% of returns)
Here:
+$2,300
State:
-$2,666
IRA payment deduction: $2,806 (reported on 3.6% of returns)
13431:
$2,806
New York:
$3,115
Total itemized deductions: $15,174 (21% of AGI, reported on 22.5% of returns)
Here:
$15,174
State:
$25,864
Here:
20.6% of AGI
State:
21.9% of AGI
(% of AGI for various income ranges: 2.8% for AGIs $10k-25k, 6.5% for AGIs $25k-50k, 9.8% for AGIs $50k-75k, 13.5% for AGIs $75k-100k, 11.0% for AGIs over 100k)
Charity contributions deductions: $1,833 (2% of AGI, reported on 20.7% of returns)
Here:
$1,833
State:
$4,439
Here:
2.5% of AGI
State:
3.6% of AGI
(% of AGI for various income ranges: 0.7% for AGIs $25k-50k, 1.2% for AGIs $50k-75k, 1.5% for AGIs $75k-100k, 1.4% for AGIs over 100k)
Total tax: $4,269 (reported on 77.1% of returns)
13431:
$4,269
State:
$11,730
(% of AGI for various income ranges: 4.5% for AGIs below $10k, 4.6% for AGIs $10k-25k, 6.6% for AGIs $25k-50k, 7.8% for AGIs $50k-75k, 9.5% for AGIs $75k-100k, 15.5% for AGIs over 100k)
Earned income credit: $1,748 (reported on 15.1% of returns)
Here:
$1,748
State:
$1,757
Percentage of individuals using paid preparers for their 2004 taxes: 61.3%
Here:
61%
State:
67%
(% for various income ranges: 54.0% for AGIs below $10k, 58.4% for AGIs $10k-25k, 61.2% for AGIs $25k-50k, 70.9% for AGIs $50k-75k, 62.0% for AGIs $75k-100k, 75.7% for AGIs over 100k)
Household received Food Stamps/SNAP in the past 12 months: 27 Household did not receive Food Stamps/SNAP in the past 12 months: 676
Women who had a birth in the past 12 months: 4 (0 now married, 4 unmarried) Women who did not have a birth in the past 12 months: 428 (220 now married, 205 unmarried)
Housing units in zip code 13431 with a mortgage: 355 (53 second mortgage, 53 both second mortgage and home equity loan) Median monthly owner costs for units with a mortgage: $1,543 Median monthly owner costs for units without a mortgage: $540
Residents with income below the poverty level in 2022:
This zip code:
6.2%
Whole state:
14.3%
Residents with income below 50% of the poverty level in 2022:
This zip code:
4.6%
Whole state:
6.8%
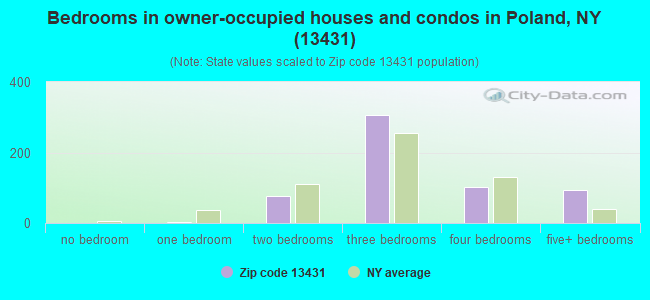
Median number of rooms in houses and condos:
Here:
6.9
State:
6.3
Median number of rooms in apartments:
Here:
5.4
State:
3.8
Notable locations in this zip code not listed on our city pages
Notable locations in zip code 13431: The Golf Club of Newport (A), Martin Corners (B), Walker Corners (C), Poland Public Library (D), Poland Volunteer Fire Company (E). Display/hide their locations on the map
Cemeteries: Poland Cemetery (1), Martins Corners Cemetery (2), Welch Calvinistic Methodist Cemetery (3), Gravesville Cemetery (4), Pine Grove Cemetery (5), Tanner Hill Cemetery (6). Display/hide their locations on the map
In group quarters: 20 (-1 institutionalized population)
Size of family households: 254 2-persons, 125 3-persons, 85 4-persons, 59 5-persons, 5 6-persons, 8 7-or-more-persons
Size of nonfamily households: 153 1-person, 17 2-persons
320 married couples with children.
80 single-parent households (55 men, 25 women).
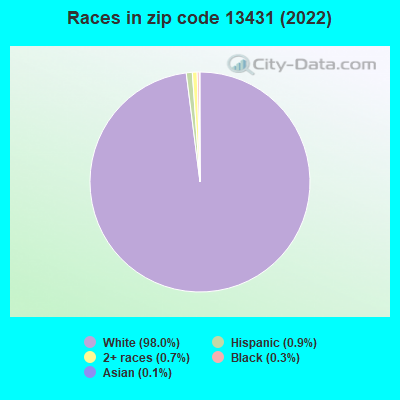
95.5% of residents of 13431 zip code speak English at home.
3.6% of residents speak other Indo-European language at home (64% very well, 12% well, 24% not well).
0.4% of residents speak Asian or Pacific Island language at home (100% very well).
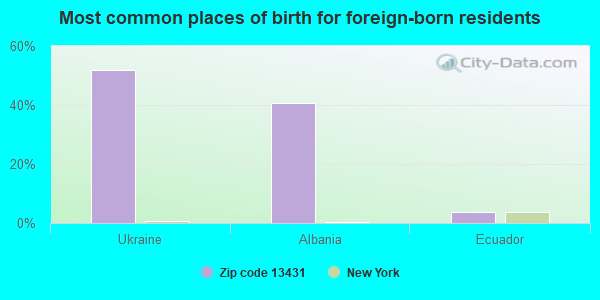
Foreign born population: 28 (1.5%) (82.9% of them are naturalized citizens)
This zip code:
1.5%
Whole state:
22.7%
52%Ukraine
41%Albania
4%Ecuador
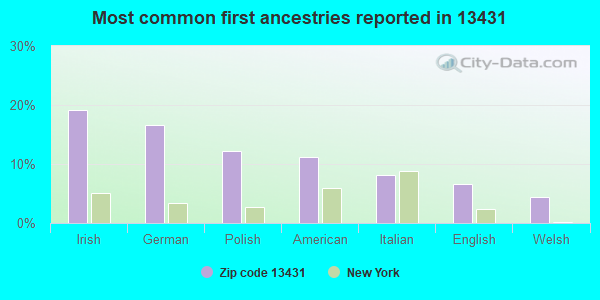
19%Irish
17%German
12%Polish
11%American
8%Italian
7%English
4%Welsh
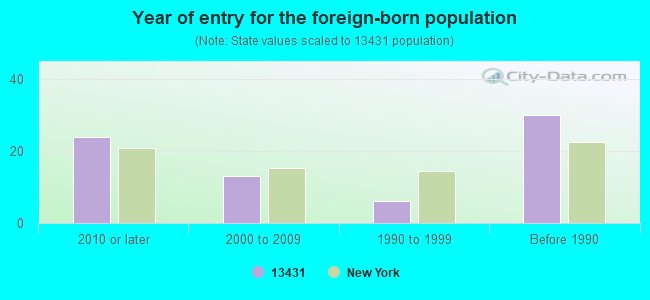
Year of entry for the foreign-born population
242010 or later
132000 to 2009
61990 to 1999
30Before 1990
Facilities with environmental interests located in this zip code:
HANSON - BIENICK (BEECHER ROAD in RUSSIA, NY)
AIR MINOR (AIRS/AFS) AIR SYNTHETIC MINOR (AIRS/AFS) STATE MASTER (New York facility tracking) - MINE OPERATING PERMIT, AIR PROGRAM, National Pollutant Discharge Elimination System Permit Business SIC classification: CRUSHED AND BROKEN LIMESTONE; CONSTRUCTION SAND AND GRAVEL Organizations: HANSON AGGREGATES NEW YORK INC (LEGALLY RESPONSIBLE PARTY)
, EASTERN ROCK PRODUCTS INC (LEGALLY RESPONSIBLE PARTY)
Alternative names: BENCHMARK NEW YORK INC - BIENICK
HANSON - POLAND (RT 28 in POLAND, NY)
AIR SYNTHETIC MINOR (AIRS/AFS) STATE MASTER (New York facility tracking) - AIR PROGRAM, MINE OPERATING PERMIT, National Pollutant Discharge Elimination System Permit Business SIC classification: CRUSHED AND BROKEN LIMESTONE; CONSTRUCTION SAND AND GRAVEL Organizations: HANSON AGGREGATES NEW YORK INC (LEGALLY RESPONSIBLE PARTY)
Alternative names: HANSON - MIDDLEVILLE
COUNTRY CARRIAGE AUTO BODY (RT 28 BOX 92 in RUSSIA, NY)
STATE MASTER (New York facility tracking) - AIR PROGRAM (Resource Conservation and Recovery Act (tracking hazardous waste))
GRAVESVILLE PLANT (HINCKLEY RD in RUSSIA, NY)
AIR SYNTHETIC MINOR (AIRS/AFS) STATE MASTER (New York facility tracking) - MINE OPERATING PERMIT, SECTION 404 PERMITTING, AIR PROGRAM, MINE OPERATING PERMIT, National Pollutant Discharge Elimination System Permit, AIR PROGRAM, Business SIC classification: CRUSHED AND BROKEN LIMESTONE; CONSTRUCTION SAND AND GRAVEL Organizations: MATERIAL SAND AND GRAVEL INC (LEGALLY RESPONSIBLE PARTY)
Housing units lacking complete plumbing facilities: 0.6% Housing units lacking complete kitchen facilities: 3.0%
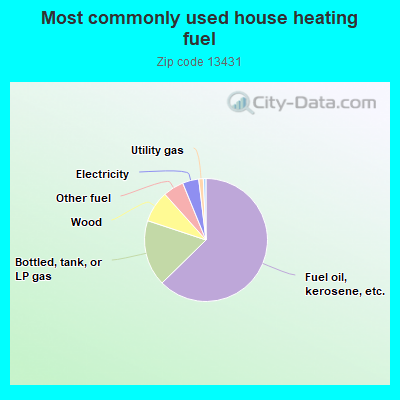
63.0%Fuel oil, kerosene, etc.
17.5%Bottled, tank, or LP gas
8.3%Wood
5.5%Other fuel
4.3%Electricity
1.2%Utility gas
0.7%No fuel used
Population in 1990: 1,789. Population change in the 1990s: +51 (+2.9%).
Place of birth for U.S.-born residents:
This state: 1,526
Northeast: 131
Midwest: 45
South: 59
West: 70
73% of the 13431 zip code residents lived in the same house 5 years ago. Out of people who lived in different houses, 51% lived in this county. Out of people who lived in different counties, 50% lived in New York.
89% of the 13431 zip code residents lived in the same house 1 year ago. Out of people who lived in different houses, 29% moved from this county. Out of people who lived in different houses, 7% moved from different county within same state. Out of people who lived in different houses, 69% moved from different state.
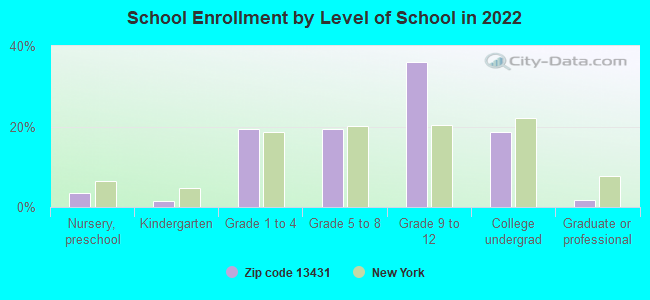
Private vs. public school enrollment:
Students in private schools in grades 1 to 8 (elementary and middle school):
Here:
0.0%
New York:
15.6%
Students in private schools in grades 9 to 12 (high school): 11
Here:
6.6%
New York:
15.0%
Students in private undergraduate colleges: 28
Here:
30.2%
New York:
39.2%
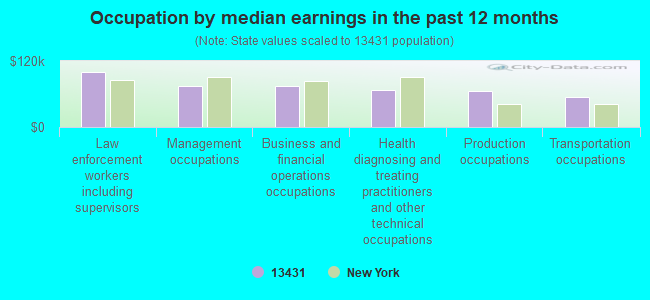
Occupation by median earnings in the past 12 months ($)
99,846Law enforcement workers including supervisors
73,942Management occupations
73,916Business and financial operations occupations
66,937Health diagnosing and treating practitioners and other technical occupations
65,497Production occupations
53,916Transportation occupations
Companies with federal contracts located in this zip code:
BASELINE KING CORP (4618 MILITARY ROAD in POLAND, NY; small business) : $527,612 in 3 contractsfrom 2003 to 2004
$448,550 with Air Force for Maintenance, Repair or Alteration of Real Property -- Office Buildings. Taking place in MA. Signed on 2003-12-31. Completion date: 2004-06-28.
$74,262, same as above.Signed on 2004-05-19. Completion date: 2004-06-28.
$4,800, same as above.Signed on 2004-07-23. Completion date: 2004-08-27.
ROGER'S FENCE COMPANY, INC (17 RAILROAD ST in POLAND, NY; small business) 30 employees, $2200000 revenue. Woman Owned Business
$43,000 with Bureau of Prisoners/Federal Prison System for Installation of Equipment -- Miscellaneous. Signed on 2002-01-15. Completion date: 2002-05-15.
BELL CONSTRUCTION COMPANY INC (205 STATE ROUTE 8 in POLAND, NY; small business) 14 employees, $2000000 revenue.
$35,000 with Soil Conservation Service (disused code) for Construction of Structures and Facilities -- Restoration of real property. Signed on 1999-12-15. Completion date: 1999-12-15.
Top industries in this zip code by the number of employees in 2005:
Construction: All Other Specialty Trade Contractors (10-19 employees: 1 establishment, 5-9 employees: 1 establishment)
Mining: Construction Sand and Gravel Mining (5-9: 2)
Construction: Electrical Contractors (1-4: 2)
Other Services (except Public Administration): Automotive Glass Replacement Shops (1-4: 1)
Construction: Highway, Street, and Bridge Construction (1-4: 1)
Construction: Plumbing, Heating, and Air-Conditioning Contractors (1-4: 1)
Accommodation and Food Services: Snack and Nonalcoholic Beverage Bars (1-4: 1)
People in group quarters in 2010:
12 people in group homes intended for adults
Fatal accident statistics in 2014:
Fatal accident count: 1
Vehicles involved in fatal accidents: 1
Fatal accidents caused by drunken drivers: 1
Fatalities: 1
Persons involved in fatal accidents: 2
Pedestrians involved in fatal accidents: 0
Home Mortgage Disclosure Act Aggregated Statistics For Year 2009 (Based on 4 partial tracts)
A) FHA, FSA/RHS & VA Home Purchase Loans
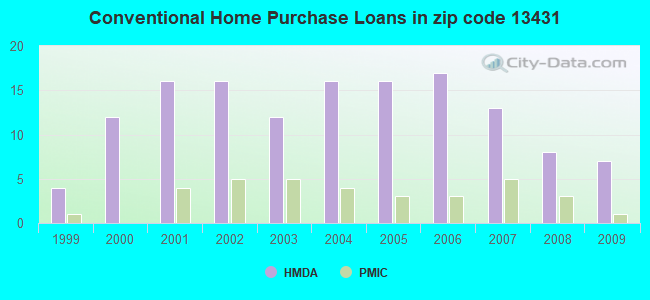
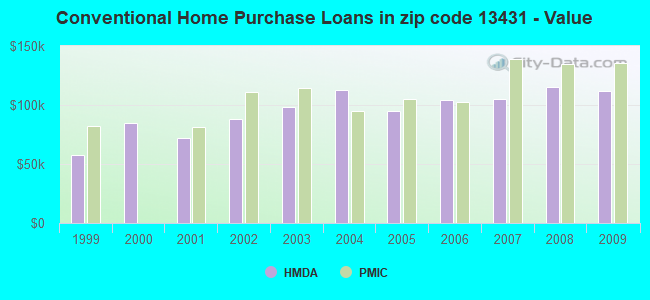
B) Conventional Home Purchase Loans
C) Refinancings
D) Home Improvement Loans
F) Non-occupant Loans on < 5 Family Dwellings (A B C & D)
G) Loans On Manufactured Home Dwelling (A B C & D)
Number
Average Value
Number
Average Value
Number
Average Value
Number
Average Value
Number
Average Value
Number
Average Value
LOANS ORIGINATED
3
$136,033
7
$111,956
19
$111,472
6
$25,712
1
$33,530
2
$44,190
APPLICATIONS APPROVED, NOT ACCEPTED
1
$43,600
0
$0
1
$171,520
1
$3,170
0
$0
0
$0
APPLICATIONS DENIED
1
$87,570
2
$80,650
10
$129,065
7
$16,196
1
$42,770
4
$55,968
APPLICATIONS WITHDRAWN
1
$38,540
0
$0
5
$111,954
0
$0
0
$0
0
$0
FILES CLOSED FOR INCOMPLETENESS
0
$0
0
$0
1
$148,800
0
$0
0
$0
0
$0
Aggregated Statistics For Year 2008 (Based on 4 partial tracts)
A) FHA, FSA/RHS & VA Home Purchase Loans
B) Conventional Home Purchase Loans
C) Refinancings
D) Home Improvement Loans
F) Non-occupant Loans on < 5 Family Dwellings (A B C & D)
G) Loans On Manufactured Home Dwelling (A B C & D)
Number
Average Value
Number
Average Value
Number
Average Value
Number
Average Value
Number
Average Value
Number
Average Value
LOANS ORIGINATED
4
$92,585
8
$115,264
20
$88,982
8
$38,041
1
$84,810
3
$76,097
APPLICATIONS APPROVED, NOT ACCEPTED
1
$39,360
2
$103,235
2
$136,300
1
$11,620
0
$0
1
$86,500
APPLICATIONS DENIED
2
$71,910
3
$92,067
13
$128,252
9
$38,083
1
$114,130
2
$68,455
APPLICATIONS WITHDRAWN
1
$87,980
1
$78,930
6
$153,205
1
$32,990
0
$0
0
$0
FILES CLOSED FOR INCOMPLETENESS
0
$0
0
$0
4
$110,155
1
$15,670
0
$0
1
$116,950
Aggregated Statistics For Year 2007 (Based on 4 partial tracts)
A) FHA, FSA/RHS & VA Home Purchase Loans
B) Conventional Home Purchase Loans
C) Refinancings
D) Home Improvement Loans
F) Non-occupant Loans on < 5 Family Dwellings (A B C & D)
G) Loans On Manufactured Home Dwelling (A B C & D)
Number
Average Value
Number
Average Value
Number
Average Value
Number
Average Value
Number
Average Value
Number
Average Value
LOANS ORIGINATED
3
$77,823
13
$104,911
18
$84,249
12
$29,122
2
$80,520
5
$53,702
APPLICATIONS APPROVED, NOT ACCEPTED
0
$0
2
$101,005
3
$98,020
1
$60,260
0
$0
1
$78,410
APPLICATIONS DENIED
0
$0
4
$59,242
17
$99,375
10
$39,544
1
$85,050
4
$50,078
APPLICATIONS WITHDRAWN
0
$0
1
$103,680
8
$90,638
3
$77,553
0
$0
0
$0
FILES CLOSED FOR INCOMPLETENESS
1
$44,260
0
$0
2
$107,520
0
$0
0
$0
0
$0
Aggregated Statistics For Year 2006 (Based on 4 partial tracts)
A) FHA, FSA/RHS & VA Home Purchase Loans
B) Conventional Home Purchase Loans
C) Refinancings
D) Home Improvement Loans
F) Non-occupant Loans on < 5 Family Dwellings (A B C & D)
G) Loans On Manufactured Home Dwelling (A B C & D)
Number
Average Value
Number
Average Value
Number
Average Value
Number
Average Value
Number
Average Value
Number
Average Value
LOANS ORIGINATED
2
$118,980
17
$104,558
24
$82,203
13
$25,045
2
$62,570
4
$57,655
APPLICATIONS APPROVED, NOT ACCEPTED
0
$0
3
$79,427
3
$81,763
0
$0
0
$0
1
$59,770
APPLICATIONS DENIED
0
$0
4
$106,098
26
$92,811
12
$39,064
2
$69,695
4
$77,985
APPLICATIONS WITHDRAWN
0
$0
3
$117,257
13
$99,808
3
$50,377
0
$0
1
$99,250
FILES CLOSED FOR INCOMPLETENESS
0
$0
1
$73,390
3
$139,423
0
$0
0
$0
0
$0
Aggregated Statistics For Year 2005 (Based on 4 partial tracts)
A) FHA, FSA/RHS & VA Home Purchase Loans
B) Conventional Home Purchase Loans
C) Refinancings
D) Home Improvement Loans
F) Non-occupant Loans on < 5 Family Dwellings (A B C & D)
G) Loans On Manufactured Home Dwelling (A B C & D)
Number
Average Value
Number
Average Value
Number
Average Value
Number
Average Value
Number
Average Value
Number
Average Value
LOANS ORIGINATED
3
$70,563
16
$95,032
23
$73,607
12
$26,308
1
$123,290
4
$58,558
APPLICATIONS APPROVED, NOT ACCEPTED
0
$0
3
$93,543
3
$87,493
1
$51,840
1
$55,440
2
$85,010
APPLICATIONS DENIED
0
$0
4
$76,310
22
$90,405
9
$33,788
1
$34,060
4
$51,545
APPLICATIONS WITHDRAWN
1
$55,700
3
$69,037
19
$98,773
2
$136,985
1
$63,890
3
$63,827
FILES CLOSED FOR INCOMPLETENESS
0
$0
0
$0
4
$97,628
0
$0
0
$0
0
$0
Aggregated Statistics For Year 2004 (Based on 4 partial tracts)
A) FHA, FSA/RHS & VA Home Purchase Loans
B) Conventional Home Purchase Loans
C) Refinancings
D) Home Improvement Loans
F) Non-occupant Loans on < 5 Family Dwellings (A B C & D)
G) Loans On Manufactured Home Dwelling (A B C & D)
Number
Average Value
Number
Average Value
Number
Average Value
Number
Average Value
Number
Average Value
Number
Average Value
LOANS ORIGINATED
2
$78,335
16
$113,104
22
$75,118
13
$38,745
2
$78,275
3
$40,693
APPLICATIONS APPROVED, NOT ACCEPTED
0
$0
2
$89,855
3
$96,963
1
$29,950
0
$0
1
$82,100
APPLICATIONS DENIED
0
$0
3
$90,617
18
$69,828
5
$42,598
2
$73,875
3
$47,937
APPLICATIONS WITHDRAWN
0
$0
2
$78,520
14
$82,504
1
$85,800
1
$84,510
1
$53,590
FILES CLOSED FOR INCOMPLETENESS
0
$0
2
$53,330
2
$60,590
1
$15,640
0
$0
0
$0
Aggregated Statistics For Year 2003 (Based on 4 partial tracts)
A) FHA, FSA/RHS & VA Home Purchase Loans
B) Conventional Home Purchase Loans
C) Refinancings
D) Home Improvement Loans
F) Non-occupant Loans on < 5 Family Dwellings (A B C & D)
Number
Average Value
Number
Average Value
Number
Average Value
Number
Average Value
Number
Average Value
LOANS ORIGINATED
3
$94,293
12
$98,002
46
$80,199
9
$24,972
1
$33,790
APPLICATIONS APPROVED, NOT ACCEPTED
0
$0
1
$99,700
6
$57,728
1
$26,660
0
$0
APPLICATIONS DENIED
0
$0
4
$71,570
17
$80,265
4
$18,462
0
$0
APPLICATIONS WITHDRAWN
0
$0
1
$130,790
14
$74,771
2
$27,340
0
$0
FILES CLOSED FOR INCOMPLETENESS
0
$0
0
$0
2
$104,735
0
$0
0
$0
Aggregated Statistics For Year 2002 (Based on 4 partial tracts)
A) FHA, FSA/RHS & VA Home Purchase Loans
B) Conventional Home Purchase Loans
C) Refinancings
D) Home Improvement Loans
F) Non-occupant Loans on < 5 Family Dwellings (A B C & D)
Number
Average Value
Number
Average Value
Number
Average Value
Number
Average Value
Number
Average Value
LOANS ORIGINATED
2
$74,070
16
$88,068
32
$69,038
8
$27,170
1
$71,140
APPLICATIONS APPROVED, NOT ACCEPTED
0
$0
2
$39,000
3
$79,873
2
$15,200
0
$0
APPLICATIONS DENIED
1
$75,130
5
$60,406
18
$68,659
4
$11,285
1
$55,440
APPLICATIONS WITHDRAWN
0
$0
1
$117,920
13
$69,558
1
$22,760
1
$34,580
FILES CLOSED FOR INCOMPLETENESS
0
$0
1
$68,720
2
$33,885
0
$0
0
$0
Aggregated Statistics For Year 2001 (Based on 4 partial tracts)
A) FHA, FSA/RHS & VA Home Purchase Loans
B) Conventional Home Purchase Loans
C) Refinancings
D) Home Improvement Loans
F) Non-occupant Loans on < 5 Family Dwellings (A B C & D)
Number
Average Value
Number
Average Value
Number
Average Value
Number
Average Value
Number
Average Value
LOANS ORIGINATED
2
$91,920
16
$71,849
20
$70,940
10
$10,475
0
$0
APPLICATIONS APPROVED, NOT ACCEPTED
0
$0
4
$52,218
4
$72,172
1
$12,220
0
$0
APPLICATIONS DENIED
0
$0
7
$53,306
16
$55,182
4
$20,522
1
$60,680
APPLICATIONS WITHDRAWN
0
$0
1
$55,890
12
$61,839
2
$40,200
0
$0
FILES CLOSED FOR INCOMPLETENESS
0
$0
0
$0
2
$76,025
0
$0
0
$0
Aggregated Statistics For Year 2000 (Based on 4 partial tracts)
A) FHA, FSA/RHS & VA Home Purchase Loans
B) Conventional Home Purchase Loans
C) Refinancings
D) Home Improvement Loans
F) Non-occupant Loans on < 5 Family Dwellings (A B C & D)
Number
Average Value
Number
Average Value
Number
Average Value
Number
Average Value
Number
Average Value
LOANS ORIGINATED
2
$76,970
12
$85,052
14
$62,929
11
$16,478
2
$47,735
APPLICATIONS APPROVED, NOT ACCEPTED
0
$0
2
$48,445
2
$56,175
1
$29,770
0
$0
APPLICATIONS DENIED
1
$30,850
7
$42,146
10
$60,092
4
$22,430
1
$27,980
APPLICATIONS WITHDRAWN
0
$0
1
$55,970
6
$49,825
1
$21,610
0
$0
FILES CLOSED FOR INCOMPLETENESS
0
$0
0
$0
0
$0
0
$0
0
$0
Aggregated Statistics For Year 1999 (Based on 2 partial tracts)
Detailed PMIC statistics for the following Tracts:0114.00
, 0239.02
2002 - 2018 National Fire Incident Reporting System (NFIRS) incidents
Based on the data from the years 2002 - 2018 the average number of fires per year is 8. The highest number of reported fires - 16 took place in 2017, and the least - 1 in 2015. The data has a growing trend.
When looking into fire subcategories, the most incidents belonged to: Structure Fires (58.7%), and Outside Fires (21.7%).
Fire incident types reported to NFIRS in Zip Code 13431


+$2,300
-$2,666
 Nearest zip codes: 13304, 13416, 13502, 13352, 13435, 13340.


 Based on the data from the years 2002 - 2018 the average number of fires per year is 8. The highest number of reported fires - 16 took place in 2017, and the least - 1 in 2015. The data has a growing trend.
 When looking into fire subcategories, the most incidents belonged to: Structure Fires (58.7%), and Outside Fires (21.7%).