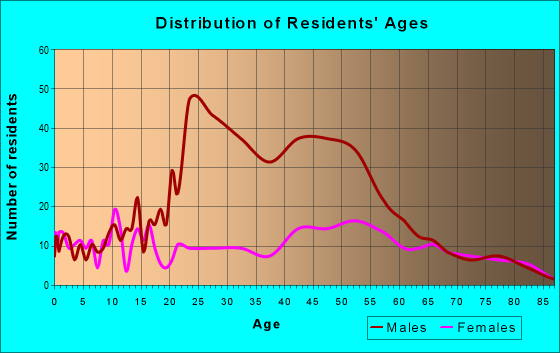
Estimated zip code population in 2022: 2,473 Zip code population in 2010: 2,742 Zip code population in 2000: 6,105
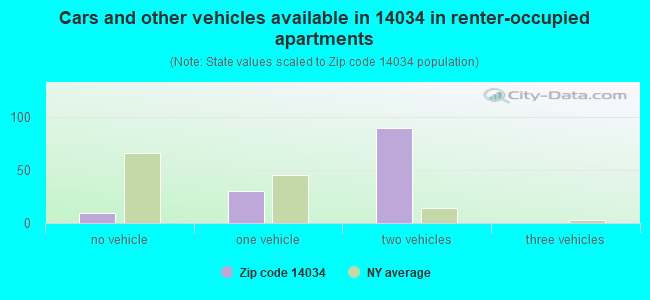
Houses and condos: 1,000 Renter-occupied apartments: 131
% of renters here:
15%
State:
46%
March 2022 cost of living index in zip code 14034: 100.1 (near average, U.S. average is 100)
Land area: 25.7 sq. mi. Water area: 0.0 sq. mi.
Population density: 96 people per square mile
(very low).
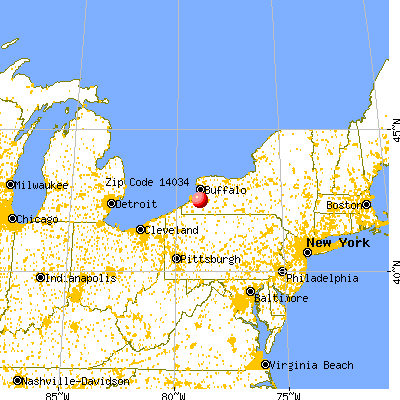
OSM Map
General Map
Google Map
MSN Map
OSM Map
General Map
Google Map
MSN Map
OSM Map
General Map
Google Map
MSN Map
OSM Map
General Map
Google Map
MSN Map
Please wait while loading the map...
Real estate property taxes paid for housing units in 2022:
This zip code:
1.2% ($1,786)
New York:
1.5% ($6,180)
Median real estate property taxes paid for housing units with mortgages in 2022: $2,690 (1.8%) Median real estate property taxes paid for housing units with no mortgage in 2022: $1,575 (1.1%)
Averages for the 2020 tax year for zip code 14034, filed in 2021:
Average Adjusted Gross Income (AGI) in 2020: $54,780 (Individual Income Tax Returns)
Here:
$54,780
State:
$90,930
Salary/wage: $45,901 (reported on 78.4% of returns)
Here:
$45,901
State:
$72,104
(% of AGI for various income ranges: 1070.7% for AGIs below $25k, 3300.0% for AGIs $25k-50k, 5878.3% for AGIs $50k-75k, 6844.3% for AGIs $75k-100k, 14113.7% for AGIs $100k-200k)
Taxable interest for individuals: $559 (reported on 36.4% of returns)
This zip code:
$559
New York:
$3,075
(% of AGI for various income ranges: 8.0% for AGIs below $25k, 32.4% for AGIs $25k-50k, 10.0% for AGIs $50k-75k, 25.7% for AGIs $75k-100k, 86.2% for AGIs $100k-200k)
Ordinary dividends: $2,028 (reported on 20.5% of returns)
Here:
$2,028
State:
$11,095
(% of AGI for various income ranges: 72.0% for AGIs below $25k, 30.5% for AGIs $25k-50k, 20.0% for AGIs $50k-75k, 64.3% for AGIs $75k-100k, 155.0% for AGIs $100k-200k)
Net capital gain/loss in AGI: +$4,892 (reported on 13.6% of returns)
Here:
+$4,892
State:
+$44,925
(% of AGI for various income ranges: 47.6% for AGIs $25k-50k, 102.5% for AGIs $50k-75k, 455.0% for AGIs $100k-200k)
Profit/loss from business: +$7,875 (reported on 9.1% of returns)
Here:
+$7,875
State:
+$14,940
(% of AGI for various income ranges: 78.7% for AGIs below $25k, 282.5% for AGIs $50k-75k, 216.2% for AGIs $100k-200k)
Taxable individual retirement arrangement distribution: $14,811 (reported on 10.2% of returns)
14034:
$14,811
New York:
$19,609
(% of AGI for various income ranges: 104.3% for AGIs $25k-50k, 297.5% for AGIs $50k-75k, 946.2% for AGIs $100k-200k)
Earned income credit: $2,225 (reported on 9.1% of returns)
Here:
$2,225
State:
$2,138
(% of AGI for various income ranges: 52.0% for AGIs below $25k, 47.6% for AGIs $25k-50k)
Percentage of individuals using paid preparers for their 2020 taxes: 96.6%
Here:
97%
State:
95%
(% for various income ranges: 87.5% for AGIs below $25k, 100.0% for AGIs $25k-50k, 100.0% for AGIs $50k-75k, 100.0% for AGIs $75k-100k, 100.0% for AGIs $100k-200k)
Averages for the 2012 tax year for zip code 14034, filed in 2013:
Average Adjusted Gross Income (AGI) in 2012: $44,321 (Individual Income Tax Returns)
Here:
$44,321
State:
$77,088
Salary/wage: $37,782 (reported on 85.1% of returns)
Here:
$37,782
State:
$60,593
(% of AGI for various income ranges: 72.6% for AGIs below $25k, 72.9% for AGIs $25k-50k, 76.3% for AGIs $50k-75k, 63.6% for AGIs $75k-100k, 75.6% for AGIs $100k-200k)
Taxable interest for individuals: $624 (reported on 37.9% of returns)
This zip code:
$624
New York:
$3,125
(% of AGI for various income ranges: 1.5% for AGIs below $25k, 0.5% for AGIs $25k-50k, 0.2% for AGIs $50k-75k, 0.4% for AGIs $75k-100k, 0.5% for AGIs $100k-200k)
Ordinary dividends: $2,100 (reported on 20.7% of returns)
Here:
$2,100
State:
$10,299
(% of AGI for various income ranges: 2.0% for AGIs below $25k, 1.4% for AGIs $25k-50k, 0.4% for AGIs $50k-75k, 1.7% for AGIs $75k-100k, 0.2% for AGIs $100k-200k)
Net capital gain/loss in AGI: +$864 (reported on 12.6% of returns)
Here:
+$864
State:
+$42,474
(% of AGI for various income ranges: 0.3% for AGIs below $25k, 0.4% for AGIs $25k-50k, 4.0% for AGIs $50k-75k, 0.7% for AGIs $75k-100k)
Profit/loss from business: +$3,360 (reported on 11.5% of returns)
Here:
+$3,360
State:
+$16,168
(% of AGI for various income ranges: 2.0% for AGIs below $25k, 2.5% for AGIs $25k-50k, 0.5% for AGIs $50k-75k)
Taxable individual retirement arrangement distribution: $9,440 (reported on 11.5% of returns)
14034:
$9,440
New York:
$17,621
(% of AGI for various income ranges: 3.9% for AGIs below $25k, 1.7% for AGIs $25k-50k, 1.9% for AGIs $50k-75k, 6.1% for AGIs $75k-100k)
Total itemized deductions: $16,056 (20% of AGI, reported on 20.7% of returns)
Here:
$16,056
State:
$34,985
Here:
20.0% of AGI
State:
21.3% of AGI
(% of AGI for various income ranges: 6.5% for AGIs $25k-50k, 7.7% for AGIs $50k-75k, 6.5% for AGIs $75k-100k, 12.4% for AGIs $100k-200k)
Charity contributions: $2,540 (reported on 17.2% of returns)
Here:
$2,540
State:
$5,572
(% of AGI for various income ranges: 0.6% for AGIs $25k-50k, 0.9% for AGIs $50k-75k, 1.5% for AGIs $75k-100k, 1.4% for AGIs $100k-200k)
Taxes paid: $7,061 (reported on 20.7% of returns)
14034:
$7,061
State:
$18,656
(% of AGI for various income ranges: 2.4% for AGIs $25k-50k, 3.0% for AGIs $50k-75k, 2.8% for AGIs $75k-100k, 6.3% for AGIs $100k-200k)
Earned income credit: $2,483 (reported on 13.8% of returns)
Here:
$2,483
State:
$2,230
(% of AGI for various income ranges: 5.0% for AGIs below $25k, 1.1% for AGIs $25k-50k)
Percentage of individuals using paid preparers for their 2012 taxes: 65.5%
Here:
66%
State:
66%
(% for various income ranges: 66.7% for AGIs below $25k, 63.6% for AGIs $25k-50k, 62.5% for AGIs $50k-75k, 66.7% for AGIs $75k-100k, 71.4% for AGIs $100k-200k)
Averages for the 2004 tax year for zip code 14034, filed in 2005:
Average Adjusted Gross Income (AGI) in 2004: $38,461 (Individual Income Tax Returns)
Here:
$38,461
State:
$59,519
Salary/wage: $35,446 (reported on 83.4% of returns)
Here:
$35,446
State:
$50,673
(% of AGI for various income ranges: 91.9% for AGIs below $10k, 64.0% for AGIs $10k-25k, 78.9% for AGIs $25k-50k, 77.1% for AGIs $50k-75k, 81.3% for AGIs $75k-100k, 72.4% for AGIs over 100k)
Taxable interest for individuals: $720 (reported on 58.3% of returns)
This zip code:
$720
New York:
$2,377
(% of AGI for various income ranges: 2.6% for AGIs below $10k, 3.5% for AGIs $10k-25k, 1.2% for AGIs $25k-50k, 0.7% for AGIs $50k-75k, 0.5% for AGIs $75k-100k, 0.7% for AGIs over 100k)
Taxable dividends: $1,257 (reported on 25.5% of returns)
Here:
$1,257
State:
$5,394
(% of AGI for various income ranges: 5.0% for AGIs below $10k, 1.7% for AGIs $10k-25k, 0.9% for AGIs $25k-50k, 0.8% for AGIs $50k-75k, 0.3% for AGIs $75k-100k, 0.5% for AGIs over 100k)
Net capital gain/loss: +$1,378 (reported on 16.5% of returns)
Here:
+$1,378
State:
+$23,581
(% of AGI for various income ranges: 0.3% for AGIs $10k-25k, 1.5% for AGIs $25k-50k, 0.7% for AGIs $50k-75k, -0.1% for AGIs $75k-100k)
Profit/loss from business: +$5,505 (reported on 10.7% of returns)
Here:
+$5,505
State:
+$13,809
(% of AGI for various income ranges: 4.6% for AGIs $10k-25k, 3.5% for AGIs $25k-50k, 0.7% for AGIs $50k-75k, -0.5% for AGIs $75k-100k)
IRA payment deduction: $2,938 (reported on 1.8% of returns)
14034:
$2,938
New York:
$3,115
Total itemized deductions: $15,108 (23% of AGI, reported on 25.7% of returns)
Here:
$15,108
State:
$25,864
Here:
22.7% of AGI
State:
21.9% of AGI
(% of AGI for various income ranges: 5.7% for AGIs $10k-25k, 9.3% for AGIs $25k-50k, 9.6% for AGIs $50k-75k, 11.5% for AGIs $75k-100k, 14.8% for AGIs over 100k)
Charity contributions deductions: $2,270 (3% of AGI, reported on 23.5% of returns)
Here:
$2,270
State:
$4,439
Here:
3.4% of AGI
State:
3.6% of AGI
(% of AGI for various income ranges: 0.3% for AGIs $10k-25k, 0.9% for AGIs $25k-50k, 2.0% for AGIs $50k-75k, 1.5% for AGIs $75k-100k, 2.3% for AGIs over 100k)
Total tax: $4,306 (reported on 76.1% of returns)
14034:
$4,306
State:
$11,730
(% of AGI for various income ranges: 2.1% for AGIs below $10k, 4.0% for AGIs $10k-25k, 6.6% for AGIs $25k-50k, 8.3% for AGIs $50k-75k, 9.6% for AGIs $75k-100k, 15.3% for AGIs over 100k)
Earned income credit: $1,431 (reported on 12.5% of returns)
Here:
$1,431
State:
$1,757
Percentage of individuals using paid preparers for their 2004 taxes: 62.6%
Here:
63%
State:
67%
(% for various income ranges: 52.9% for AGIs below $10k, 63.6% for AGIs $10k-25k, 66.0% for AGIs $25k-50k, 64.1% for AGIs $50k-75k, 68.5% for AGIs $75k-100k, 53.1% for AGIs over 100k)
Household received Food Stamps/SNAP in the past 12 months: 60 Household did not receive Food Stamps/SNAP in the past 12 months: 825
Women who had a birth in the past 12 months: 6 (6 now married, 0 unmarried) Women who did not have a birth in the past 12 months: 299 (158 now married, 138 unmarried)
Housing units in zip code 14034 with a mortgage: 312 (41 second mortgage, 42 both second mortgage and home equity loan) Houses without a mortgage: 18
Median monthly owner costs for units with a mortgage: $1,301 Median monthly owner costs for units without a mortgage: $422
Residents with income below the poverty level in 2022:
This zip code:
6.0%
Whole state:
14.3%
Residents with income below 50% of the poverty level in 2022:
This zip code:
4.8%
Whole state:
6.8%
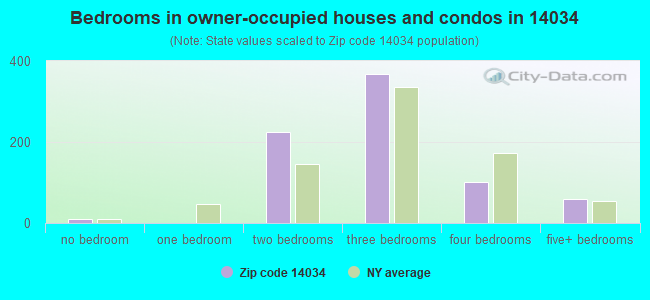
Median number of rooms in houses and condos:
Here:
6.0
State:
6.3
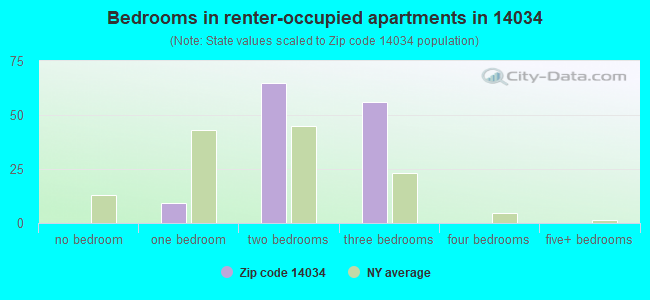
Median number of rooms in apartments:
Here:
5.3
State:
3.8
Notable locations in this zip code not listed on our city pages
Notable locations in zip code 14034: Gowanda Country Club (A), Whites Corners (B), Farner Farms (C), Collins Fire Company (D), Collins Center Fire Company (E), Collins Town Hall (F), Collins Public Library (G). Display/hide their locations on the map
In group quarters: 588 (-1 institutionalized population)
Size of family households: 281 2-persons, 141 3-persons, 36 4-persons, 18 5-persons, 27 6-persons, 22 7-or-more-persons
Size of nonfamily households: 366 1-person, 4 2-persons
272 married couples with children.
36 single-parent households (36 women).
94.2% of residents of 14034 zip code speak English at home.
2.7% of residents speak Spanish at home (89% very well, 8% well, 3% not well).
1.0% of residents speak other Indo-European language at home (46% very well, 54% not well).
1.9% of residents speak Asian or Pacific Island language at home (100% very well).
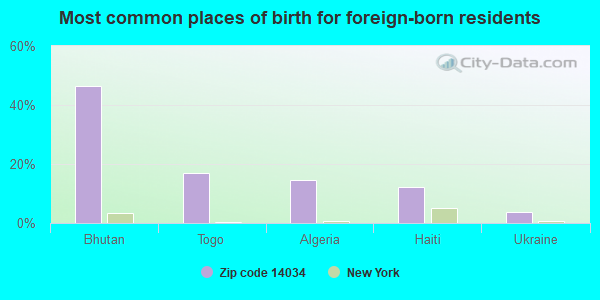
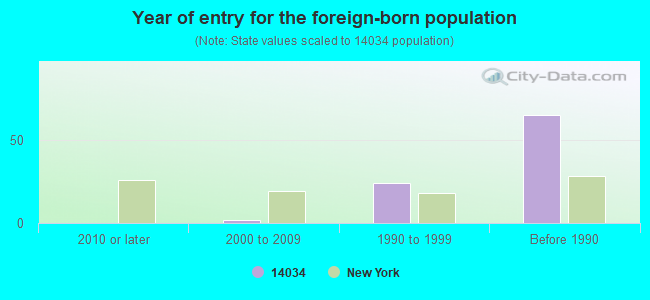
Foreign born population: 81 (3.3%) (57.9% of them are naturalized citizens)
This zip code:
3.3%
Whole state:
22.7%
46%Bhutan
17%Togo
15%Algeria
12%Haiti
4%Ukraine
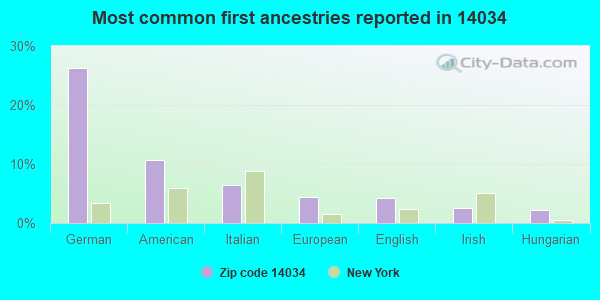
26%German
11%American
6%Italian
4%European
4%English
3%Irish
2%Hungarian
Year of entry for the foreign-born population
02010 or later
22000 to 2009
241990 to 1999
65Before 1990
Facilities with environmental interests located in this zip code:
COLLINS/GOWANDA CORRECTIONAL FACILITY (MIDDLE ROAD in COLLINS, NY)
AIR SYNTHETIC MINOR (AIRS/AFS) STATE MASTER (New York facility tracking) - REFUSE DISPOSAL, AIR PROGRAM, GRANTS AND PLANNING, National Pollutant Discharge Elimination System Permit CRITERIA AND HAZARDOUS AIR POLLUTANT INVENTORY (Inventory of air pollution sources) (Resource Conservation and Recovery Act (tracking hazardous waste)) COMMUNITY WATER SYSTEM (SDWIS) - SDWIS-NY1415379 11656, WATER TREATMENT PLANT TRI REPORTER (Tracking of toxic chemicals releasing facilities) Business SIC classification: PSYCHIATRIC HOSPITALS; CORRECTIONAL INSTITUTIONS Organizations: NYS DEPT OF CORRECTIONAL SERVICES, NYS OFFICE OF MENTAL HEALTH (LEGALLY RESPONSIBLE PARTY)
, NYS OFFICE OF GENERAL SERVICES (WATER PERMITTING FACILITY OWNER CONTACT)
Alternative names: COLLINS CORRECTIONAL FACILITY, NYS COLLINS CORRECTIONAL FACILITY
AIR MINOR (AIRS/AFS) AIR SYNTHETIC MINOR (AIRS/AFS) STATE MASTER (New York facility tracking) - MINE OPERATING PERMIT, AIR PROGRAM, CRITERIA AND HAZARDOUS AIR POLLUTANT INVENTORY (Inventory of air pollution sources) Conditionally Exempt Small Quantity Generators, less than 100 kg/month of hazardous waste (Resource Conservation and Recovery Act (tracking hazardous waste)) - notification Business SIC and NAICS classification: CONSTRUCTION SAND AND GRAVEL Organizations: GERNATT ASPHALT PRODUCTS INC (CONTACT/OWNER)
Alternative names: GERNATT ASPHALT PRODUCTS INC COLLIN, GERNATT ASPHALT PRODUCTS - COLLINS
COLLINS CORR CTR ( in COLLINS, NY)
(National Center for Education Statistics) - STATE ID-042801968912 Organizations: GOWANDA CSD (SCHOOL DISTRICT)
GOWANDA PSYCHIATRIC CENTER (RTE 62 in HELMUTH, NY)
(Resource Conservation and Recovery Act (tracking hazardous waste))
Housing units lacking complete plumbing facilities: 0.6% Housing units lacking complete kitchen facilities: 3.0%
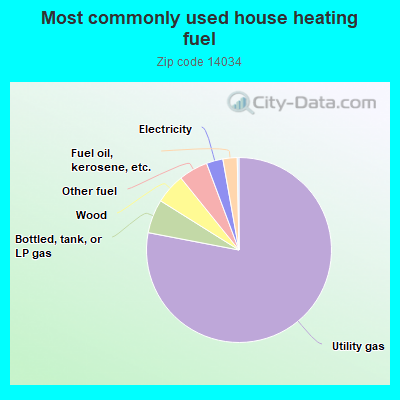
78.1%Utility gas
5.9%Bottled, tank, or LP gas
5.3%Wood
5.1%Other fuel
2.9%Electricity
2.5%Fuel oil, kerosene, etc.
Population in 1990: 2,194. Population change in the 1990s: +3,911 (+178.3%).
Place of birth for U.S.-born residents:
This state: 2,108
Northeast: 70
Midwest: 10
South: 121
West: 57
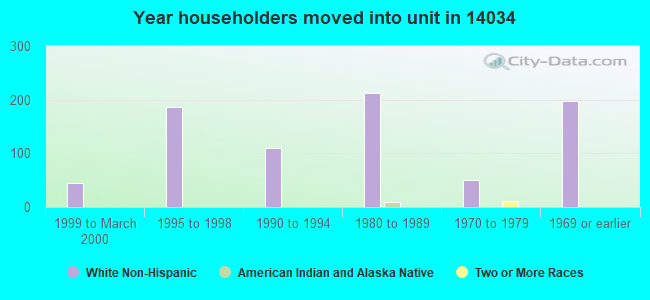
44% of the 14034 zip code residents lived in the same house 5 years ago. Out of people who lived in different houses, 18% lived in this county. Out of people who lived in different counties, 50% lived in New York.
88% of the 14034 zip code residents lived in the same house 1 year ago. Out of people who lived in different houses, 73% moved from this county. Out of people who lived in different houses, 24% moved from different county within same state.
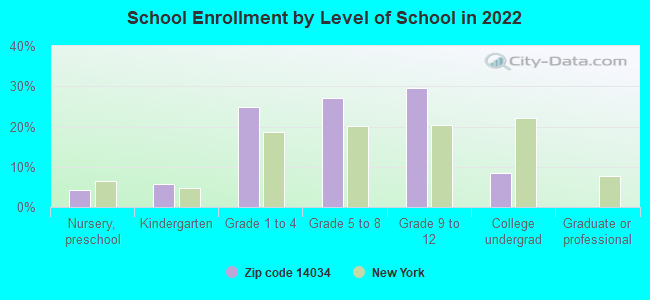
Private vs. public school enrollment:
Students in private schools in grades 1 to 8 (elementary and middle school): 52
Here:
23.8%
New York:
15.6%
Students in private schools in grades 9 to 12 (high school): 5
Here:
4.4%
New York:
15.0%
Students in private undergraduate colleges:
Here:
0.0%
New York:
39.2%
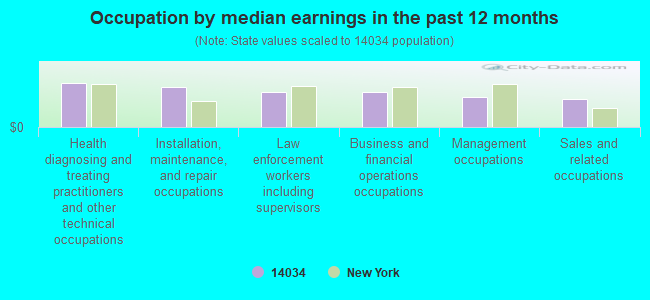
Occupation by median earnings in the past 12 months ($)
106,798Health diagnosing and treating practitioners and other technical occupations
98,100Installation, maintenance, and repair occupations
85,633Law enforcement workers including supervisors
84,288Business and financial operations occupations
73,231Management occupations
66,765Sales and related occupations
Companies with federal contracts located in this zip code:
T P S UTILICOM SERVICES, INC. (RICHARDSON RD in COLLINS, NY) 4 employees, $410000 revenue
$33,000 with Department of Veterans Affairs for Fuel Oils. Signed on 2001-02-15. Completion date: 2001-02-15.
Top industries in this zip code by the number of employees in 2005:
Management of Companies and Enterprises: Corporate, Subsidiary, and Regional Managing Offices (50-99 employees: 1 establishment)
Mining: Construction Sand and Gravel Mining (10-19: 1)
Health Care and Social Assistance: Other Individual and Family Services (5-9: 1, 1-4: 1)
Educational Services: Elementary and Secondary Schools (5-9: 1)
Arts, Entertainment, and Recreation: Golf Courses and Country Clubs (5-9: 1)
Construction: Site Preparation Contractors (5-9: 1)
People in group quarters in 2010:
960 people in state prisons
4 people in group homes intended for adults
People in group quarters in 2000:
3,828 people in state prisons
22 people in homes for the mentally ill
12 people in homes or halfway houses for drug/alcohol abuse
Home Mortgage Disclosure Act Aggregated Statistics For Year 2009 (Based on 4 partial tracts)
A) FHA, FSA/RHS & VA Home Purchase Loans
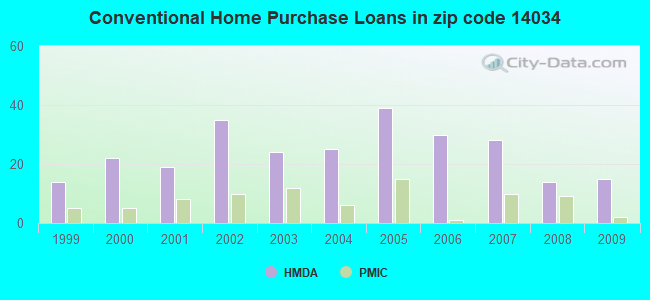
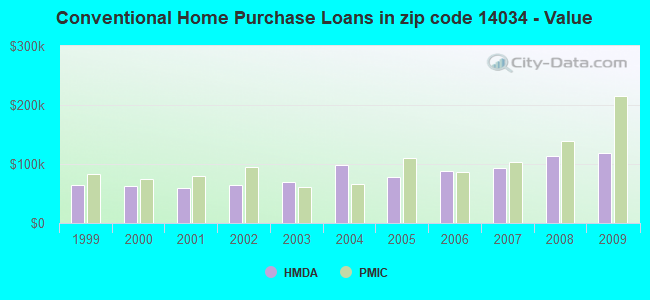
B) Conventional Home Purchase Loans
C) Refinancings
D) Home Improvement Loans
F) Non-occupant Loans on < 5 Family Dwellings (A B C & D)
G) Loans On Manufactured Home Dwelling (A B C & D)
Number
Average Value
Number
Average Value
Number
Average Value
Number
Average Value
Number
Average Value
Number
Average Value
LOANS ORIGINATED
13
$86,345
15
$117,957
36
$126,422
17
$35,192
2
$260,950
8
$87,079
APPLICATIONS APPROVED, NOT ACCEPTED
1
$212,920
0
$0
12
$93,733
2
$91,995
0
$0
1
$11,570
APPLICATIONS DENIED
6
$92,577
2
$211,770
14
$96,626
12
$50,145
0
$0
5
$71,746
APPLICATIONS WITHDRAWN
3
$184,767
2
$196,725
13
$138,888
0
$0
0
$0
0
$0
FILES CLOSED FOR INCOMPLETENESS
0
$0
1
$289,300
2
$123,240
0
$0
0
$0
0
$0
Aggregated Statistics For Year 2008 (Based on 4 partial tracts)
A) FHA, FSA/RHS & VA Home Purchase Loans
B) Conventional Home Purchase Loans
C) Refinancings
D) Home Improvement Loans
F) Non-occupant Loans on < 5 Family Dwellings (A B C & D)
G) Loans On Manufactured Home Dwelling (A B C & D)
Number
Average Value
Number
Average Value
Number
Average Value
Number
Average Value
Number
Average Value
Number
Average Value
LOANS ORIGINATED
7
$90,923
14
$113,654
29
$102,108
35
$17,821
1
$329,800
2
$44,550
APPLICATIONS APPROVED, NOT ACCEPTED
2
$81,585
0
$0
8
$77,966
0
$0
0
$0
0
$0
APPLICATIONS DENIED
0
$0
5
$56,702
25
$122,478
6
$18,902
1
$4,630
1
$63,650
APPLICATIONS WITHDRAWN
0
$0
1
$28,930
22
$108,356
2
$104,150
1
$28,930
0
$0
FILES CLOSED FOR INCOMPLETENESS
0
$0
0
$0
5
$102,760
1
$47,450
0
$0
0
$0
Aggregated Statistics For Year 2007 (Based on 4 partial tracts)
A) FHA, FSA/RHS & VA Home Purchase Loans
B) Conventional Home Purchase Loans
C) Refinancings
D) Home Improvement Loans
F) Non-occupant Loans on < 5 Family Dwellings (A B C & D)
G) Loans On Manufactured Home Dwelling (A B C & D)
Number
Average Value
Number
Average Value
Number
Average Value
Number
Average Value
Number
Average Value
Number
Average Value
LOANS ORIGINATED
5
$140,946
28
$93,034
21
$87,782
32
$23,469
0
$0
1
$140,020
APPLICATIONS APPROVED, NOT ACCEPTED
0
$0
3
$237,227
17
$108,641
7
$89,104
0
$0
0
$0
APPLICATIONS DENIED
0
$0
5
$57,166
39
$130,229
16
$49,036
1
$202,510
2
$85,055
APPLICATIONS WITHDRAWN
0
$0
2
$148,120
24
$111,815
8
$37,175
1
$69,430
1
$57,860
FILES CLOSED FOR INCOMPLETENESS
0
$0
1
$64,800
15
$123,589
0
$0
0
$0
0
$0
Aggregated Statistics For Year 2006 (Based on 4 partial tracts)
A) FHA, FSA/RHS & VA Home Purchase Loans
B) Conventional Home Purchase Loans
C) Refinancings
D) Home Improvement Loans
F) Non-occupant Loans on < 5 Family Dwellings (A B C & D)
G) Loans On Manufactured Home Dwelling (A B C & D)
Number
Average Value
Number
Average Value
Number
Average Value
Number
Average Value
Number
Average Value
Number
Average Value
LOANS ORIGINATED
1
$89,100
30
$87,947
51
$84,929
29
$22,306
3
$33,173
3
$120,350
APPLICATIONS APPROVED, NOT ACCEPTED
0
$0
6
$96,240
7
$67,779
7
$49,099
0
$0
0
$0
APPLICATIONS DENIED
0
$0
12
$96,819
62
$107,055
20
$28,550
2
$34,715
1
$114,560
APPLICATIONS WITHDRAWN
1
$153,910
5
$83,662
32
$92,323
5
$63,878
0
$0
1
$32,400
FILES CLOSED FOR INCOMPLETENESS
0
$0
1
$212,920
6
$97,977
0
$0
0
$0
0
$0
Aggregated Statistics For Year 2005 (Based on 4 partial tracts)
A) FHA, FSA/RHS & VA Home Purchase Loans
B) Conventional Home Purchase Loans
C) Refinancings
D) Home Improvement Loans
F) Non-occupant Loans on < 5 Family Dwellings (A B C & D)
G) Loans On Manufactured Home Dwelling (A B C & D)
Number
Average Value
Number
Average Value
Number
Average Value
Number
Average Value
Number
Average Value
Number
Average Value
LOANS ORIGINATED
8
$88,815
39
$77,325
44
$101,676
29
$26,975
5
$33,558
3
$63,647
APPLICATIONS APPROVED, NOT ACCEPTED
0
$0
3
$91,033
17
$102,651
6
$51,495
0
$0
3
$95,663
APPLICATIONS DENIED
0
$0
9
$112,634
62
$85,570
22
$32,244
0
$0
5
$53,926
APPLICATIONS WITHDRAWN
0
$0
5
$91,882
41
$100,695
3
$287,757
1
$167,790
3
$89,490
FILES CLOSED FOR INCOMPLETENESS
0
$0
2
$97,785
15
$103,068
1
$40,500
1
$123,820
0
$0
Aggregated Statistics For Year 2004 (Based on 4 partial tracts)
A) FHA, FSA/RHS & VA Home Purchase Loans
B) Conventional Home Purchase Loans
C) Refinancings
D) Home Improvement Loans
E) Loans on Dwellings For 5+ Families
F) Non-occupant Loans on < 5 Family Dwellings (A B C & D)
G) Loans On Manufactured Home Dwelling (A B C & D)
Number
Average Value
Number
Average Value
Number
Average Value
Number
Average Value
Number
Average Value
Number
Average Value
Number
Average Value
LOANS ORIGINATED
6
$92,265
25
$98,454
36
$93,485
16
$33,848
0
$0
1
$61,330
6
$60,753
APPLICATIONS APPROVED, NOT ACCEPTED
0
$0
1
$47,500
1
$101,830
2
$56,125
0
$0
0
$0
1
$15,040
APPLICATIONS DENIED
0
$0
7
$57,311
33
$76,430
13
$17,180
1
$462,880
0
$0
3
$26,880
APPLICATIONS WITHDRAWN
0
$0
0
$0
34
$88,934
5
$51,380
0
$0
0
$0
2
$83,895
FILES CLOSED FOR INCOMPLETENESS
1
$102,990
3
$60,560
14
$99,262
1
$17,360
0
$0
0
$0
0
$0
Aggregated Statistics For Year 2003 (Based on 4 partial tracts)
A) FHA, FSA/RHS & VA Home Purchase Loans
B) Conventional Home Purchase Loans
C) Refinancings
D) Home Improvement Loans
F) Non-occupant Loans on < 5 Family Dwellings (A B C & D)
Number
Average Value
Number
Average Value
Number
Average Value
Number
Average Value
Number
Average Value
LOANS ORIGINATED
7
$81,801
24
$69,191
100
$73,662
16
$16,852
3
$46,287
APPLICATIONS APPROVED, NOT ACCEPTED
0
$0
2
$116,300
14
$102,081
3
$15,043
1
$12,730
APPLICATIONS DENIED
0
$0
6
$47,252
38
$93,703
13
$12,371
0
$0
APPLICATIONS WITHDRAWN
0
$0
0
$0
31
$99,781
0
$0
0
$0
FILES CLOSED FOR INCOMPLETENESS
0
$0
0
$0
3
$126,907
0
$0
0
$0
Aggregated Statistics For Year 2002 (Based on 4 partial tracts)
A) FHA, FSA/RHS & VA Home Purchase Loans
B) Conventional Home Purchase Loans
C) Refinancings
D) Home Improvement Loans
F) Non-occupant Loans on < 5 Family Dwellings (A B C & D)
Number
Average Value
Number
Average Value
Number
Average Value
Number
Average Value
Number
Average Value
LOANS ORIGINATED
7
$80,673
35
$63,751
43
$87,113
10
$15,044
1
$41,660
APPLICATIONS APPROVED, NOT ACCEPTED
0
$0
6
$44,552
19
$72,173
5
$18,052
1
$115,720
APPLICATIONS DENIED
1
$61,330
5
$73,598
52
$91,018
16
$12,078
0
$0
APPLICATIONS WITHDRAWN
0
$0
2
$54,390
34
$88,696
6
$26,230
1
$34,720
FILES CLOSED FOR INCOMPLETENESS
1
$74,060
1
$70,590
3
$97,203
0
$0
0
$0
Aggregated Statistics For Year 2001 (Based on 4 partial tracts)
A) FHA, FSA/RHS & VA Home Purchase Loans
B) Conventional Home Purchase Loans
C) Refinancings
D) Home Improvement Loans
F) Non-occupant Loans on < 5 Family Dwellings (A B C & D)
Number
Average Value
Number
Average Value
Number
Average Value
Number
Average Value
Number
Average Value
LOANS ORIGINATED
7
$57,364
19
$59,322
61
$68,443
16
$13,959
3
$40,887
APPLICATIONS APPROVED, NOT ACCEPTED
0
$0
9
$63,903
17
$63,442
2
$34,715
1
$59,020
APPLICATIONS DENIED
0
$0
8
$71,024
49
$71,060
19
$12,120
2
$37,610
APPLICATIONS WITHDRAWN
0
$0
1
$63,780
42
$72,022
6
$16,780
0
$0
FILES CLOSED FOR INCOMPLETENESS
0
$0
0
$0
2
$42,240
1
$11,570
0
$0
Aggregated Statistics For Year 2000 (Based on 4 partial tracts)
A) FHA, FSA/RHS & VA Home Purchase Loans
B) Conventional Home Purchase Loans
C) Refinancings
D) Home Improvement Loans
F) Non-occupant Loans on < 5 Family Dwellings (A B C & D)
Number
Average Value
Number
Average Value
Number
Average Value
Number
Average Value
Number
Average Value
LOANS ORIGINATED
7
$72,739
22
$62,926
22
$61,542
19
$9,806
1
$43,970
APPLICATIONS APPROVED, NOT ACCEPTED
0
$0
6
$57,667
10
$46,172
9
$8,872
1
$89,100
APPLICATIONS DENIED
1
$40,500
15
$61,717
35
$44,937
11
$7,446
1
$11,570
APPLICATIONS WITHDRAWN
0
$0
5
$43,974
12
$46,673
3
$32,787
0
$0
FILES CLOSED FOR INCOMPLETENESS
0
$0
0
$0
6
$63,067
0
$0
0
$0
Aggregated Statistics For Year 1999 (Based on 2 partial tracts)
A) FHA, FSA/RHS & VA Home Purchase Loans
B) Conventional Home Purchase Loans
C) Refinancings
D) Home Improvement Loans
F) Non-occupant Loans on < 5 Family Dwellings (A B C & D)
Detailed PMIC statistics for the following Tracts:0160.02
2002 - 2018 National Fire Incident Reporting System (NFIRS) incidents
Based on the data from the years 2002 - 2018 the average number of fire incidents per year is 9. The highest number of fire incidents - 18 took place in 2011, and the least - 3 in 2014. The data has a constant trend.
When looking into fire subcategories, the most incidents belonged to: Structure Fires (49.3%), and Outside Fires (23.7%).
Fire incident types reported to NFIRS in Zip Code 14034


 Nearest zip codes: 14035, 14091, 14070, 14111, 14168, 14041.


 Based on the data from the years 2002 - 2018 the average number of fire incidents per year is 9. The highest number of fire incidents - 18 took place in 2011, and the least - 3 in 2014. The data has a constant trend.
 When looking into fire subcategories, the most incidents belonged to: Structure Fires (49.3%), and Outside Fires (23.7%).