Estimated zip code population in 2022: 4,148 Zip code population in 2010: 4,330 Zip code population in 2000: 4,727
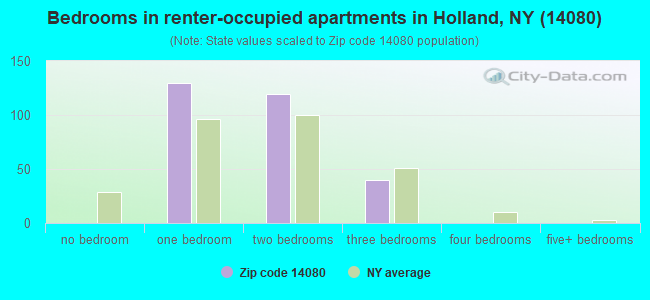
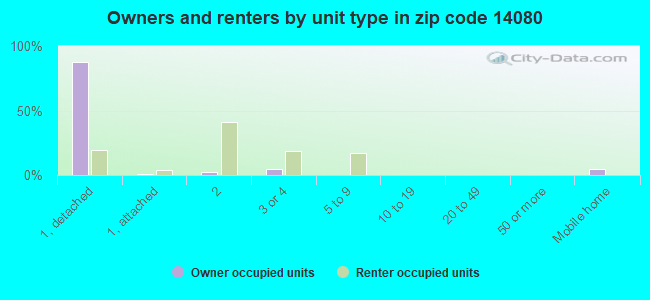
Houses and condos: 1,949 Renter-occupied apartments: 291
% of renters here:
16%
State:
46%
March 2022 cost of living index in zip code 14080: 95.7 (near average, U.S. average is 100)
Land area: 52.9 sq. mi. Water area: 0.1 sq. mi.
Population density: 78 people per square mile
(very low).
OSM Map
General Map
Google Map
MSN Map
OSM Map
General Map
Google Map
MSN Map
OSM Map
General Map
Google Map
MSN Map
OSM Map
General Map
Google Map
MSN Map
Please wait while loading the map...
Real estate property taxes paid for housing units in 2022:
This zip code:
1.5% ($3,774)
New York:
1.5% ($6,180)
Median real estate property taxes paid for housing units with mortgages in 2022: $4,056 (1.5%) Median real estate property taxes paid for housing units with no mortgage in 2022: $3,198 (1.5%)
Business Search- 14 Million verified businesses
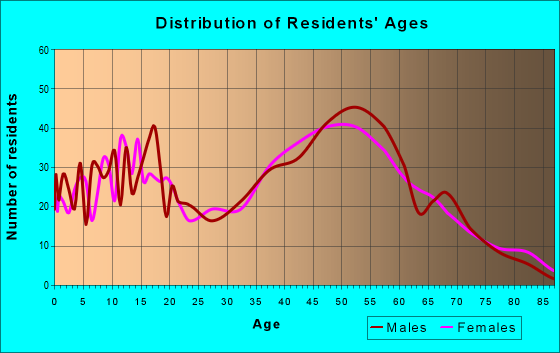
Males: 2,143
(51.7%)
Females: 2,005
(48.3%)
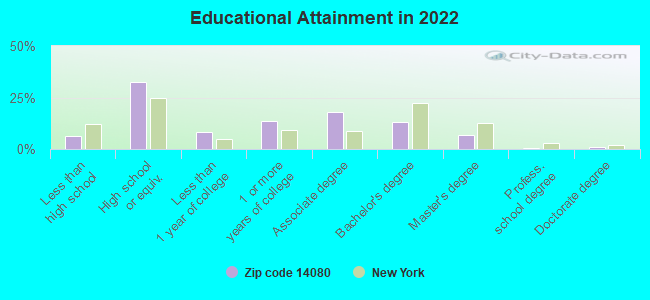
For population 25 years and over in 14080:
High school or higher: 93.4%
Bachelor's degree or higher: 21.4%
Graduate or professional degree: 8.6%
Unemployed: 3.5%
Mean travel time to work (commute): 29.9 minutes
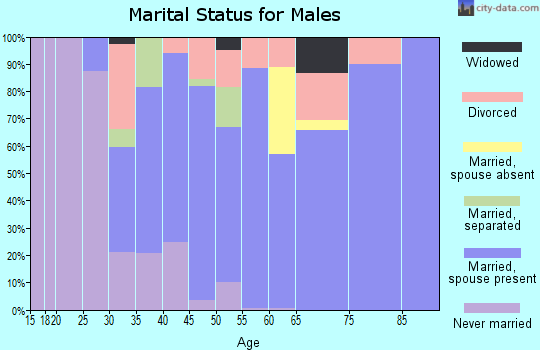
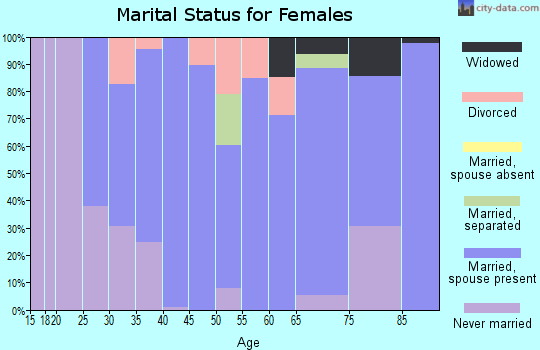
For population 15 years and over in 14080:
Never married: 27.2%
Now married: 55.2%
Separated: 0.9%
Widowed: 5.1%
Divorced: 11.6%
Zip code 14080 compared to state average:
Median house value below state average.
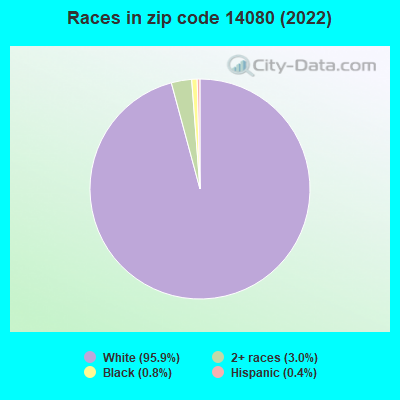
Black race population percentage significantly below state average.
Hispanic race population percentage significantly below state average.
Median age above state average.
Foreign-born population percentage significantly below state average.
Renting percentage significantly below state average.
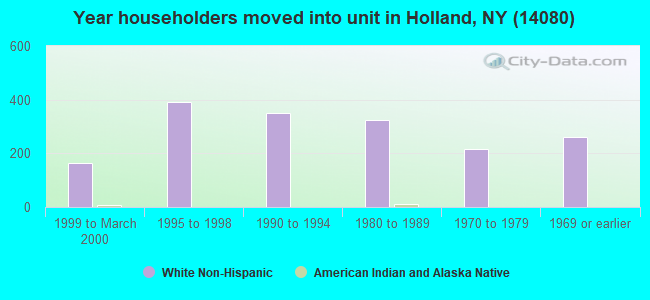
Length of stay since moving in significantly above state average.
Number of college students below state average.
Percentage of population with a bachelor's degree or higher below state average.
Estimated median house/condo value in 2022: $245,911
14080:
$245,911
New York:
$400,400
According to our research of New York and other state lists, there was 1 registered sex offender living in 14080 zip code as of April 27, 2024. The ratio of all residents to sex offenders in zip code 14080 is 4,309 to 1. The ratio of registered sex offenders to all residents in this zip code is much lower than the state average.
Median resident age:
This zip code:
46.1 years
New York median age:
40.0 years
Average household size:
This zip code:
2.2 people
New York:
2.5 people
Averages for the 2020 tax year for zip code 14080, filed in 2021:
Average Adjusted Gross Income (AGI) in 2020: $67,230 (Individual Income Tax Returns)
Here:
$67,230
State:
$90,930
Salary/wage: $59,945 (reported on 81.3% of returns)
Here:
$59,945
State:
$72,104
(% of AGI for various income ranges: 1104.6% for AGIs below $25k, 3485.7% for AGIs $25k-50k, 5943.3% for AGIs $50k-75k, 9576.5% for AGIs $75k-100k, 16152.3% for AGIs $100k-200k)
Taxable interest for individuals: $828 (reported on 43.0% of returns)
This zip code:
$828
New York:
$3,075
(% of AGI for various income ranges: 10.0% for AGIs below $25k, 20.5% for AGIs $25k-50k, 29.3% for AGIs $50k-75k, 95.9% for AGIs $75k-100k, 119.2% for AGIs $100k-200k)
Ordinary dividends: $3,488 (reported on 23.4% of returns)
Here:
$3,488
State:
$11,095
(% of AGI for various income ranges: 33.8% for AGIs below $25k, 55.1% for AGIs $25k-50k, 43.3% for AGIs $50k-75k, 187.6% for AGIs $75k-100k, 136.9% for AGIs $100k-200k)
Net capital gain/loss in AGI: +$8,122 (reported on 17.3% of returns)
Here:
+$8,122
State:
+$44,925
(% of AGI for various income ranges: 19.5% for AGIs below $25k, 14.3% for AGIs $25k-50k, 94.4% for AGIs $50k-75k, 228.2% for AGIs $75k-100k, 327.3% for AGIs $100k-200k)
Profit/loss from business: +$13,831 (reported on 12.1% of returns)
Here:
+$13,831
State:
+$14,940
(% of AGI for various income ranges: 61.1% for AGIs below $25k, 157.8% for AGIs $25k-50k, 98.5% for AGIs $50k-75k, 289.4% for AGIs $75k-100k, 780.0% for AGIs $100k-200k)
Taxable individual retirement arrangement distribution: $15,378 (reported on 10.7% of returns)
14080:
$15,378
New York:
$19,609
(% of AGI for various income ranges: 95.7% for AGIs below $25k, 154.6% for AGIs $25k-50k, 173.0% for AGIs $50k-75k, 344.1% for AGIs $75k-100k, 599.6% for AGIs $100k-200k)
Total itemized deductions: $22,373 (reported on 5.1% of returns)
Here:
$22,373
State:
$39,326
(% of AGI for various income ranges: 287.4% for AGIs $50k-75k, 296.5% for AGIs $75k-100k, 454.2% for AGIs $100k-200k)
Charity contributions: $4,088 (reported on 3.7% of returns)
Here:
$4,088
State:
$15,420
(% of AGI for various income ranges: 29.3% for AGIs $50k-75k, 95.4% for AGIs $100k-200k)
Taxes paid: $8,391 (reported on 5.1% of returns)
14080:
$8,391
State:
$9,183
(% of AGI for various income ranges: 93.7% for AGIs $50k-75k, 125.9% for AGIs $75k-100k, 175.4% for AGIs $100k-200k)
Earned income credit: $1,882 (reported on 7.9% of returns)
Here:
$1,882
State:
$2,138
(% of AGI for various income ranges: 51.1% for AGIs below $25k, 35.4% for AGIs $25k-50k)
Percentage of individuals using paid preparers for their 2020 taxes: 95.3%
Here:
95%
State:
95%
(% for various income ranges: 94.5% for AGIs below $25k, 96.0% for AGIs $25k-50k, 94.4% for AGIs $50k-75k, 96.2% for AGIs $75k-100k, 95.1% for AGIs $100k-200k, 100.0% for AGIs over 200k)
Averages for the 2012 tax year for zip code 14080, filed in 2013:
Average Adjusted Gross Income (AGI) in 2012: $60,100 (Individual Income Tax Returns)
Here:
$60,100
State:
$77,088
Salary/wage: $49,299 (reported on 83.5% of returns)
Here:
$49,299
State:
$60,593
(% of AGI for various income ranges: 68.1% for AGIs below $25k, 74.0% for AGIs $25k-50k, 72.4% for AGIs $50k-75k, 80.4% for AGIs $75k-100k, 81.7% for AGIs $100k-200k, 27.3% for AGIs over 200k)
Taxable interest for individuals: $843 (reported on 47.6% of returns)
This zip code:
$843
New York:
$3,125
(% of AGI for various income ranges: 1.2% for AGIs below $25k, 0.7% for AGIs $25k-50k, 0.5% for AGIs $50k-75k, 0.3% for AGIs $75k-100k, 0.8% for AGIs $100k-200k, 0.8% for AGIs over 200k)
Ordinary dividends: $2,964 (reported on 25.0% of returns)
Here:
$2,964
State:
$10,299
(% of AGI for various income ranges: 1.6% for AGIs below $25k, 1.2% for AGIs $25k-50k, 0.8% for AGIs $50k-75k, 0.5% for AGIs $75k-100k, 1.5% for AGIs $100k-200k, 1.9% for AGIs over 200k)
Net capital gain/loss in AGI: +$5,521 (reported on 16.0% of returns)
Here:
+$5,521
State:
+$42,474
(% of AGI for various income ranges: 0.8% for AGIs below $25k, 0.8% for AGIs $50k-75k, 1.0% for AGIs $75k-100k, 0.5% for AGIs $100k-200k, 5.6% for AGIs over 200k)
Profit/loss from business: +$12,736 (reported on 13.2% of returns)
Here:
+$12,736
State:
+$16,168
(% of AGI for various income ranges: 5.0% for AGIs below $25k, 4.3% for AGIs $25k-50k, 3.7% for AGIs $50k-75k, 0.4% for AGIs $75k-100k, 4.2% for AGIs $100k-200k)
Taxable individual retirement arrangement distribution: $13,050 (reported on 10.4% of returns)
14080:
$13,050
New York:
$17,621
(% of AGI for various income ranges: 3.4% for AGIs below $25k, 3.2% for AGIs $25k-50k, 2.4% for AGIs $50k-75k, 1.3% for AGIs $75k-100k, 3.4% for AGIs $100k-200k)
Total itemized deductions: $19,196 (18% of AGI, reported on 35.4% of returns)
Here:
$19,196
State:
$34,985
Here:
17.7% of AGI
State:
21.3% of AGI
(% of AGI for various income ranges: 7.5% for AGIs below $25k, 8.8% for AGIs $25k-50k, 10.9% for AGIs $50k-75k, 12.9% for AGIs $75k-100k, 14.2% for AGIs $100k-200k, 8.8% for AGIs over 200k)
Charity contributions: $2,423 (reported on 30.2% of returns)
Here:
$2,423
State:
$5,572
(% of AGI for various income ranges: 0.6% for AGIs below $25k, 0.8% for AGIs $25k-50k, 0.9% for AGIs $50k-75k, 1.3% for AGIs $75k-100k, 1.4% for AGIs $100k-200k, 1.7% for AGIs over 200k)
Taxes paid: $9,507 (reported on 35.4% of returns)
14080:
$9,507
State:
$18,656
(% of AGI for various income ranges: 1.8% for AGIs below $25k, 3.5% for AGIs $25k-50k, 4.6% for AGIs $50k-75k, 5.7% for AGIs $75k-100k, 7.7% for AGIs $100k-200k, 6.2% for AGIs over 200k)
Earned income credit: $1,819 (reported on 9.9% of returns)
Here:
$1,819
State:
$2,230
(% of AGI for various income ranges: 3.1% for AGIs below $25k, 0.7% for AGIs $25k-50k)
Percentage of individuals using paid preparers for their 2012 taxes: 64.6%
Here:
65%
State:
66%
(% for various income ranges: 60.6% for AGIs below $25k, 66.0% for AGIs $25k-50k, 69.4% for AGIs $50k-75k, 65.4% for AGIs $75k-100k, 64.3% for AGIs $100k-200k, 75.0% for AGIs over 200k)
Averages for the 2004 tax year for zip code 14080, filed in 2005:
Average Adjusted Gross Income (AGI) in 2004: $49,525 (Individual Income Tax Returns)
Here:
$49,525
State:
$59,519
Salary/wage: $40,123 (reported on 85.6% of returns)
Here:
$40,123
State:
$50,673
(% of AGI for various income ranges: 99.0% for AGIs below $10k, 72.4% for AGIs $10k-25k, 77.3% for AGIs $25k-50k, 81.4% for AGIs $50k-75k, 83.6% for AGIs $75k-100k, 47.1% for AGIs over 100k)
Taxable interest for individuals: $1,061 (reported on 58.4% of returns)
This zip code:
$1,061
New York:
$2,377
(% of AGI for various income ranges: 6.6% for AGIs below $10k, 1.6% for AGIs $10k-25k, 1.3% for AGIs $25k-50k, 0.9% for AGIs $50k-75k, 0.8% for AGIs $75k-100k, 1.4% for AGIs over 100k)
Taxable dividends: $1,424 (reported on 27.8% of returns)
Here:
$1,424
State:
$5,394
(% of AGI for various income ranges: 2.8% for AGIs below $10k, 1.2% for AGIs $10k-25k, 0.5% for AGIs $25k-50k, 1.0% for AGIs $50k-75k, 0.7% for AGIs $75k-100k, 0.7% for AGIs over 100k)
Net capital gain/loss: +$5,195 (reported on 18.9% of returns)
Here:
+$5,195
State:
+$23,581
(% of AGI for various income ranges: -2.0% for AGIs below $10k, -0.7% for AGIs $10k-25k, 0.5% for AGIs $25k-50k, 1.7% for AGIs $50k-75k, 0.9% for AGIs $75k-100k, 4.3% for AGIs over 100k)
Profit/loss from business: +$9,124 (reported on 13.3% of returns)
Here:
+$9,124
State:
+$13,809
(% of AGI for various income ranges: 4.9% for AGIs below $10k, 5.0% for AGIs $10k-25k, 3.2% for AGIs $25k-50k, 3.2% for AGIs $50k-75k, 1.4% for AGIs $75k-100k, 1.4% for AGIs over 100k)
IRA payment deduction: $2,768 (reported on 3.3% of returns)
14080:
$2,768
New York:
$3,115
Total itemized deductions: $16,396 (19% of AGI, reported on 38.5% of returns)
Here:
$16,396
State:
$25,864
Here:
18.8% of AGI
State:
21.9% of AGI
(% of AGI for various income ranges: 9.4% for AGIs $10k-25k, 11.7% for AGIs $25k-50k, 15.5% for AGIs $50k-75k, 16.3% for AGIs $75k-100k, 10.8% for AGIs over 100k)
Charity contributions deductions: $1,834 (2% of AGI, reported on 35.1% of returns)
Here:
$1,834
State:
$4,439
Here:
2.0% of AGI
State:
3.6% of AGI
(% of AGI for various income ranges: 0.7% for AGIs $10k-25k, 1.0% for AGIs $25k-50k, 1.7% for AGIs $50k-75k, 1.6% for AGIs $75k-100k, 1.2% for AGIs over 100k)
Total tax: $5,866 (reported on 79.0% of returns)
14080:
$5,866
State:
$11,730
(% of AGI for various income ranges: 2.3% for AGIs below $10k, 4.6% for AGIs $10k-25k, 6.8% for AGIs $25k-50k, 8.6% for AGIs $50k-75k, 9.6% for AGIs $75k-100k, 12.6% for AGIs over 100k)
Earned income credit: $1,510 (reported on 9.4% of returns)
Here:
$1,510
State:
$1,757
Percentage of individuals using paid preparers for their 2004 taxes: 63.1%
Here:
63%
State:
67%
(% for various income ranges: 49.8% for AGIs below $10k, 63.7% for AGIs $10k-25k, 66.5% for AGIs $25k-50k, 68.5% for AGIs $50k-75k, 64.9% for AGIs $75k-100k, 68.8% for AGIs over 100k)
Household received Food Stamps/SNAP in the past 12 months: 187 Household did not receive Food Stamps/SNAP in the past 12 months: 1,653
Women who had a birth in the past 12 months: 83 (82 now married, 0 unmarried) Women who did not have a birth in the past 12 months: 714 (296 now married, 416 unmarried)
Housing units in zip code 14080 with a mortgage: 887 (156 second mortgage, 145 both second mortgage and home equity loan) Houses without a mortgage: 68
Median monthly owner costs for units with a mortgage: $1,667 Median monthly owner costs for units without a mortgage: $584
Residents with income below the poverty level in 2022:
This zip code:
8.6%
Whole state:
14.3%
Residents with income below 50% of the poverty level in 2022:
This zip code:
4.7%
Whole state:
6.8%
Median number of rooms in houses and condos:
Here:
6.1
State:
6.3
Median number of rooms in apartments:
Here:
4.1
State:
3.8
Notable locations in this zip code not listed on our city pages
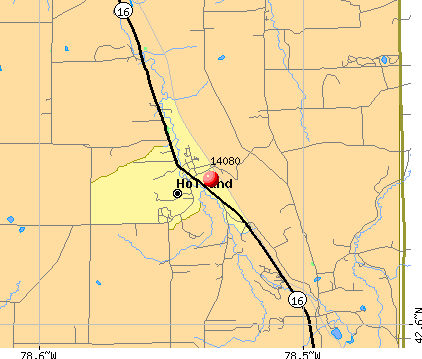
Notable locations in zip code 14080: Mountain Meadow Park Sewage Treatment Plant (A), Holland Hills Country Club (B), Kramer Farms (C), Palmer Farms (D), Camp Ti-Wa-Ya-Ee (E), Holland Fire District Station 1 (F), Holland Volunteer Fire Department (G), Colden Fire District Station (H), Holland Town Hall (I). Display/hide their locations on the map
Churches in zip code 14080 include: Hunters Creek Bible Baptist Church (A), Covenant Community Church (B), First Baptist Church of Holland (C), Holland United Methodist Church (D), Kingdom Hall of Jehovah's Witnesses (E), Saint Joseph Roman Catholic Church (F). Display/hide their locations on the map
Cemeteries: Saint Joseph Cemetery (1), Protection Cemetery (2), Humphrey Cemetery (3), Neischell Cemetery (4), Holland Cemetery (5). Display/hide their locations on the map
In group quarters: 16 (-1 institutionalized population)
Size of family households: 597 2-persons, 191 3-persons, 171 4-persons, 126 5-persons, 39 6-persons
Size of nonfamily households: 651 1-person, 74 2-persons, 6 4-persons
485 married couples with children.
144 single-parent households (24 men, 120 women).
98.6% of residents of 14080 zip code speak English at home.
0.7% of residents speak Spanish at home (100% very well).
0.5% of residents speak other Indo-European language at home (50% very well, 50% well).
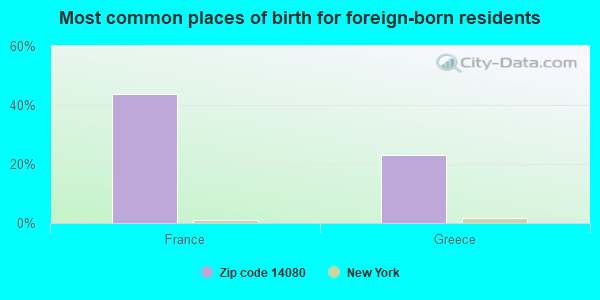
Foreign born population: 39 (1.0%) (66.2% of them are naturalized citizens)
This zip code:
1.0%
Whole state:
22.7%
44%France
23%Greece
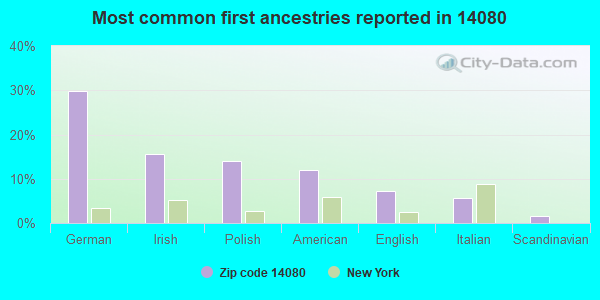
30%German
16%Irish
14%Polish
12%American
7%English
6%Italian
2%Scandinavian
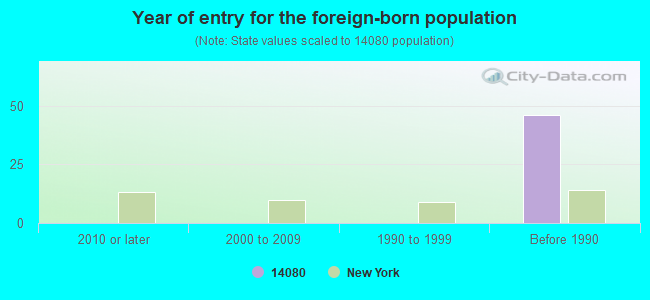
Year of entry for the foreign-born population
02010 or later
02000 to 2009
01990 to 1999
46Before 1990
Facilities with environmental interests located in this zip code:
HOLLAND SR HIGH SCHOOL (103 CANADA ST in HOLLAND, NY)
AIR MINOR (AIRS/AFS) STATE MASTER (New York facility tracking) - AIR PROGRAM (Resource Conservation and Recovery Act (tracking hazardous waste)) Business SIC and NAICS classification: ELEMENTARY AND SECONDARY SCHOOLS Organizations: HOLLAND CTL SCH DIST (AIR PERMITTING FACILITY OWNER CONTACT)
Alternative names: HOLLAND HIGH SCHOOL
HOLLAND MIDDLE SCHOOL (11720 PARTRIDGE RD in HOLLAND, NY)
AIR MINOR (AIRS/AFS) AIR MONITORING SITE (Airborne pollution emission tracking) STATE MASTER (New York facility tracking) - REFUSE DISPOSAL, AIR PROGRAM Business SIC and NAICS classification: ELEMENTARY AND SECONDARY SCHOOLS Organizations: HOLLAND CTL SCH DIST (AIR PERMITTING FACILITY OWNER CONTACT)
HOLLAND BRUMSTEAD ELEM SCHOOL (173 CANADA STREET in HOLLAND, NY)
AIR MINOR (AIRS/AFS) STATE MASTER (New York facility tracking) - AIR PROGRAM Business SIC and NAICS classification: ELEMENTARY AND SECONDARY SCHOOLS Organizations: HOLLAND CTL SCH DIST (AIR PERMITTING FACILITY OWNER CONTACT)
AMERICAN LUMBER COMPANY (342 VERMONT ST in HOLLAND, NY)
AIR MINOR (AIRS/AFS) STATE MASTER (New York facility tracking) - AIR PROGRAM Business SIC classification: WOOD PALLETS AND SKIDS Business NAICS classification: WOOD CONTAINER AND PALLET MANUFACTURING. Organizations: BAILLIE LUMBER CO INC (LEGALLY RESPONSIBLE PARTY)
HAROLD O. BRUMSTED ES ( in HOLLAND, NY)
(National Center for Education Statistics) - STATE ID-141701040002 Organizations: HOLLAND CSD (SCHOOL DISTRICT)
HOLLAND HS ( in HOLLAND, NY)
(National Center for Education Statistics) - STATE ID-141701040001 Organizations: HOLLAND CSD (SCHOOL DISTRICT)
HOLLAND MS ( in HOLLAND, NY)
(National Center for Education Statistics) - STATE ID-141701040003 Organizations: HOLLAND CSD (SCHOOL DISTRICT)
A T & T CORP (VERMONT HILL RD & RTE 16 in HOLLAND, NY)
(Resource Conservation and Recovery Act (tracking hazardous waste))
AMERICAN PAD & PAPER CO DE (42 EDGEWOOD DR in HOLLAND, NY)
(Resource Conservation and Recovery Act (tracking hazardous waste))
HOWGEN TRANSPORTATION (MAIN in HOLLAND, NY)
TRANSPORTER (Resource Conservation and Recovery Act (tracking hazardous waste)) - notification Organizations: HOWGEN TRANSPORT CO, INC. (CONTACT/OWNER)
Housing units lacking complete plumbing facilities: 1.8% Housing units lacking complete kitchen facilities: 1.8%
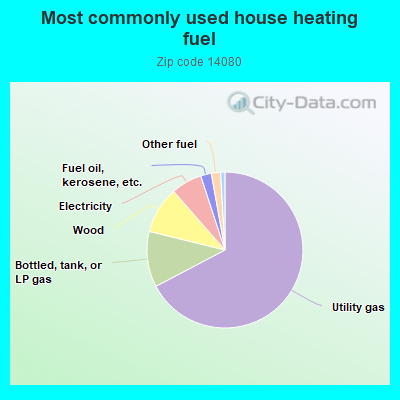
67.1%Utility gas
11.5%Bottled, tank, or LP gas
9.7%Wood
6.4%Electricity
2.2%Fuel oil, kerosene, etc.
1.9%Other fuel
0.9%Coal or coke
Population in 1990: 4,004. Population change in the 1990s: +723 (+18.1%).
Place of birth for U.S.-born residents:
This state: 3,780
Northeast: 109
Midwest: 53
South: 111
West: 27
70% of the 14080 zip code residents lived in the same house 5 years ago. Out of people who lived in different houses, 79% lived in this county. Out of people who lived in different counties, 50% lived in New York.
97% of the 14080 zip code residents lived in the same house 1 year ago. Out of people who lived in different houses, 56% moved from this county. Out of people who lived in different houses, 12% moved from different county within same state. Out of people who lived in different houses, 29% moved from different state.
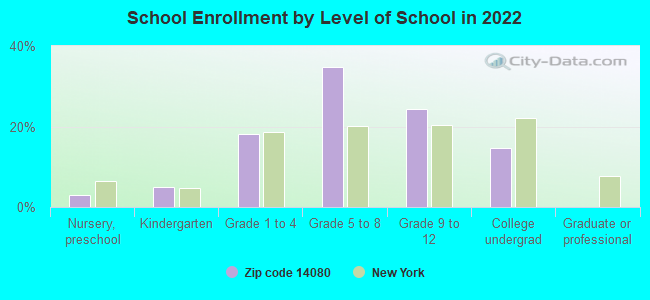
Private vs. public school enrollment:
Students in private schools in grades 1 to 8 (elementary and middle school): 119
Here:
28.9%
New York:
15.6%
Students in private schools in grades 9 to 12 (high school): 23
Here:
12.4%
New York:
15.0%
Students in private undergraduate colleges: 42
Here:
37.1%
New York:
39.2%
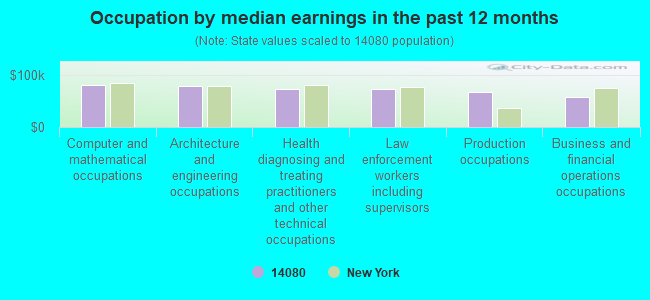
Occupation by median earnings in the past 12 months ($)
80,867Computer and mathematical occupations
79,182Architecture and engineering occupations
73,107Health diagnosing and treating practitioners and other technical occupations
73,040Law enforcement workers including supervisors
68,154Production occupations
57,629Business and financial operations occupations
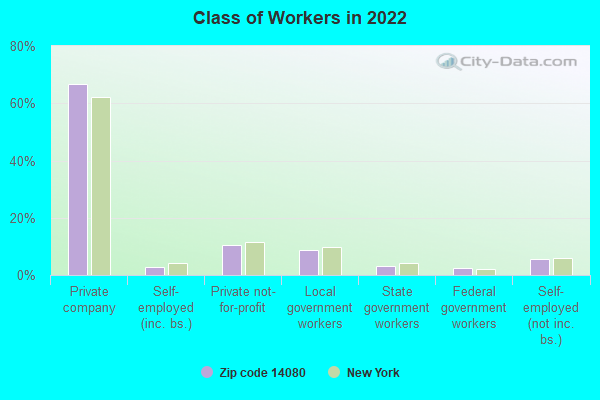
Top industries in this zip code by the number of employees in 2005:
Finance and Insurance: Commercial Banking (20-49 employees: 1 establishment)
2002 - 2018 National Fire Incident Reporting System (NFIRS) incidents
Based on the data from the years 2002 - 2018 the average number of fire incidents per year is 9. The highest number of fire incidents - 24 took place in 2013, and the least - 0 in 2007. The data has a rising trend.
When looking into fire subcategories, the most incidents belonged to: Structure Fires (62.1%), and Outside Fires (24.2%).
Fire incident types reported to NFIRS in Zip Code 14080
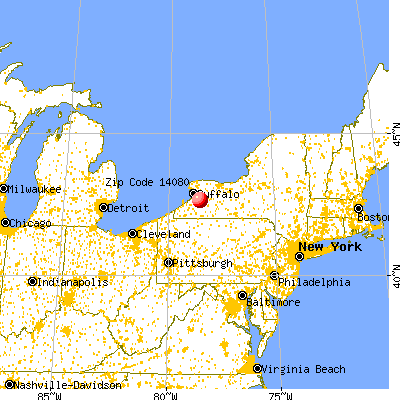


 Nearest zip codes: 14139, 14030, 14055, 14069, 14169, 14134.
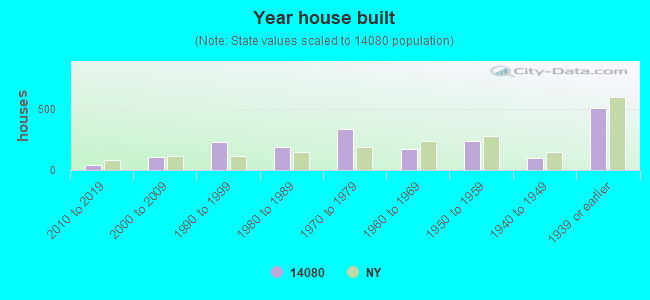


 Based on the data from the years 2002 - 2018 the average number of fire incidents per year is 9. The highest number of fire incidents - 24 took place in 2013, and the least - 0 in 2007. The data has a rising trend.
 When looking into fire subcategories, the most incidents belonged to: Structure Fires (62.1%), and Outside Fires (24.2%).