Estimated zip code population in 2022: 23,628
Zip code population in 2010: 22,431
Zip code population in 2000: 23,587
Houses and condos: 12,967
Renter-occupied apartments: 6,400
% of renters here:
53%State:
46%
March 2022 cost of living index in zip code 14216: 102.7
(near average, U.S. average is 100)
Land area: 2.8
sq. mi.
Water area: 0.0
sq. mi.
Population density: 8,524 people per square mile (high).
OSM Map
General Map
Google Map
MSN Map
OSM Map
General Map
Google Map
MSN Map
OSM Map
General Map
Google Map
MSN Map
OSM Map
General Map
Google Map
MSN Map
Please wait while loading the map...
Real estate property taxes paid for housing units in 2022:
This zip code:
1.0% ($2,838)New York:
1.5% ($6,180)
Median real estate property taxes paid for housing units with mortgages in 2022: $3,092 (1.2%)
Median real estate property taxes paid for housing units with no mortgage in 2022: $2,519 (0.9%)
Profiles of local businesses
Business Search - 14 Million verified businesses
Males: 11,368 Females: 12,259
For population 25 years and over in 14216:
High school or higher: 94.2%Bachelor's degree or higher: 54.7%Graduate or professional degree: 24.4%Unemployed: 2.8%Mean travel time to work (commute): 18.8 minutes
For population 15 years and over in 14216:
Never married: 45.1%Now married: 38.0%Separated: 1.4%Widowed: 4.5%Divorced: 11.0%
Zip code 14216 compared to state average:
Unemployed percentage below state average. Hispanic race population percentage below state average. Median age below state average. Foreign-born population percentage significantly below state average. Length of stay since moving in above state average. 16,643 70.4% White 3,607 15.3% Black 2,216 9.4% Hispanic or Latino 743 3.1% Two or more races 294 1.2% Asian 99 0.4% American Indian 19 0.08% Some other race 3 0.01% Native Hawaiian and Other
Data:
Median household income ($)
Median household income (% change since 2000)
Household income diversity
Ratio of average income to average house value (%)
Ratio of average income to average rent
Median household income ($) - White
Median household income ($) - Black or African American
Median household income ($) - Asian
Median household income ($) - Hispanic or Latino
Median household income ($) - American Indian and Alaska Native
Median household income ($) - Multirace
Median household income ($) - Other Race
Median household income for houses/condos with a mortgage ($)
Median household income for apartments without a mortgage ($)
Races - White alone (%)
Races - White alone (% change since 2000)
Races - Black alone (%)
Races - Black alone (% change since 2000)
Races - American Indian alone (%)
Races - American Indian alone (% change since 2000)
Races - Asian alone (%)
Races - Asian alone (% change since 2000)
Races - Hispanic (%)
Races - Hispanic (% change since 2000)
Races - Native Hawaiian and Other Pacific Islander alone (%)
Races - Native Hawaiian and Other Pacific Islander alone (% change since 2000)
Races - Two or more races (%)
Races - Two or more races (% change since 2000)
Races - Other race alone (%)
Races - Other race alone (% change since 2000)
Racial diversity
Unemployment (%)
Unemployment (% change since 2000)
Unemployment (%) - White
Unemployment (%) - Black or African American
Unemployment (%) - Asian
Unemployment (%) - Hispanic or Latino
Unemployment (%) - American Indian and Alaska Native
Unemployment (%) - Multirace
Unemployment (%) - Other Race
Population density (people per square mile)
Population - Males (%)
Population - Females (%)
Population - Males (%) - White
Population - Males (%) - Black or African American
Population - Males (%) - Asian
Population - Males (%) - Hispanic or Latino
Population - Males (%) - American Indian and Alaska Native
Population - Males (%) - Multirace
Population - Males (%) - Other Race
Population - Females (%) - White
Population - Females (%) - Black or African American
Population - Females (%) - Asian
Population - Females (%) - Hispanic or Latino
Population - Females (%) - American Indian and Alaska Native
Population - Females (%) - Multirace
Population - Females (%) - Other Race
Coronavirus confirmed cases (Apr 27, 2024)
Deaths caused by coronavirus (Apr 27, 2024)
Coronavirus confirmed cases (per 100k population) (Apr 27, 2024)
Deaths caused by coronavirus (per 100k population) (Apr 27, 2024)
Daily increase in number of cases (Apr 27, 2024)
Weekly increase in number of cases (Apr 27, 2024)
Cases doubled (in days) (Apr 27, 2024)
Hospitalized patients (Apr 18, 2022)
Negative test results (Apr 18, 2022)
Total test results (Apr 18, 2022)
COVID Vaccine doses distributed (per 100k population) (Sep 19, 2023)
COVID Vaccine doses administered (per 100k population) (Sep 19, 2023)
COVID Vaccine doses distributed (Sep 19, 2023)
COVID Vaccine doses administered (Sep 19, 2023)
Likely homosexual households (%)
Likely homosexual households (% change since 2000)
Likely homosexual households - Lesbian couples (%)
Likely homosexual households - Lesbian couples (% change since 2000)
Likely homosexual households - Gay men (%)
Likely homosexual households - Gay men (% change since 2000)
Cost of living index
Median gross rent ($)
Median contract rent ($)
Median monthly housing costs ($)
Median house or condo value ($)
Median house or condo value ($ change since 2000)
Mean house or condo value by units in structure - 1, detached ($)
Mean house or condo value by units in structure - 1, attached ($)
Mean house or condo value by units in structure - 2 ($)
Mean house or condo value by units in structure by units in structure - 3 or 4 ($)
Mean house or condo value by units in structure - 5 or more ($)
Mean house or condo value by units in structure - Boat, RV, van, etc. ($)
Mean house or condo value by units in structure - Mobile home ($)
Median house or condo value ($) - White
Median house or condo value ($) - Black or African American
Median house or condo value ($) - Asian
Median house or condo value ($) - Hispanic or Latino
Median house or condo value ($) - American Indian and Alaska Native
Median house or condo value ($) - Multirace
Median house or condo value ($) - Other Race
Median resident age
Resident age diversity
Median resident age - Males
Median resident age - Females
Median resident age - White
Median resident age - Black or African American
Median resident age - Asian
Median resident age - Hispanic or Latino
Median resident age - American Indian and Alaska Native
Median resident age - Multirace
Median resident age - Other Race
Median resident age - Males - White
Median resident age - Males - Black or African American
Median resident age - Males - Asian
Median resident age - Males - Hispanic or Latino
Median resident age - Males - American Indian and Alaska Native
Median resident age - Males - Multirace
Median resident age - Males - Other Race
Median resident age - Females - White
Median resident age - Females - Black or African American
Median resident age - Females - Asian
Median resident age - Females - Hispanic or Latino
Median resident age - Females - American Indian and Alaska Native
Median resident age - Females - Multirace
Median resident age - Females - Other Race
Commute - mean travel time to work (minutes)
Travel time to work - Less than 5 minutes (%)
Travel time to work - Less than 5 minutes (% change since 2000)
Travel time to work - 5 to 9 minutes (%)
Travel time to work - 5 to 9 minutes (% change since 2000)
Travel time to work - 10 to 19 minutes (%)
Travel time to work - 10 to 19 minutes (% change since 2000)
Travel time to work - 20 to 29 minutes (%)
Travel time to work - 20 to 29 minutes (% change since 2000)
Travel time to work - 30 to 39 minutes (%)
Travel time to work - 30 to 39 minutes (% change since 2000)
Travel time to work - 40 to 59 minutes (%)
Travel time to work - 40 to 59 minutes (% change since 2000)
Travel time to work - 60 to 89 minutes (%)
Travel time to work - 60 to 89 minutes (% change since 2000)
Travel time to work - 90 or more minutes (%)
Travel time to work - 90 or more minutes (% change since 2000)
Marital status - Never married (%)
Marital status - Now married (%)
Marital status - Separated (%)
Marital status - Widowed (%)
Marital status - Divorced (%)
Median family income ($)
Median family income (% change since 2000)
Median non-family income ($)
Median non-family income (% change since 2000)
Median per capita income ($)
Median per capita income (% change since 2000)
Median family income ($) - White
Median family income ($) - Black or African American
Median family income ($) - Asian
Median family income ($) - Hispanic or Latino
Median family income ($) - American Indian and Alaska Native
Median family income ($) - Multirace
Median family income ($) - Other Race
Median year house/condo built
Median year apartment built
Year house built - Built 2005 or later (%)
Year house built - Built 2000 to 2004 (%)
Year house built - Built 1990 to 1999 (%)
Year house built - Built 1980 to 1989 (%)
Year house built - Built 1970 to 1979 (%)
Year house built - Built 1960 to 1969 (%)
Year house built - Built 1950 to 1959 (%)
Year house built - Built 1940 to 1949 (%)
Year house built - Built 1939 or earlier (%)
Average household size
Household density (households per square mile)
Average household size - White
Average household size - Black or African American
Average household size - Asian
Average household size - Hispanic or Latino
Average household size - American Indian and Alaska Native
Average household size - Multirace
Average household size - Other Race
Occupied housing units (%)
Vacant housing units (%)
Owner occupied housing units (%)
Renter occupied housing units (%)
Vacancy status - For rent (%)
Vacancy status - For sale only (%)
Vacancy status - Rented or sold, not occupied (%)
Vacancy status - For seasonal, recreational, or occasional use (%)
Vacancy status - For migrant workers (%)
Vacancy status - Other vacant (%)
Residents with income below the poverty level (%)
Residents with income below 50% of the poverty level (%)
Children below poverty level (%)
Poor families by family type - Married-couple family (%)
Poor families by family type - Male, no wife present (%)
Poor families by family type - Female, no husband present (%)
Poverty status for native-born residents (%)
Poverty status for foreign-born residents (%)
Poverty among high school graduates not in families (%)
Poverty among people who did not graduate high school not in families (%)
Residents with income below the poverty level (%) - White
Residents with income below the poverty level (%) - Black or African American
Residents with income below the poverty level (%) - Asian
Residents with income below the poverty level (%) - Hispanic or Latino
Residents with income below the poverty level (%) - American Indian and Alaska Native
Residents with income below the poverty level (%) - Multirace
Residents with income below the poverty level (%) - Other Race
Air pollution - Air Quality Index (AQI)
Air pollution - CO
Air pollution - NO2
Air pollution - SO2
Air pollution - Ozone
Air pollution - PM10
Air pollution - PM25
Air pollution - Pb
Crime - Murders per 100,000 population
Crime - Rapes per 100,000 population
Crime - Robberies per 100,000 population
Crime - Assaults per 100,000 population
Crime - Burglaries per 100,000 population
Crime - Thefts per 100,000 population
Crime - Auto thefts per 100,000 population
Crime - Arson per 100,000 population
Crime - City-data.com crime index
Crime - Violent crime index
Crime - Property crime index
Crime - Murders per 100,000 population (5 year average)
Crime - Rapes per 100,000 population (5 year average)
Crime - Robberies per 100,000 population (5 year average)
Crime - Assaults per 100,000 population (5 year average)
Crime - Burglaries per 100,000 population (5 year average)
Crime - Thefts per 100,000 population (5 year average)
Crime - Auto thefts per 100,000 population (5 year average)
Crime - Arson per 100,000 population (5 year average)
Crime - City-data.com crime index (5 year average)
Crime - Violent crime index (5 year average)
Crime - Property crime index (5 year average)
1996 Presidential Elections Results (%) - Democratic Party (Clinton)
1996 Presidential Elections Results (%) - Republican Party (Dole)
1996 Presidential Elections Results (%) - Other
2000 Presidential Elections Results (%) - Democratic Party (Gore)
2000 Presidential Elections Results (%) - Republican Party (Bush)
2000 Presidential Elections Results (%) - Other
2004 Presidential Elections Results (%) - Democratic Party (Kerry)
2004 Presidential Elections Results (%) - Republican Party (Bush)
2004 Presidential Elections Results (%) - Other
2008 Presidential Elections Results (%) - Democratic Party (Obama)
2008 Presidential Elections Results (%) - Republican Party (McCain)
2008 Presidential Elections Results (%) - Other
2012 Presidential Elections Results (%) - Democratic Party (Obama)
2012 Presidential Elections Results (%) - Republican Party (Romney)
2012 Presidential Elections Results (%) - Other
2016 Presidential Elections Results (%) - Democratic Party (Clinton)
2016 Presidential Elections Results (%) - Republican Party (Trump)
2016 Presidential Elections Results (%) - Other
2020 Presidential Elections Results (%) - Democratic Party (Biden)
2020 Presidential Elections Results (%) - Republican Party (Trump)
2020 Presidential Elections Results (%) - Other
Ancestries Reported - Arab (%)
Ancestries Reported - Czech (%)
Ancestries Reported - Danish (%)
Ancestries Reported - Dutch (%)
Ancestries Reported - English (%)
Ancestries Reported - French (%)
Ancestries Reported - French Canadian (%)
Ancestries Reported - German (%)
Ancestries Reported - Greek (%)
Ancestries Reported - Hungarian (%)
Ancestries Reported - Irish (%)
Ancestries Reported - Italian (%)
Ancestries Reported - Lithuanian (%)
Ancestries Reported - Norwegian (%)
Ancestries Reported - Polish (%)
Ancestries Reported - Portuguese (%)
Ancestries Reported - Russian (%)
Ancestries Reported - Scotch-Irish (%)
Ancestries Reported - Scottish (%)
Ancestries Reported - Slovak (%)
Ancestries Reported - Subsaharan African (%)
Ancestries Reported - Swedish (%)
Ancestries Reported - Swiss (%)
Ancestries Reported - Ukrainian (%)
Ancestries Reported - United States (%)
Ancestries Reported - Welsh (%)
Ancestries Reported - West Indian (%)
Ancestries Reported - Other (%)
Educational Attainment - No schooling completed (%)
Educational Attainment - Less than high school (%)
Educational Attainment - High school or equivalent (%)
Educational Attainment - Less than 1 year of college (%)
Educational Attainment - 1 or more years of college (%)
Educational Attainment - Associate degree (%)
Educational Attainment - Bachelor's degree (%)
Educational Attainment - Master's degree (%)
Educational Attainment - Professional school degree (%)
Educational Attainment - Doctorate degree (%)
School Enrollment - Nursery, preschool (%)
School Enrollment - Kindergarten (%)
School Enrollment - Grade 1 to 4 (%)
School Enrollment - Grade 5 to 8 (%)
School Enrollment - Grade 9 to 12 (%)
School Enrollment - College undergrad (%)
School Enrollment - Graduate or professional (%)
School Enrollment - Not enrolled in school (%)
School enrollment - Public schools (%)
School enrollment - Private schools (%)
School enrollment - Not enrolled (%)
Median number of rooms in houses and condos
Median number of rooms in apartments
Housing units lacking complete plumbing facilities (%)
Housing units lacking complete kitchen facilities (%)
Density of houses
Urban houses (%)
Rural houses (%)
Households with people 60 years and over (%)
Households with people 65 years and over (%)
Households with people 75 years and over (%)
Households with one or more nonrelatives (%)
Households with no nonrelatives (%)
Population in households (%)
Family households (%)
Nonfamily households (%)
Population in families (%)
Family households with own children (%)
Median number of bedrooms in owner occupied houses
Mean number of bedrooms in owner occupied houses
Median number of bedrooms in renter occupied houses
Mean number of bedrooms in renter occupied houses
Median number of vehichles in owner occupied houses
Mean number of vehichles in owner occupied houses
Median number of vehichles in renter occupied houses
Mean number of vehichles in renter occupied houses
Mortgage status - with mortgage (%)
Mortgage status - with second mortgage (%)
Mortgage status - with home equity loan (%)
Mortgage status - with both second mortgage and home equity loan (%)
Mortgage status - without a mortgage (%)
Average family size
Average family size - White
Average family size - Black or African American
Average family size - Asian
Average family size - Hispanic or Latino
Average family size - American Indian and Alaska Native
Average family size - Multirace
Average family size - Other Race
Geographical mobility - Same house 1 year ago (%)
Geographical mobility - Moved within same county (%)
Geographical mobility - Moved from different county within same state (%)
Geographical mobility - Moved from different state (%)
Geographical mobility - Moved from abroad (%)
Place of birth - Born in state of residence (%)
Place of birth - Born in other state (%)
Place of birth - Native, outside of US (%)
Place of birth - Foreign born (%)
Housing units in structures - 1, detached (%)
Housing units in structures - 1, attached (%)
Housing units in structures - 2 (%)
Housing units in structures - 3 or 4 (%)
Housing units in structures - 5 to 9 (%)
Housing units in structures - 10 to 19 (%)
Housing units in structures - 20 to 49 (%)
Housing units in structures - 50 or more (%)
Housing units in structures - Mobile home (%)
Housing units in structures - Boat, RV, van, etc. (%)
House/condo owner moved in on average (years ago)
Renter moved in on average (years ago)
Year householder moved into unit - Moved in 1999 to March 2000 (%)
Year householder moved into unit - Moved in 1995 to 1998 (%)
Year householder moved into unit - Moved in 1990 to 1994 (%)
Year householder moved into unit - Moved in 1980 to 1989 (%)
Year householder moved into unit - Moved in 1970 to 1979 (%)
Year householder moved into unit - Moved in 1969 or earlier (%)
Means of transportation to work - Drove car alone (%)
Means of transportation to work - Carpooled (%)
Means of transportation to work - Public transportation (%)
Means of transportation to work - Bus or trolley bus (%)
Means of transportation to work - Streetcar or trolley car (%)
Means of transportation to work - Subway or elevated (%)
Means of transportation to work - Railroad (%)
Means of transportation to work - Ferryboat (%)
Means of transportation to work - Taxicab (%)
Means of transportation to work - Motorcycle (%)
Means of transportation to work - Bicycle (%)
Means of transportation to work - Walked (%)
Means of transportation to work - Other means (%)
Working at home (%)
Industry diversity
Most Common Industries - Agriculture, forestry, fishing and hunting, and mining (%)
Most Common Industries - Agriculture, forestry, fishing and hunting (%)
Most Common Industries - Mining, quarrying, and oil and gas extraction (%)
Most Common Industries - Construction (%)
Most Common Industries - Manufacturing (%)
Most Common Industries - Wholesale trade (%)
Most Common Industries - Retail trade (%)
Most Common Industries - Transportation and warehousing, and utilities (%)
Most Common Industries - Transportation and warehousing (%)
Most Common Industries - Utilities (%)
Most Common Industries - Information (%)
Most Common Industries - Finance and insurance, and real estate and rental and leasing (%)
Most Common Industries - Finance and insurance (%)
Most Common Industries - Real estate and rental and leasing (%)
Most Common Industries - Professional, scientific, and management, and administrative and waste management services (%)
Most Common Industries - Professional, scientific, and technical services (%)
Most Common Industries - Management of companies and enterprises (%)
Most Common Industries - Administrative and support and waste management services (%)
Most Common Industries - Educational services, and health care and social assistance (%)
Most Common Industries - Educational services (%)
Most Common Industries - Health care and social assistance (%)
Most Common Industries - Arts, entertainment, and recreation, and accommodation and food services (%)
Most Common Industries - Arts, entertainment, and recreation (%)
Most Common Industries - Accommodation and food services (%)
Most Common Industries - Other services, except public administration (%)
Most Common Industries - Public administration (%)
Occupation diversity
Most Common Occupations - Management, business, science, and arts occupations (%)
Most Common Occupations - Management, business, and financial occupations (%)
Most Common Occupations - Management occupations (%)
Most Common Occupations - Business and financial operations occupations (%)
Most Common Occupations - Computer, engineering, and science occupations (%)
Most Common Occupations - Computer and mathematical occupations (%)
Most Common Occupations - Architecture and engineering occupations (%)
Most Common Occupations - Life, physical, and social science occupations (%)
Most Common Occupations - Education, legal, community service, arts, and media occupations (%)
Most Common Occupations - Community and social service occupations (%)
Most Common Occupations - Legal occupations (%)
Most Common Occupations - Education, training, and library occupations (%)
Most Common Occupations - Arts, design, entertainment, sports, and media occupations (%)
Most Common Occupations - Healthcare practitioners and technical occupations (%)
Most Common Occupations - Health diagnosing and treating practitioners and other technical occupations (%)
Most Common Occupations - Health technologists and technicians (%)
Most Common Occupations - Service occupations (%)
Most Common Occupations - Healthcare support occupations (%)
Most Common Occupations - Protective service occupations (%)
Most Common Occupations - Fire fighting and prevention, and other protective service workers including supervisors (%)
Most Common Occupations - Law enforcement workers including supervisors (%)
Most Common Occupations - Food preparation and serving related occupations (%)
Most Common Occupations - Building and grounds cleaning and maintenance occupations (%)
Most Common Occupations - Personal care and service occupations (%)
Most Common Occupations - Sales and office occupations (%)
Most Common Occupations - Sales and related occupations (%)
Most Common Occupations - Office and administrative support occupations (%)
Most Common Occupations - Natural resources, construction, and maintenance occupations (%)
Most Common Occupations - Farming, fishing, and forestry occupations (%)
Most Common Occupations - Construction and extraction occupations (%)
Most Common Occupations - Installation, maintenance, and repair occupations (%)
Most Common Occupations - Production, transportation, and material moving occupations (%)
Most Common Occupations - Production occupations (%)
Most Common Occupations - Transportation occupations (%)
Most Common Occupations - Material moving occupations (%)
People in Group quarters - Institutionalized population (%)
People in Group quarters - Correctional institutions (%)
People in Group quarters - Federal prisons and detention centers (%)
People in Group quarters - Halfway houses (%)
People in Group quarters - Local jails and other confinement facilities (including police lockups) (%)
People in Group quarters - Military disciplinary barracks (%)
People in Group quarters - State prisons (%)
People in Group quarters - Other types of correctional institutions (%)
People in Group quarters - Nursing homes (%)
People in Group quarters - Hospitals/wards, hospices, and schools for the handicapped (%)
People in Group quarters - Hospitals/wards and hospices for chronically ill (%)
People in Group quarters - Hospices or homes for chronically ill (%)
People in Group quarters - Military hospitals or wards for chronically ill (%)
People in Group quarters - Other hospitals or wards for chronically ill (%)
People in Group quarters - Hospitals or wards for drug/alcohol abuse (%)
People in Group quarters - Mental (Psychiatric) hospitals or wards (%)
People in Group quarters - Schools, hospitals, or wards for the mentally retarded (%)
People in Group quarters - Schools, hospitals, or wards for the physically handicapped (%)
People in Group quarters - Institutions for the deaf (%)
People in Group quarters - Institutions for the blind (%)
People in Group quarters - Orthopedic wards and institutions for the physically handicapped (%)
People in Group quarters - Wards in general hospitals for patients who have no usual home elsewhere (%)
People in Group quarters - Wards in military hospitals for patients who have no usual home elsewhere (%)
People in Group quarters - Juvenile institutions (%)
People in Group quarters - Long-term care (%)
People in Group quarters - Homes for abused, dependent, and neglected children (%)
People in Group quarters - Residential treatment centers for emotionally disturbed children (%)
People in Group quarters - Training schools for juvenile delinquents (%)
People in Group quarters - Short-term care, detention or diagnostic centers for delinquent children (%)
People in Group quarters - Type of juvenile institution unknown (%)
People in Group quarters - Noninstitutionalized population (%)
People in Group quarters - College dormitories (includes college quarters off campus) (%)
People in Group quarters - Military quarters (%)
People in Group quarters - On base (%)
People in Group quarters - Barracks, unaccompanied personnel housing (UPH), (Enlisted/Officer), ;and similar group living quarters for military personnel (%)
People in Group quarters - Transient quarters for temporary residents (%)
People in Group quarters - Military ships (%)
People in Group quarters - Group homes (%)
People in Group quarters - Homes or halfway houses for drug/alcohol abuse (%)
People in Group quarters - Homes for the mentally ill (%)
People in Group quarters - Homes for the mentally retarded (%)
People in Group quarters - Homes for the physically handicapped (%)
People in Group quarters - Other group homes (%)
People in Group quarters - Religious group quarters (%)
People in Group quarters - Dormitories (%)
People in Group quarters - Agriculture workers' dormitories on farms (%)
People in Group quarters - Job Corps and vocational training facilities (%)
People in Group quarters - Other workers' dormitories (%)
People in Group quarters - Crews of maritime vessels (%)
People in Group quarters - Other nonhousehold living situations (%)
People in Group quarters - Other noninstitutional group quarters (%)
Residents speaking English at home (%)
Residents speaking English at home - Born in the United States (%)
Residents speaking English at home - Native, born elsewhere (%)
Residents speaking English at home - Foreign born (%)
Residents speaking Spanish at home (%)
Residents speaking Spanish at home - Born in the United States (%)
Residents speaking Spanish at home - Native, born elsewhere (%)
Residents speaking Spanish at home - Foreign born (%)
Residents speaking other language at home (%)
Residents speaking other language at home - Born in the United States (%)
Residents speaking other language at home - Native, born elsewhere (%)
Residents speaking other language at home - Foreign born (%)
Class of Workers - Employee of private company (%)
Class of Workers - Self-employed in own incorporated business (%)
Class of Workers - Private not-for-profit wage and salary workers (%)
Class of Workers - Local government workers (%)
Class of Workers - State government workers (%)
Class of Workers - Federal government workers (%)
Class of Workers - Self-employed workers in own not incorporated business and Unpaid family workers (%)
House heating fuel used in houses and condos - Utility gas (%)
House heating fuel used in houses and condos - Bottled, tank, or LP gas (%)
House heating fuel used in houses and condos - Electricity (%)
House heating fuel used in houses and condos - Fuel oil, kerosene, etc. (%)
House heating fuel used in houses and condos - Coal or coke (%)
House heating fuel used in houses and condos - Wood (%)
House heating fuel used in houses and condos - Solar energy (%)
House heating fuel used in houses and condos - Other fuel (%)
House heating fuel used in houses and condos - No fuel used (%)
House heating fuel used in apartments - Utility gas (%)
House heating fuel used in apartments - Bottled, tank, or LP gas (%)
House heating fuel used in apartments - Electricity (%)
House heating fuel used in apartments - Fuel oil, kerosene, etc. (%)
House heating fuel used in apartments - Coal or coke (%)
House heating fuel used in apartments - Wood (%)
House heating fuel used in apartments - Solar energy (%)
House heating fuel used in apartments - Other fuel (%)
House heating fuel used in apartments - No fuel used (%)
Armed forces status - In Armed Forces (%)
Armed forces status - Civilian (%)
Armed forces status - Civilian - Veteran (%)
Armed forces status - Civilian - Nonveteran (%)
Fatal accidents locations in years 2005-2021
Fatal accidents locations in 2005
Fatal accidents locations in 2006
Fatal accidents locations in 2007
Fatal accidents locations in 2008
Fatal accidents locations in 2009
Fatal accidents locations in 2010
Fatal accidents locations in 2011
Fatal accidents locations in 2012
Fatal accidents locations in 2013
Fatal accidents locations in 2014
Fatal accidents locations in 2015
Fatal accidents locations in 2016
Fatal accidents locations in 2017
Fatal accidents locations in 2018
Fatal accidents locations in 2019
Fatal accidents locations in 2020
Fatal accidents locations in 2021
Alcohol use - People drinking some alcohol every month (%)
Alcohol use - People not drinking at all (%)
Alcohol use - Average days/month drinking alcohol
Alcohol use - Average drinks/week
Alcohol use - Average days/year people drink much
Audiometry - Average condition of hearing (%)
Audiometry - People that can hear a whisper from across a quiet room (%)
Audiometry - People that can hear normal voice from across a quiet room (%)
Audiometry - Ears ringing, roaring, buzzing (%)
Audiometry - Had a job exposure to loud noise (%)
Audiometry - Had off-work exposure to loud noise (%)
Blood Pressure & Cholesterol - Has high blood pressure (%)
Blood Pressure & Cholesterol - Checking blood pressure at home (%)
Blood Pressure & Cholesterol - Frequently checking blood cholesterol (%)
Blood Pressure & Cholesterol - Has high cholesterol level (%)
Consumer Behavior - Money monthly spent on food at supermarket/grocery store
Consumer Behavior - Money monthly spent on food at other stores
Consumer Behavior - Money monthly spent on eating out
Consumer Behavior - Money monthly spent on carryout/delivered foods
Consumer Behavior - Income spent on food at supermarket/grocery store (%)
Consumer Behavior - Income spent on food at other stores (%)
Consumer Behavior - Income spent on eating out (%)
Consumer Behavior - Income spent on carryout/delivered foods (%)
Current Health Status - General health condition (%)
Current Health Status - Blood donors (%)
Current Health Status - Has blood ever tested for HIV virus (%)
Current Health Status - Left-handed people (%)
Dermatology - People using sunscreen (%)
Diabetes - Diabetics (%)
Diabetes - Had a blood test for high blood sugar (%)
Diabetes - People taking insulin (%)
Diet Behavior & Nutrition - Diet health (%)
Diet Behavior & Nutrition - Milk product consumption (# of products/month)
Diet Behavior & Nutrition - Meals not home prepared (#/week)
Diet Behavior & Nutrition - Meals from fast food or pizza place (#/week)
Diet Behavior & Nutrition - Ready-to-eat foods (#/month)
Diet Behavior & Nutrition - Frozen meals/pizza (#/month)
Drug Use - People that ever used marijuana or hashish (%)
Drug Use - Ever used hard drugs (%)
Drug Use - Ever used any form of cocaine (%)
Drug Use - Ever used heroin (%)
Drug Use - Ever used methamphetamine (%)
Health Insurance - People covered by health insurance (%)
Kidney Conditions-Urology - Avg. # of times urinating at night
Medical Conditions - People with asthma (%)
Medical Conditions - People with anemia (%)
Medical Conditions - People with psoriasis (%)
Medical Conditions - People with overweight (%)
Medical Conditions - Elderly people having difficulties in thinking or remembering (%)
Medical Conditions - People who ever received blood transfusion (%)
Medical Conditions - People having trouble seeing even with glass/contacts (%)
Medical Conditions - People with arthritis (%)
Medical Conditions - People with gout (%)
Medical Conditions - People with congestive heart failure (%)
Medical Conditions - People with coronary heart disease (%)
Medical Conditions - People with angina pectoris (%)
Medical Conditions - People who ever had heart attack (%)
Medical Conditions - People who ever had stroke (%)
Medical Conditions - People with emphysema (%)
Medical Conditions - People with thyroid problem (%)
Medical Conditions - People with chronic bronchitis (%)
Medical Conditions - People with any liver condition (%)
Medical Conditions - People who ever had cancer or malignancy (%)
Mental Health - People who have little interest in doing things (%)
Mental Health - People feeling down, depressed, or hopeless (%)
Mental Health - People who have trouble sleeping or sleeping too much (%)
Mental Health - People feeling tired or having little energy (%)
Mental Health - People with poor appetite or overeating (%)
Mental Health - People feeling bad about themself (%)
Mental Health - People who have trouble concentrating on things (%)
Mental Health - People moving or speaking slowly or too fast (%)
Mental Health - People having thoughts they would be better off dead (%)
Oral Health - Average years since last visit a dentist
Oral Health - People embarrassed because of mouth (%)
Oral Health - People with gum disease (%)
Oral Health - General health of teeth and gums (%)
Oral Health - Average days a week using dental floss/device
Oral Health - Average days a week using mouthwash for dental problem
Oral Health - Average number of teeth
Pesticide Use - Households using pesticides to control insects (%)
Pesticide Use - Households using pesticides to kill weeds (%)
Physical Activity - People doing vigorous-intensity work activities (%)
Physical Activity - People doing moderate-intensity work activities (%)
Physical Activity - People walking or bicycling (%)
Physical Activity - People doing vigorous-intensity recreational activities (%)
Physical Activity - People doing moderate-intensity recreational activities (%)
Physical Activity - Average hours a day doing sedentary activities
Physical Activity - Average hours a day watching TV or videos
Physical Activity - Average hours a day using computer
Physical Functioning - People having limitations keeping them from working (%)
Physical Functioning - People limited in amount of work they can do (%)
Physical Functioning - People that need special equipment to walk (%)
Physical Functioning - People experiencing confusion/memory problems (%)
Physical Functioning - People requiring special healthcare equipment (%)
Prescription Medications - Average number of prescription medicines taking
Preventive Aspirin Use - Adults 40+ taking low-dose aspirin (%)
Reproductive Health - Vaginal deliveries (%)
Reproductive Health - Cesarean deliveries (%)
Reproductive Health - Deliveries resulted in a live birth (%)
Reproductive Health - Pregnancies resulted in a delivery (%)
Reproductive Health - Women breastfeeding newborns (%)
Reproductive Health - Women that had a hysterectomy (%)
Reproductive Health - Women that had both ovaries removed (%)
Reproductive Health - Women that have ever taken birth control pills (%)
Reproductive Health - Women taking birth control pills (%)
Reproductive Health - Women that have ever used Depo-Provera or injectables (%)
Reproductive Health - Women that have ever used female hormones (%)
Sexual Behavior - People 18+ that ever had sex (vaginal, anal, or oral) (%)
Sexual Behavior - Males 18+ that ever had vaginal sex with a woman (%)
Sexual Behavior - Males 18+ that ever performed oral sex on a woman (%)
Sexual Behavior - Males 18+ that ever had anal sex with a woman (%)
Sexual Behavior - Males 18+ that ever had any sex with a man (%)
Sexual Behavior - Females 18+ that ever had vaginal sex with a man (%)
Sexual Behavior - Females 18+ that ever performed oral sex on a man (%)
Sexual Behavior - Females 18+ that ever had anal sex with a man (%)
Sexual Behavior - Females 18+ that ever had any kind of sex with a woman (%)
Sexual Behavior - Average age people first had sex
Sexual Behavior - Average number of female sex partners in lifetime (males 18+)
Sexual Behavior - Average number of female vaginal sex partners in lifetime (males 18+)
Sexual Behavior - Average age people first performed oral sex on a woman (18+)
Sexual Behavior - Average number of woman performed oral sex on in lifetime (18+)
Sexual Behavior - Average number of male sex partners in lifetime (males 18+)
Sexual Behavior - Average number of male anal sex partners in lifetime (males 18+)
Sexual Behavior - Average age people first performed oral sex on a man (18+)
Sexual Behavior - Average number of male oral sex partners in lifetime (18+)
Sexual Behavior - People using protection when performing oral sex (%)
Sexual Behavior - Average number of times people have vaginal or anal sex a year
Sexual Behavior - People having sex without condom (%)
Sexual Behavior - Average number of male sex partners in lifetime (females 18+)
Sexual Behavior - Average number of male vaginal sex partners in lifetime (females 18+)
Sexual Behavior - Average number of female sex partners in lifetime (females 18+)
Sexual Behavior - Circumcised males 18+ (%)
Sleep Disorders - Average hours sleeping at night
Sleep Disorders - People that has trouble sleeping (%)
Smoking-Cigarette Use - People smoking cigarettes (%)
Taste & Smell - People 40+ having problems with smell (%)
Taste & Smell - People 40+ having problems with taste (%)
Taste & Smell - People 40+ that ever had wisdom teeth removed (%)
Taste & Smell - People 40+ that ever had tonsils teeth removed (%)
Taste & Smell - People 40+ that ever had a loss of consciousness because of a head injury (%)
Taste & Smell - People 40+ that ever had a broken nose or other serious injury to face or skull (%)
Taste & Smell - People 40+ that ever had two or more sinus infections (%)
Weight - Average height (inches)
Weight - Average weight (pounds)
Weight - Average BMI
Weight - People that are obese (%)
Weight - People that ever were obese (%)
Weight - People trying to lose weight (%)
100%
urban population.
Estimated median house/condo value in 2022: $270,408
14216:
$270,408New York:
$400,400
According to our research of New York and other state lists, there were 19 registered sex offenders living in 14216 zip code as of April 27, 2024 . The ratio of all residents to sex offenders in zip code 14216 is 1,184 to 1.The ratio of registered sex offenders to all residents in this zip code is lower than the state average.
Median resident age: This zip code:
34.8 yearsNew York median age:
40.0 years
Average household size: This zip code:
1.9 peopleNew York:
2.5 people
Averages for the 2020 tax year for zip code 14216, filed in 2021:
Average Adjusted Gross Income (AGI) in 2020: $68,404 (Individual Income Tax Returns) Here:
$68,404State:
$90,930
Salary/wage: $58,165 (reported on 84.6% of returns )Here:
$58,165State:
$72,104
(% of AGI for various income ranges: 1122.1% for AGIs below $25k , 3669.9% for AGIs $25k-50k , 6616.5% for AGIs $50k-75k , 9612.6% for AGIs $75k-100k , 16773.2% for AGIs $100k-200k , 98866.2% for AGIs over 200k ) Taxable interest for individuals: $1,226 (reported on 31.6% of returns )This zip code:
$1,226New York:
$3,075
(% of AGI for various income ranges: 9.1% for AGIs below $25k , 11.9% for AGIs $25k-50k , 24.2% for AGIs $50k-75k , 57.8% for AGIs $75k-100k , 116.8% for AGIs $100k-200k , 1651.5% for AGIs over 200k ) Ordinary dividends: $6,980 (reported on 20.4% of returns )(% of AGI for various income ranges: 32.3% for AGIs below $25k , 30.8% for AGIs $25k-50k , 66.0% for AGIs $50k-75k , 124.9% for AGIs $75k-100k , 386.0% for AGIs $100k-200k , 7380.0% for AGIs over 200k ) Net capital gain/loss in AGI: +$13,940 (reported on 18.0% of returns )Here:
+$13,940State:
+$44,925
(% of AGI for various income ranges: 16.9% for AGIs below $25k , 23.3% for AGIs $25k-50k , 54.8% for AGIs $50k-75k , 138.7% for AGIs $75k-100k , 516.4% for AGIs $100k-200k , 16695.4% for AGIs over 200k ) Profit/loss from business: +$14,251 (reported on 12.7% of returns )Here:
+$14,251State:
+$14,940
(% of AGI for various income ranges: 65.5% for AGIs below $25k , 100.4% for AGIs $25k-50k , 153.7% for AGIs $50k-75k , 221.7% for AGIs $75k-100k , 621.6% for AGIs $100k-200k , 5638.5% for AGIs over 200k ) Taxable individual retirement arrangement distribution: $14,292 (reported on 6.8% of returns )14216:
$14,292New York:
$19,609
(% of AGI for various income ranges: 37.2% for AGIs below $25k , 53.3% for AGIs $25k-50k , 95.1% for AGIs $50k-75k , 192.8% for AGIs $75k-100k , 418.1% for AGIs $100k-200k , 1851.5% for AGIs over 200k ) Self-employed (Keogh) retirement plans: $25,978 (reported on 0.8% of returns )14216:
$25,978New York:
$32,497
(% of AGI for various income ranges: 51.3% for AGIs $100k-200k , 1463.1% for AGIs over 200k ) Total itemized deductions: $31,705 (reported on 5.2% of returns )Here:
$31,705State:
$39,326
(% of AGI for various income ranges: 23.0% for AGIs below $25k , 31.3% for AGIs $25k-50k , 115.1% for AGIs $50k-75k , 255.5% for AGIs $75k-100k , 542.4% for AGIs $100k-200k , 7180.0% for AGIs over 200k ) Charity contributions: $12,063 (reported on 4.2% of returns )Here:
$12,063State:
$15,420
(% of AGI for various income ranges: 5.1% for AGIs $25k-50k , 11.5% for AGIs $50k-75k , 46.2% for AGIs $75k-100k , 134.5% for AGIs $100k-200k , 3160.0% for AGIs over 200k ) Taxes paid: $8,393 (reported on 5.2% of returns )(% of AGI for various income ranges: 3.8% for AGIs below $25k , 8.2% for AGIs $25k-50k , 35.8% for AGIs $50k-75k , 97.6% for AGIs $75k-100k , 192.4% for AGIs $100k-200k , 1385.4% for AGIs over 200k ) Earned income credit: $1,851 (reported on 12.2% of returns )(% of AGI for various income ranges: 68.0% for AGIs below $25k , 39.5% for AGIs $25k-50k ) Percentage of individuals using paid preparers for their 2020 taxes: 95.4%(% for various income ranges: 94.7% for AGIs below $25k , 96.0% for AGIs $25k-50k , 95.7% for AGIs $50k-75k , 94.6% for AGIs $75k-100k , 95.1% for AGIs $100k-200k , 97.8% for AGIs over 200k )
Averages for the 2012 tax year for zip code 14216, filed in 2013:
Average Adjusted Gross Income (AGI) in 2012: $53,181 (Individual Income Tax Returns) Here:
$53,181State:
$77,088
Salary/wage: $43,579 (reported on 87.0% of returns )Here:
$43,579State:
$60,593
(% of AGI for various income ranges: 78.5% for AGIs below $25k , 87.0% for AGIs $25k-50k , 82.8% for AGIs $50k-75k , 78.1% for AGIs $75k-100k , 73.1% for AGIs $100k-200k , 40.9% for AGIs over 200k ) Taxable interest for individuals: $1,139 (reported on 35.9% of returns )This zip code:
$1,139New York:
$3,125
(% of AGI for various income ranges: 0.7% for AGIs below $25k , 0.4% for AGIs $25k-50k , 0.4% for AGIs $50k-75k , 0.5% for AGIs $75k-100k , 0.6% for AGIs $100k-200k , 1.6% for AGIs over 200k ) Ordinary dividends: $6,402 (reported on 18.2% of returns )(% of AGI for various income ranges: 1.6% for AGIs below $25k , 0.7% for AGIs $25k-50k , 0.7% for AGIs $50k-75k , 1.2% for AGIs $75k-100k , 2.5% for AGIs $100k-200k , 5.0% for AGIs over 200k ) Net capital gain/loss in AGI: +$19,155 (reported on 13.0% of returns )Here:
+$19,155State:
+$42,474
(% of AGI for various income ranges: 0.3% for AGIs $25k-50k , 0.3% for AGIs $50k-75k , 0.7% for AGIs $75k-100k , 1.2% for AGIs $100k-200k , 19.0% for AGIs over 200k ) Profit/loss from business: +$13,379 (reported on 10.9% of returns )Here:
+$13,379State:
+$16,168
(% of AGI for various income ranges: 4.2% for AGIs below $25k , 1.9% for AGIs $25k-50k , 1.7% for AGIs $50k-75k , 2.7% for AGIs $75k-100k , 3.7% for AGIs $100k-200k , 2.8% for AGIs over 200k ) Taxable individual retirement arrangement distribution: $13,016 (reported on 7.6% of returns )14216:
$13,016New York:
$17,621
(% of AGI for various income ranges: 1.8% for AGIs below $25k , 1.2% for AGIs $25k-50k , 1.3% for AGIs $50k-75k , 2.1% for AGIs $75k-100k , 2.6% for AGIs $100k-200k , 2.1% for AGIs over 200k ) Self-employment retirement plans: $20,390 (reported on 0.9% of returns )14216:
$20,390New York:
$27,330
(% of AGI for various income ranges: 0.4% for AGIs below $25k , 0.3% for AGIs $100k-200k , 1.1% for AGIs over 200k ) Total itemized deductions: $21,903 (18% of AGI, reported on 23.2% of returns )Here:
$21,903State:
$34,985
Here:
17.6% of AGIState:
21.3% of AGI
(% of AGI for various income ranges: 3.9% for AGIs below $25k , 4.6% for AGIs $25k-50k , 8.1% for AGIs $50k-75k , 9.4% for AGIs $75k-100k , 12.8% for AGIs $100k-200k , 14.4% for AGIs over 200k ) Charity contributions: $4,115 (reported on 19.3% of returns )(% of AGI for various income ranges: 0.4% for AGIs below $25k , 0.4% for AGIs $25k-50k , 1.0% for AGIs $50k-75k , 1.3% for AGIs $75k-100k , 1.9% for AGIs $100k-200k , 2.9% for AGIs over 200k ) Taxes paid: $10,560 (reported on 23.1% of returns )14216:
$10,560State:
$18,656
(% of AGI for various income ranges: 1.1% for AGIs below $25k , 1.6% for AGIs $25k-50k , 3.3% for AGIs $50k-75k , 4.1% for AGIs $75k-100k , 6.6% for AGIs $100k-200k , 8.0% for AGIs over 200k ) Earned income credit: $1,839 (reported on 15.9% of returns )(% of AGI for various income ranges: 4.6% for AGIs below $25k , 0.6% for AGIs $25k-50k ) Percentage of individuals using paid preparers for their 2012 taxes: 53.0%(% for various income ranges: 48.4% for AGIs below $25k , 47.5% for AGIs $25k-50k , 57.9% for AGIs $50k-75k , 61.9% for AGIs $75k-100k , 69.6% for AGIs $100k-200k , 84.0% for AGIs over 200k )
Averages for the 2004 tax year for zip code 14216, filed in 2005:
Average Adjusted Gross Income (AGI) in 2004: $44,554 (Individual Income Tax Returns) Here:
$44,554State:
$59,519
Salary/wage: $38,061 (reported on 86.7% of returns )Here:
$38,061State:
$50,673
(% of AGI for various income ranges: 111.2% for AGIs below $10k , 80.1% for AGIs $10k-25k , 86.3% for AGIs $25k-50k , 85.0% for AGIs $50k-75k , 82.5% for AGIs $75k-100k , 55.4% for AGIs over 100k ) Taxable interest for individuals: $1,506 (reported on 48.4% of returns )This zip code:
$1,506New York:
$2,377
(% of AGI for various income ranges: 6.0% for AGIs below $10k , 1.8% for AGIs $10k-25k , 1.1% for AGIs $25k-50k , 1.0% for AGIs $50k-75k , 1.2% for AGIs $75k-100k , 2.1% for AGIs over 100k ) Taxable dividends: $4,338 (reported on 24.2% of returns )(% of AGI for various income ranges: 5.6% for AGIs below $10k , 1.3% for AGIs $10k-25k , 1.0% for AGIs $25k-50k , 0.7% for AGIs $50k-75k , 1.6% for AGIs $75k-100k , 4.3% for AGIs over 100k ) Net capital gain/loss: +$9,573 (reported on 17.0% of returns )Here:
+$9,573State:
+$23,581
(% of AGI for various income ranges: -1.9% for AGIs below $10k , 0.2% for AGIs $10k-25k , 0.7% for AGIs $25k-50k , 0.4% for AGIs $50k-75k , 0.7% for AGIs $75k-100k , 9.1% for AGIs over 100k ) Profit/loss from business: +$11,798 (reported on 9.6% of returns )Here:
+$11,798State:
+$13,809
(% of AGI for various income ranges: -0.2% for AGIs below $10k , 1.8% for AGIs $10k-25k , 1.6% for AGIs $25k-50k , 1.4% for AGIs $50k-75k , 1.4% for AGIs $75k-100k , 4.3% for AGIs over 100k ) IRA payment deduction: $2,606 (reported on 2.4% of returns )14216:
$2,606New York:
$3,115
(% of AGI for various income ranges: 0.3% for AGIs below $10k , 0.2% for AGIs $10k-25k , 0.2% for AGIs $25k-50k , 0.2% for AGIs $50k-75k , 0.1% for AGIs $75k-100k , 0.1% for AGIs over 100k ) Self-employed pension: $14,571 (reported on 1.0% of returns )Here:
$14,571New York:
$19,016
Total itemized deductions: $18,927 (18% of AGI, reported on 24.8% of returns )Here:
$18,927State:
$25,864
Here:
18.3% of AGIState:
21.9% of AGI
(% of AGI for various income ranges: 4.6% for AGIs below $10k , 4.2% for AGIs $10k-25k , 6.5% for AGIs $25k-50k , 10.0% for AGIs $50k-75k , 12.4% for AGIs $75k-100k , 14.8% for AGIs over 100k ) Charity contributions deductions: $4,002 (4% of AGI, reported on 23.0% of returns )Here:
3.7% of AGIState:
3.6% of AGI
(% of AGI for various income ranges: 0.3% for AGIs below $10k , 0.6% for AGIs $10k-25k , 0.9% for AGIs $25k-50k , 1.6% for AGIs $50k-75k , 2.0% for AGIs $75k-100k , 3.5% for AGIs over 100k ) Total tax: $7,742 (reported on 75.5% of returns )14216:
$7,742State:
$11,730
(% of AGI for various income ranges: 2.2% for AGIs below $10k , 4.2% for AGIs $10k-25k , 8.0% for AGIs $25k-50k , 10.3% for AGIs $50k-75k , 11.4% for AGIs $75k-100k , 21.1% for AGIs over 100k ) Earned income credit: $1,533 (reported on 14.9% of returns )Percentage of individuals using paid preparers for their 2004 taxes: 59.9%(% for various income ranges: 54.2% for AGIs below $10k , 58.7% for AGIs $10k-25k , 58.3% for AGIs $25k-50k , 63.2% for AGIs $50k-75k , 68.1% for AGIs $75k-100k , 75.5% for AGIs over 100k )
Estimated median household income in 2022: This zip code:
$65,527New York:
$79,557
Nearest zip codes: 14214 ,
14217 ,
14223 ,
14222 ,
14208 ,
14209 .
Buffalo Zip Code Map
Percentage of family households: This zip code:
32.4%New York:
41.3%
Percentage of households with unmarried partners: This zip code:
9.0%New York:
42.3%
Likely homosexual households (counted as self-reported same-sex unmarried-partner households)
Lesbian couples: 0.2% of all households Gay men: 0.1% of all households
Household received Food Stamps/SNAP in the past 12 months: 2,253Household did not receive Food Stamps/SNAP in the past 12 months: 9,892
Women who had a birth in the past 12 months: 361 (187 now married , 176 unmarried) Women who did not have a birth in the past 12 months: 6,392 (2,157 now married , 4,242 unmarried)
Housing units in zip code 14216 with a mortgage: 3,679 (597
second mortgage , 548
both second mortgage and home equity loan )
Houses without a mortgage: 302
Median monthly owner costs for units with a mortgage: $1,392
Median monthly owner costs for units without a mortgage: $573
Residents with income below the poverty level in 2022:
This zip code:
17.9%Whole state:
14.3%
Residents with income below 50% of the poverty level in 2022:
This zip code:
8.1%Whole state:
6.8%
Median number of rooms in houses and condos: Median number of rooms in apartments:
Year house built (houses)
0 2020 or later291 2010 to 2019158 2000 to 2009107 1990 to 1999346 1980 to 1989594 1970 to 1979617 1960 to 19692,191 1950 to 1959997 1940 to 19497,411 1939 or earlier
Zip code 14216 household income distribution in 2022 1,068 Less than $10,000708 $10,000 to $14,999403 $15,000 to $19,999272 $20,000 to $24,999470 $25,000 to $29,999606 $30,000 to $34,999341 $35,000 to $39,999483 $40,000 to $44,999285 $45,000 to $49,999938 $50,000 to $59,9991,122 $60,000 to $74,9991,661 $75,000 to $99,9991,065 $100,000 to $124,999948 $125,000 to $149,999849 $150,000 to $199,999955 $200,000 or moreEstimate of home value of owner-occupied houses/condos in 2022 in zip code 14216 37 Less than $10,00047 $40,000 to $49,99911 $60,000 to $69,999111 $70,000 to $79,99959 $80,000 to $89,99948 $90,000 to $99,999190 $100,000 to $124,999224 $125,000 to $149,999499 $150,000 to $174,999450 $175,000 to $199,999839 $200,000 to $249,999857 $250,000 to $299,9991,564 $300,000 to $399,999326 $400,000 to $499,999194 $500,000 to $749,999157 $750,000 to $999,9997 $1,000,000 to $1,499,99913 $2,000,000 or moreRent paid by renters in 2022 in zip code 14216 6 $100 to $14926 $150 to $19980 $200 to $249109 $250 to $29912 $300 to $34995 $350 to $39938 $400 to $449104 $450 to $499381 $500 to $54977 $550 to $599293 $600 to $649154 $650 to $699186 $700 to $749397 $750 to $799644 $800 to $899846 $900 to $9991,292 $1,000 to $1,2491,117 $1,250 to $1,499209 $1,500 to $1,99936 $2,000 to $2,4997 $3,000 to $3,499297 No cash rent
Median gross rent in 2022: $1,070.
Median price asked for vacant for-sale houses and condos in 2022: $215,314.
Estimated median house (or condo) value in 2022 for: White Non-Hispanic householders: $267,000Black or African American householders: $277,222American Indian or Alaska Native householders: $232,309Asian householders: $484,132Some other race householders: $232,309Two or more races householders: $242,530Hispanic or Latino householders: $229,521Estimated median house or condo value in 2022: $270,408
14216:
$270,408New York:
$400,400
Lower value quartile - upper value quartile: $192,293 - $356,208
Mean price in 2022: Detached houses: $278,140Here:
$278,140State:
$476,719
Townhouses or other attached units: $416,061Here:
$416,061State:
$699,270
In 2-unit structures: $234,912Here:
$234,912State:
$713,077
In 3-to-4-unit structures: $51,366Here:
$51,366State:
$764,568
In 5-or-more-unit structures: $1,469,981Here:
$1,469,981State:
$912,009
Housing units in structures:
One, detached: 4,280One, attached: 172Two: 5,0973 or 4: 1,3195 to 9: 48910 to 19: 53420 to 49: 67050 or more: 137Mobile homes: 98Boats, RVs, vans, etc.: 18Unemployment : 2.8%
Means of transportation to work in zip code 14216 75.2% 10,226 Drove a car alone4.8% 652 Carpooled3.3% 452 Bus or trolley bus0.3% 46 Streetcar or trolley car0.1% 12 Railroad1.0% 136 Bicycle3.3% 454 Walked0.3% 40 Other means11.8% 1,603 Worked at homeTravel time to work (commute) in zip code 14216 365 Less than 5 minutes1,145 5 to 9 minutes2,185 10 to 14 minutes2,925 15 to 19 minutes2,608 20 to 24 minutes1,136 25 to 29 minutes930 30 to 34 minutes14 35 to 39 minutes182 40 to 44 minutes61 45 to 59 minutes95 60 to 89 minutes255 90 or more minutes
Neighborhoods in zip code 14216: Percentage of zip code residents living and working in this county: 97.6%
Household type by relationship:
Households: 23,628
Male householders: 5,448 (2,330 living alone ), Female householders: 6,672 (2,840 living alone )3,620 spouses (3,546 opposite-sex spouses ), 1,292 unmarried partners , (1,084 opposite-sex unmarried partners ), 4,448 children (4,219 natural , 62 adopted , 164 stepchildren ), 408 grandchildren , 211 brothers or sisters , 84 parents , 0 foster children , 191 other relatives , 1,343 non-relatives In group quarters: 129 (-1 institutionalized population )
Size of family households: 2,799 2-persons , 1,366 3-persons , 869 4-persons , 323 5-persons , 5 6-persons , 19 7-or-more-persons
Size of nonfamily households: 5,171 1-person , 1,399 2-persons , 268 3-persons , 33 4-persons
1,869 married couples with children. single-parent households (260 men , 1,108 women ).
88.8% of residents of 14216 zip code speak English at home. of residents speak Spanish at home (80% very well, 7% well, 13% not well ).of residents speak other Indo-European language at home (85% very well, 7% well, 8% not well ).of residents speak Asian or Pacific Island language at home (15% very well, 59% well, 27% not well ).of residents speak other language at home (76% very well, 24% well ).
Foreign born population: 1,293 (5.5%)
(79.4%
of them are naturalized citizens )
This zip code:
5.5%Whole state:
22.7%
10% Congo 9% Grenada 6% Togo 6% Iraq 5% Greece 5% Eritrea 5% Cabo Verde 20% Italian 9% Irish 7% German 7% Polish 3% Dutch 3% American 2% Haitian
Year of entry for the foreign-born population
607 2010 or later 322 2000 to 2009 310 1990 to 1999 676 Before 1990
There are
113 Medical Specialists in Zip Code 14216 .
Facilities with environmental interests located in this zip code:
CORVETTE CLEANERS & SHIRT LAUNDERERS (530 KENMORE AVE in BUFFALO, NY)
AIR MINOR (AIRS/AFS) STATE MASTER (New York facility tracking) - AIR PROGRAM Conditionally Exempt Small Quantity Generators, less than 100 kg/month of hazardous waste (Resource Conservation and Recovery Act (tracking hazardous waste)) Business SIC classification: DRYCLEANING PLANTS, EXCEPT RUG CLEANINGBusiness NAICS classification: DRYCLEANING AND LAUNDRY SERVICES (EXCEPT COIN-OPERATED).Organizations: CORVETTE ASSOCIATES (LEGALLY RESPONSIBLE PARTY)
HAROLD WOOD CO (329 HINMAN AVE in BUFFALO, NY)
AIR MINOR (AIRS/AFS) STATE MASTER (New York facility tracking) - AIR PROGRAM, HAZARDOUS WASTE PROGRAM, Small Quantity Generators, between 100 kg and 1000 kg of hazardous waste/month (Resource Conservation and Recovery Act (tracking hazardous waste)) Business SIC classification: COATING, ENGRAVING, AND ALLIED SERVICESBusiness NAICS classification: ALL OTHER MISCELLANEOUS FABRICATED METAL PRODUCT MANUFACTURING.Organizations: HAROLD WOOD CO INC (LEGALLY RESPONSIBLE PARTY)
Alternative names: WOOD HAROLD CO INC
BIG JOHN PLEUNIAK COLLISION INC (2647 DELAWARE AVENUE in BUFFALO, NY)
STATE MASTER (New York facility tracking) - AIR PROGRAM (Resource Conservation and Recovery Act (tracking hazardous waste)) Alternative names: BIG JOHN PLEVNIAK INC
ACME NIPPLE (1930 ELMWOOD AVE in BUFFALO, NY)
(Resource Conservation and Recovery Act (tracking hazardous waste)) Organizations: OWNERNAME (CONTACT/OWNER)
BENDERSON DEVELOPMENT CORP (900 HERTEL AVE in BUFFALO, NY)
Large Quantity Generators, more that 1000 kg of hazardous waste/month (Resource Conservation and Recovery Act (tracking hazardous waste)) - notification
ANDERSON EQUIPMENT CO (101 GREAT ARROW AVE in BUFFALO, NY)
Small Quantity Generators, between 100 kg and 1000 kg of hazardous waste/month (Resource Conservation and Recovery Act (tracking hazardous waste)) - notification USED OIL PROGRAM (Resource Conservation and Recovery Act (tracking hazardous waste)) Organizations: JUDITH L ANDERSON (CONTACT/OWNER)
Alternative names: RUPP RENTAL & SALES CORP
ARTS MINUTEMEN CLEANERS CORP (1256 HERTEL AVE in BUFFALO, NY)
(Resource Conservation and Recovery Act (tracking hazardous waste))
ASPEN DENTAL (2638 DELAWARE AVE in BUFFALO, NY)
Conditionally Exempt Small Quantity Generators, less than 100 kg/month of hazardous waste (Resource Conservation and Recovery Act (tracking hazardous waste)) Organizations: ASPEN DENTAL ASSOC OF NY PC (CONTACT/OPERATOR)
HERTEL COLLISION (940 HERTEL AVE in BUFFALO, NY)
(Resource Conservation and Recovery Act (tracking hazardous waste))
CULLIGAN TOYOTA (973 HERTEL AVE in BUFFALO, NY)
(Resource Conservation and Recovery Act (tracking hazardous waste))
INTER-SHAPES INC (1927 ELMWOOD AVE in BUFFALO, NY)
Conditionally Exempt Small Quantity Generators, less than 100 kg/month of hazardous waste (Resource Conservation and Recovery Act (tracking hazardous waste)) - notification
Housing units lacking complete plumbing facilities: 0.5%
Housing units lacking complete kitchen facilities: 3.1%
91.5% Utility gas 6.3% Electricity 1.4% Bottled, tank, or LP gas
Population in 1990: 24,852.
Place of birth for U.S.-born residents:
This state: 19,034Northeast: 901Midwest: 474South: 972West: 275
56% of the 14216 zip code residents lived in the same house 5 years ago.
Out of people who lived in different houses, 84% lived in this county.
Out of people who lived in different counties, 50% lived in New York.
90% of the 14216 zip code residents lived in the same house 1 year ago.
Out of people who lived in different houses, 68% moved from this county.
Out of people who lived in different houses, 10% moved from different county within same state.
Out of people who lived in different houses, 17% moved from different state.
Out of people who lived in different houses, 4% moved from abroad.
Private vs. public school enrollment:
Students in private schools in grades 1 to 8 (elementary and middle school): 430
Students in private schools in grades 9 to 12 (high school): 230
Students in private undergraduate colleges: 735
Occupation by median earnings in the past 12 months ($)
97,013 Legal occupations 90,971 Architecture and engineering occupations 82,055 Law enforcement workers including supervisors 74,484 Material moving occupations 73,510 Health diagnosing and treating practitioners and other technical occupations 70,523 Computer and mathematical occupations
Companies with federal contracts located in this zip code:
AMERICAN INDUSTRIAL AUCTIONEER (1843 HERTEL AVE in BUFFALO, NY)
$250,000 with Navy for Radar Equipment, Airborne. Signed on 2005-07-20. Completion date: 2005-08-03.
CAMPUS CLEANERS, INC (564 COLVIN AVENUE in BUFFALO, NY; small business)
$2,000 with Air Force for Laundry and DryCleaning Services. Signed on 2004-11-04. Completion date: 2005-03-31.
Top industries in this zip code by the number of employees in 2005:
Accommodation and Food Services: Full-Service Restaurants (50-99 employees: 3 establishments, 20-49 employees: 7 establishments, 10-19 employees: 4 establishments, 5-9 employees: 2 establishments, 1-4 employees: 8 establishments)Accommodation and Food Services: Limited-Service Restaurants (50-99: 1, 20-49: 3, 10-19: 2, 5-9: 6, 1-4: 8)Educational Services: Elementary and Secondary Schools (100-249: 1, 50-99: 1)Other Services (except Public Administration): Religious Organizations (20-49: 3, 10-19: 1, 1-4: 2)Accommodation and Food Services: Snack and Nonalcoholic Beverage Bars (20-49: 1, 10-19: 4)
People in group quarters in 2010:
40 people in group homes intended for adults
13 people in group homes for juveniles (non-correctional)
7 people in other noninstitutional facilities
People in group quarters in 2000:
104 people in nursing homes
20 people in homes for the mentally retarded
19 people in other nonhousehold living situations
17 people in religious group quarters
Fatal accident statistics in 2014:
Fatal accident count: 1Vehicles involved in fatal accidents: 3Fatal accidents caused by drunken drivers: 0Fatalities: 1Persons involved in fatal accidents: 4Pedestrians involved in fatal accidents: 1
Fatal accident statistics in 2010:
Fatal accident count: 1Vehicles involved in fatal accidents: 2Fatal accidents caused by drunken drivers: 0Fatalities: 1Persons involved in fatal accidents: 2Pedestrians involved in fatal accidents: 0
Home Mortgage Disclosure Act Aggregated Statistics For Year 2009(Based on 5 full and 10 partial tracts) A) FHA, FSA/RHS & VA B) Conventional C) Refinancings D) Home Improvement Loans E) Loans on Dwellings For 5+ Families F) Non-occupant Loans on Number Average Value Number Average Value Number Average Value Number Average Value Number Average Value Number Average Value
LOANS ORIGINATED 229 $112,840 184 $146,883 300 $121,331 39 $13,678 4 $625,372 42 $85,757 APPLICATIONS APPROVED, NOT ACCEPTED 6 $118,150 11 $106,153 45 $146,268 5 $43,754 1 $323,590 5 $56,708 APPLICATIONS DENIED 11 $112,333 15 $127,124 123 $108,315 43 $31,087 0 $0 19 $71,354 APPLICATIONS WITHDRAWN 18 $121,422 7 $336,003 102 $114,327 4 $80,785 0 $0 10 $88,589 FILES CLOSED FOR INCOMPLETENESS 4 $65,875 1 $129,000 21 $91,406 2 $24,815 0 $0 0 $0
Aggregated Statistics For Year 2008(Based on 5 full and 10 partial tracts) A) FHA, FSA/RHS & VA B) Conventional C) Refinancings D) Home Improvement Loans E) Loans on Dwellings For 5+ Families F) Non-occupant Loans on G) Loans On Manufactured Number Average Value Number Average Value Number Average Value Number Average Value Number Average Value Number Average Value Number Average Value
LOANS ORIGINATED 150 $111,342 248 $113,066 174 $117,713 69 $28,053 11 $1,087,381 63 $79,887 0 $0 APPLICATIONS APPROVED, NOT ACCEPTED 4 $92,252 20 $123,460 29 $134,686 8 $213,218 0 $0 6 $94,715 0 $0 APPLICATIONS DENIED 19 $121,962 47 $98,811 147 $110,611 86 $33,450 1 $180,000 24 $78,217 2 $30,895 APPLICATIONS WITHDRAWN 13 $117,418 11 $108,290 55 $111,836 7 $111,280 0 $0 8 $78,466 0 $0 FILES CLOSED FOR INCOMPLETENESS 7 $109,330 4 $95,745 20 $105,123 1 $52,000 0 $0 8 $92,865 0 $0
Aggregated Statistics For Year 2007(Based on 5 full and 10 partial tracts) A) FHA, FSA/RHS & VA B) Conventional C) Refinancings D) Home Improvement Loans E) Loans on Dwellings For 5+ Families F) Non-occupant Loans on G) Loans On Manufactured Number Average Value Number Average Value Number Average Value Number Average Value Number Average Value Number Average Value Number Average Value
LOANS ORIGINATED 81 $115,233 388 $109,829 235 $106,391 124 $37,285 6 $705,715 99 $80,015 0 $0 APPLICATIONS APPROVED, NOT ACCEPTED 1 $51,810 39 $80,315 55 $124,117 26 $24,377 0 $0 11 $77,701 0 $0 APPLICATIONS DENIED 13 $84,218 50 $71,527 213 $97,921 127 $26,254 1 $281,600 33 $72,848 2 $129,365 APPLICATIONS WITHDRAWN 3 $72,907 41 $90,783 145 $99,972 9 $73,863 0 $0 23 $73,663 0 $0 FILES CLOSED FOR INCOMPLETENESS 5 $100,798 22 $93,257 33 $126,718 1 $80,000 0 $0 5 $137,158 0 $0
Aggregated Statistics For Year 2006(Based on 5 full and 10 partial tracts) A) FHA, FSA/RHS & VA B) Conventional C) Refinancings D) Home Improvement Loans E) Loans on Dwellings For 5+ Families F) Non-occupant Loans on G) Loans On Manufactured Number Average Value Number Average Value Number Average Value Number Average Value Number Average Value Number Average Value Number Average Value
LOANS ORIGINATED 109 $96,680 435 $88,913 276 $91,582 141 $29,357 10 $2,136,788 134 $71,800 4 $67,185 APPLICATIONS APPROVED, NOT ACCEPTED 0 $0 32 $81,330 77 $94,335 20 $25,654 3 $58,577 17 $95,014 0 $0 APPLICATIONS DENIED 3 $77,577 82 $77,304 268 $87,470 173 $23,826 1 $244,000 70 $59,496 5 $52,168 APPLICATIONS WITHDRAWN 4 $73,495 41 $71,982 171 $103,890 15 $74,728 1 $96,000 17 $65,998 3 $127,927 FILES CLOSED FOR INCOMPLETENESS 1 $99,000 24 $65,064 73 $118,345 4 $45,078 0 $0 9 $77,627 0 $0
Aggregated Statistics For Year 2005(Based on 5 full and 10 partial tracts) A) FHA, FSA/RHS & VA B) Conventional C) Refinancings D) Home Improvement Loans E) Loans on Dwellings For 5+ Families F) Non-occupant Loans on G) Loans On Manufactured Number Average Value Number Average Value Number Average Value Number Average Value Number Average Value Number Average Value Number Average Value
LOANS ORIGINATED 87 $92,905 495 $92,188 316 $96,652 96 $33,355 4 $750,885 146 $72,335 0 $0 APPLICATIONS APPROVED, NOT ACCEPTED 2 $73,635 41 $100,290 88 $94,539 20 $28,314 1 $713,000 12 $65,480 1 $23,650 APPLICATIONS DENIED 9 $74,801 69 $70,931 286 $94,513 147 $31,336 3 $376,070 45 $42,459 4 $49,138 APPLICATIONS WITHDRAWN 4 $92,340 29 $83,127 182 $93,070 28 $92,047 2 $74,635 17 $78,339 2 $54,745 FILES CLOSED FOR INCOMPLETENESS 7 $76,617 16 $88,580 86 $106,999 2 $19,080 0 $0 11 $101,920 0 $0
Aggregated Statistics For Year 2004(Based on 5 full and 10 partial tracts) A) FHA, FSA/RHS & VA B) Conventional C) Refinancings D) Home Improvement Loans E) Loans on Dwellings For 5+ Families F) Non-occupant Loans on G) Loans On Manufactured Number Average Value Number Average Value Number Average Value Number Average Value Number Average Value Number Average Value Number Average Value
LOANS ORIGINATED 81 $97,201 472 $89,958 391 $88,081 66 $46,901 18 $281,032 133 $72,377 0 $0 APPLICATIONS APPROVED, NOT ACCEPTED 0 $0 41 $92,895 88 $106,304 17 $25,329 2 $872,740 9 $74,212 2 $74,455 APPLICATIONS DENIED 9 $79,640 47 $78,425 299 $82,433 93 $26,996 7 $582,471 26 $65,578 2 $6,275 APPLICATIONS WITHDRAWN 12 $85,003 35 $92,421 158 $93,449 13 $54,171 4 $93,375 14 $70,131 0 $0 FILES CLOSED FOR INCOMPLETENESS 3 $100,430 31 $80,277 96 $98,485 2 $24,000 0 $0 13 $66,375 0 $0
Aggregated Statistics For Year 2003(Based on 5 full and 10 partial tracts) A) FHA, FSA/RHS & VA B) Conventional C) Refinancings D) Home Improvement Loans E) Loans on Dwellings For 5+ Families F) Non-occupant Loans on Number Average Value Number Average Value Number Average Value Number Average Value Number Average Value Number Average Value
LOANS ORIGINATED 115 $86,049 376 $92,543 755 $84,895 42 $26,846 2 $2,062,840 105 $66,295 APPLICATIONS APPROVED, NOT ACCEPTED 8 $71,974 28 $90,917 108 $76,191 10 $42,058 1 $128,000 15 $76,348 APPLICATIONS DENIED 20 $77,904 41 $94,551 323 $78,486 77 $17,904 0 $0 38 $74,390 APPLICATIONS WITHDRAWN 7 $97,806 30 $94,620 194 $84,046 7 $31,709 0 $0 12 $63,280 FILES CLOSED FOR INCOMPLETENESS 0 $0 11 $46,375 42 $87,894 3 $11,927 0 $0 6 $65,082
Aggregated Statistics For Year 2002(Based on 5 full and 10 partial tracts) A) FHA, FSA/RHS & VA B) Conventional C) Refinancings D) Home Improvement Loans E) Loans on Dwellings For 5+ Families F) Non-occupant Loans on Number Average Value Number Average Value Number Average Value Number Average Value Number Average Value Number Average Value
LOANS ORIGINATED 129 $78,338 330 $87,848 451 $80,893 61 $14,869 4 $295,085 96 $65,150 APPLICATIONS APPROVED, NOT ACCEPTED 0 $0 21 $118,664 96 $78,089 21 $19,317 0 $0 7 $68,011 APPLICATIONS DENIED 5 $76,804 34 $56,244 262 $72,785 86 $19,825 0 $0 33 $60,339 APPLICATIONS WITHDRAWN 7 $67,563 27 $60,689 142 $78,261 15 $24,637 0 $0 7 $91,869 FILES CLOSED FOR INCOMPLETENESS 0 $0 11 $56,438 43 $83,190 1 $26,040 0 $0 3 $59,507
Aggregated Statistics For Year 2001(Based on 5 full and 10 partial tracts) A) FHA, FSA/RHS & VA B) Conventional C) Refinancings D) Home Improvement Loans E) Loans on Dwellings For 5+ Families F) Non-occupant Loans on Number Average Value Number Average Value Number Average Value Number Average Value Number Average Value Number Average Value
LOANS ORIGINATED 123 $71,631 318 $77,875 444 $84,850 60 $12,506 6 $340,993 86 $56,790 APPLICATIONS APPROVED, NOT ACCEPTED 5 $91,374 29 $69,730 70 $89,626 13 $15,055 1 $135,170 12 $68,546 APPLICATIONS DENIED 14 $76,269 40 $51,007 289 $65,147 79 $15,397 0 $0 37 $60,537 APPLICATIONS WITHDRAWN 6 $59,495 16 $75,336 205 $80,254 9 $30,839 0 $0 6 $54,342 FILES CLOSED FOR INCOMPLETENESS 3 $48,887 7 $64,001 25 $74,924 0 $0 0 $0 2 $28,560
Aggregated Statistics For Year 2000(Based on 5 full and 10 partial tracts) A) FHA, FSA/RHS & VA B) Conventional C) Refinancings D) Home Improvement Loans E) Loans on Dwellings For 5+ Families F) Non-occupant Loans on Number Average Value Number Average Value Number Average Value Number Average Value Number Average Value Number Average Value
LOANS ORIGINATED 139 $70,326 330 $83,314 159 $64,513 90 $14,770 7 $1,976,627 47 $65,757 APPLICATIONS APPROVED, NOT ACCEPTED 4 $59,930 32 $87,403 56 $59,005 48 $14,690 0 $0 7 $24,354 APPLICATIONS DENIED 14 $71,013 43 $55,908 286 $59,138 113 $20,993 1 $183,040 15 $52,631 APPLICATIONS WITHDRAWN 6 $75,500 25 $77,984 102 $60,377 18 $37,979 0 $0 8 $33,409 FILES CLOSED FOR INCOMPLETENESS 0 $0 11 $61,931 25 $76,549 2 $785 0 $0 1 $63,000
Aggregated Statistics For Year 1999(Based on 3 full and 5 partial tracts) A) FHA, FSA/RHS & VA B) Conventional C) Refinancings D) Home Improvement Loans E) Loans on Dwellings For 5+ Families F) Non-occupant Loans on Number Average Value Number Average Value Number Average Value Number Average Value Number Average Value Number Average Value
LOANS ORIGINATED 92 $69,561 135 $79,963 179 $77,222 64 $13,138 3 $383,263 23 $52,390 APPLICATIONS APPROVED, NOT ACCEPTED 3 $46,627 18 $60,022 49 $61,891 20 $13,196 0 $0 7 $45,636 APPLICATIONS DENIED 8 $54,630 18 $62,126 130 $56,869 64 $18,917 0 $0 16 $38,992 APPLICATIONS WITHDRAWN 2 $93,590 7 $55,217 73 $57,075 13 $40,362 0 $0 5 $58,050 FILES CLOSED FOR INCOMPLETENESS 2 $110,645 1 $50,640 20 $67,838 1 $13,000 0 $0 1 $73,800
Private Mortgage Insurance Companies Aggregated Statistics For Year 2009(Based on 5 full and 10 partial tracts) A) Conventional B) Refinancings C) Non-occupant Loans on Number Average Value Number Average Value Number Average Value
LOANS ORIGINATED 49 $144,770 20 $170,496 0 $0 APPLICATIONS APPROVED, NOT ACCEPTED 11 $96,861 7 $91,507 1 $80,000 APPLICATIONS DENIED 8 $100,750 10 $109,303 0 $0 APPLICATIONS WITHDRAWN 3 $102,383 0 $0 0 $0 FILES CLOSED FOR INCOMPLETENESS 0 $0 0 $0 0 $0
Aggregated Statistics For Year 2008(Based on 5 full and 10 partial tracts) A) Conventional B) Refinancings C) Non-occupant Loans on Number Average Value Number Average Value Number Average Value
LOANS ORIGINATED 118 $105,160 16 $158,731 13 $62,295 APPLICATIONS APPROVED, NOT ACCEPTED 25 $108,366 17 $106,188 8 $89,895 APPLICATIONS DENIED 15 $85,024 3 $144,250 8 $56,225 APPLICATIONS WITHDRAWN 10 $109,273 0 $0 0 $0 FILES CLOSED FOR INCOMPLETENESS 4 $131,550 2 $73,635 2 $73,635
Aggregated Statistics For Year 2007(Based on 5 full and 10 partial tracts) A) Conventional B) Refinancings C) Non-occupant Loans on Number Average Value Number Average Value Number Average Value
LOANS ORIGINATED 180 $95,134 29 $118,210 34 $89,460 APPLICATIONS APPROVED, NOT ACCEPTED 22 $80,226 7 $121,871 2 $72,200 APPLICATIONS DENIED 2 $93,355 0 $0 0 $0 APPLICATIONS WITHDRAWN 8 $69,950 10 $106,570 3 $72,973 FILES CLOSED FOR INCOMPLETENESS 0 $0 0 $0 0 $0
Aggregated Statistics For Year 2006(Based on 5 full and 10 partial tracts) A) Conventional B) Refinancings C) Non-occupant Loans on Number Average Value Number Average Value Number Average Value
LOANS ORIGINATED 145 $87,856 27 $159,110 26 $75,306 APPLICATIONS APPROVED, NOT ACCEPTED 22 $75,975 0 $0 9 $57,950 APPLICATIONS DENIED 2 $61,385 0 $0 2 $49,790 APPLICATIONS WITHDRAWN 2 $67,665 2 $114,235 0 $0 FILES CLOSED FOR INCOMPLETENESS 1 $77,000 0 $0 0 $0
Aggregated Statistics For Year 2005(Based on 5 full and 10 partial tracts) A) Conventional B) Refinancings C) Non-occupant Loans on Number Average Value Number Average Value Number Average Value
LOANS ORIGINATED 178 $87,690 27 $101,185 48 $72,237 APPLICATIONS APPROVED, NOT ACCEPTED 26 $83,559 6 $73,882 0 $0 APPLICATIONS DENIED 0 $0 0 $0 0 $0 APPLICATIONS WITHDRAWN 5 $127,964 7 $91,203 0 $0 FILES CLOSED FOR INCOMPLETENESS 2 $76,880 0 $0 0 $0
Aggregated Statistics For Year 2004(Based on 5 full and 10 partial tracts) A) Conventional B) Refinancings C) Non-occupant Loans on Number Average Value Number Average Value Number Average Value
LOANS ORIGINATED 209 $82,413 43 $87,333 32 $72,925 APPLICATIONS APPROVED, NOT ACCEPTED 35 $93,712 16 $102,769 2 $60,300 APPLICATIONS DENIED 4 $68,780 3 $62,970 0 $0 APPLICATIONS WITHDRAWN 11 $73,814 5 $76,826 2 $33,750 FILES CLOSED FOR INCOMPLETENESS 0 $0 1 $103,000 0 $0
Aggregated Statistics For Year 2003(Based on 5 full and 10 partial tracts) A) Conventional B) Refinancings C) Non-occupant Loans on Number Average Value Number Average Value Number Average Value
LOANS ORIGINATED 201 $89,171 102 $87,582 17 $79,096 APPLICATIONS APPROVED, NOT ACCEPTED 36 $75,016 31 $86,324 0 $0 APPLICATIONS DENIED 6 $67,052 2 $79,500 2 $56,720 APPLICATIONS WITHDRAWN 8 $84,412 6 $69,698 3 $76,350 FILES CLOSED FOR INCOMPLETENESS 0 $0 0 $0 0 $0
Aggregated Statistics For Year 2002(Based on 5 full and 10 partial tracts) A) Conventional B) Refinancings C) Non-occupant Loans on Number Average Value Number Average Value Number Average Value
LOANS ORIGINATED 161 $79,620 70 $86,632 31 $61,918 APPLICATIONS APPROVED, NOT ACCEPTED 27 $72,878 21 $88,440 7 $62,646 APPLICATIONS DENIED 3 $70,410 2 $71,645 0 $0 APPLICATIONS WITHDRAWN 3 $153,397 6 $124,095 1 $84,000 FILES CLOSED FOR INCOMPLETENESS 0 $0 2 $74,455 0 $0
Aggregated Statistics For Year 2001(Based on 5 full and 10 partial tracts) A) Conventional B) Refinancings C) Non-occupant Loans on Number Average Value Number Average Value Number Average Value
LOANS ORIGINATED 139 $74,288 50 $86,678 14 $48,911 APPLICATIONS APPROVED, NOT ACCEPTED 14 $109,179 5 $77,142 2 $53,920 APPLICATIONS DENIED 8 $67,350 2 $83,390 3 $68,593 APPLICATIONS WITHDRAWN 1 $39,000 6 $97,348 2 $48,500 FILES CLOSED FOR INCOMPLETENESS 1 $129,540 2 $81,590 0 $0
Aggregated Statistics For Year 2000(Based on 5 full and 10 partial tracts) A) Conventional B) Refinancings C) Non-occupant Loans on Number Average Value Number Average Value Number Average Value
LOANS ORIGINATED 143 $81,207 14 $112,727 8 $84,345 APPLICATIONS APPROVED, NOT ACCEPTED 18 $85,139 2 $90,220 1 $60,000 APPLICATIONS DENIED 8 $70,280 2 $58,570 0 $0 APPLICATIONS WITHDRAWN 0 $0 0 $0 0 $0 FILES CLOSED FOR INCOMPLETENESS 2 $57,575 0 $0 0 $0
Aggregated Statistics For Year 1999(Based on 3 full and 5 partial tracts) A) Conventional B) Refinancings C) Non-occupant Loans on Number Average Value Number Average Value Number Average Value
LOANS ORIGINATED 57 $73,988 17 $85,734 4 $61,118 APPLICATIONS APPROVED, NOT ACCEPTED 3 $99,447 1 $89,200 0 $0 APPLICATIONS DENIED 4 $55,758 0 $0 0 $0 APPLICATIONS WITHDRAWN 0 $0 2 $58,815 0 $0 FILES CLOSED FOR INCOMPLETENESS 0 $0 1 $93,850 0 $0
2003 - 2018 National Fire Incident Reporting System (NFIRS) incidents See full 2006 National Fire Incident Reporting System statistics for zip code 14216, New York
Most common first names in zip code 14216 among deceased individuals Name Count Lived (average)
Mary 317 80.1 years Joseph 272 74.8 years John 263 76.5 years William 182 75.3 years Rose 148 81.0 years Charles 148 73.9 years Helen 133 78.2 years Anna 131 83.3 years James 130 72.4 years Margaret 119 80.2 years
Most common last names in zip code 14216 among deceased individuals Last name Count Lived (average)
Smith 53 78.5 years Cohen 44 79.1 years Miller 39 80.8 years Brown 27 74.5 years Battaglia 23 77.8 years Goldstein 21 75.7 years Kelly 20 74.4 years Johnson 19 76.1 years Robinson 19 77.4 years Ryan 19 73.4 years
Businesses in zip code 14216
Name Count Name Count
7-Eleven 1 Marshalls 2 AT&T 2 McDonald's 1 Applebee's 1 New Balance 1 Blockbuster 1 Nike 3 Burger King 1 Payless 1 CVS 1 RadioShack 1 Cold Stone Creamery 1 Sprint Nextel 1 Cricket Wireless 1 Subway 2 Dennys 1 T-Mobile 3 Dunkin Donuts 1 Target 1 FedEx 1 Tim Hortons 1 GNC 1 True Value 1 GameStop 2 UPS 1 Jones New York 1 Walgreens 1 Kmart 1 YMCA 1 Kohl's 1


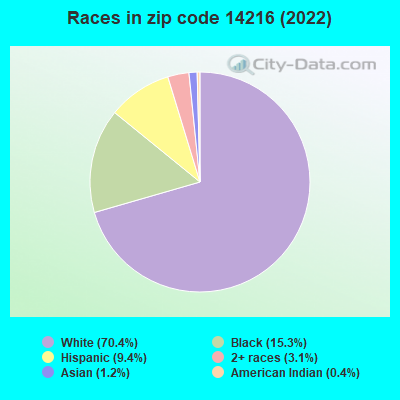


 Nearest zip codes: 14214, 14217, 14223, 14222, 14208, 14209.
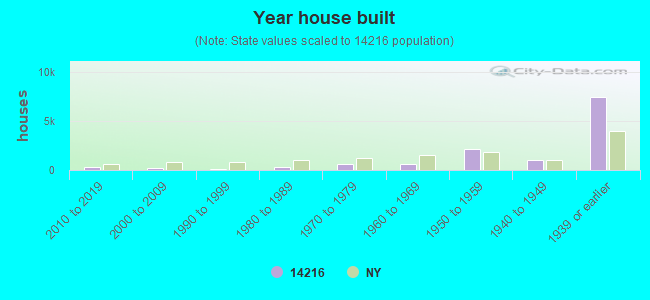

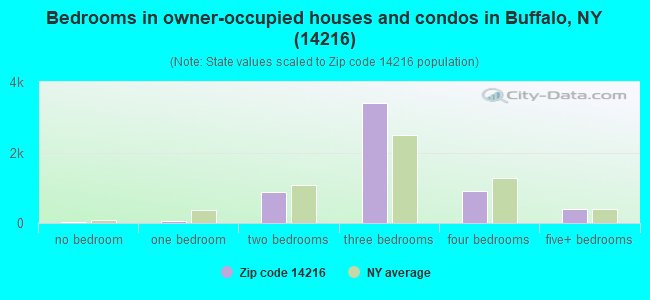
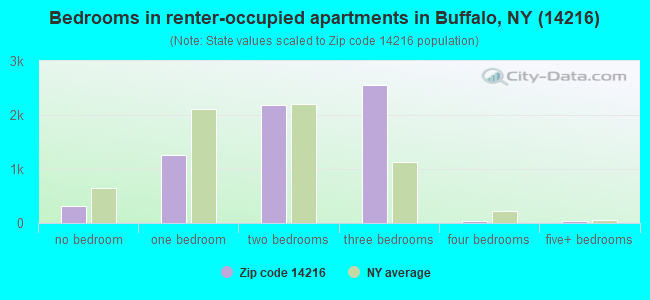
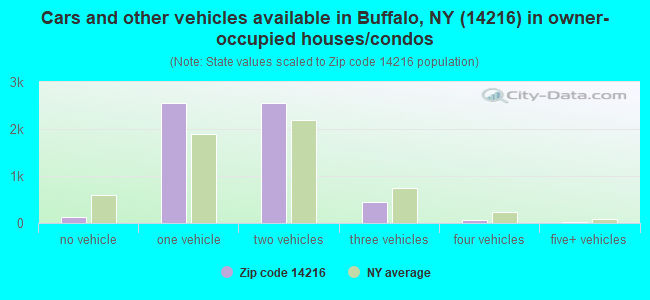
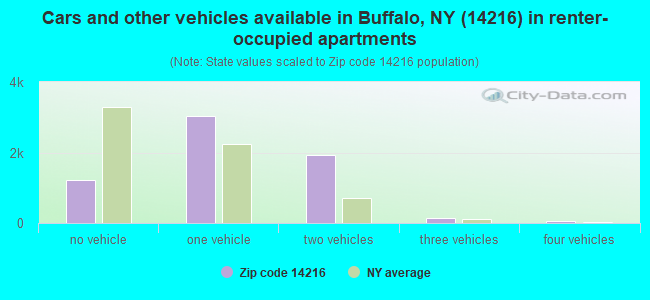


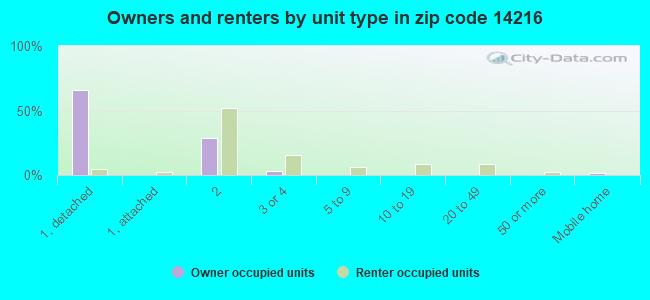
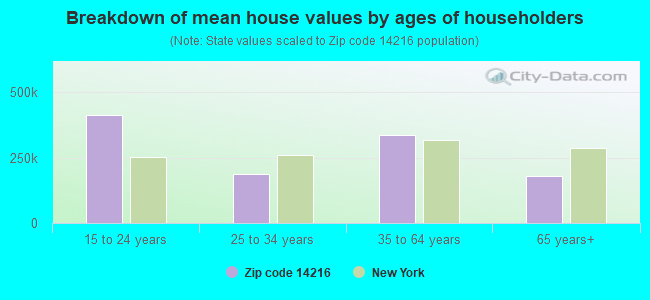


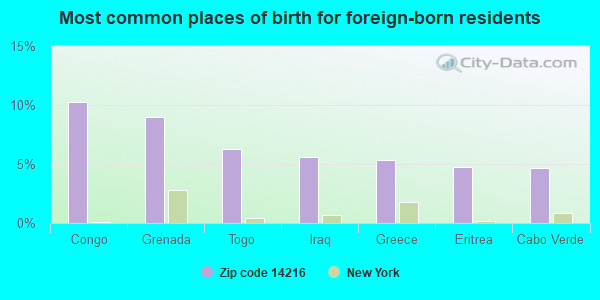
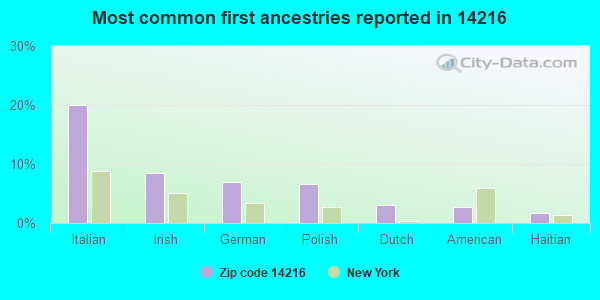
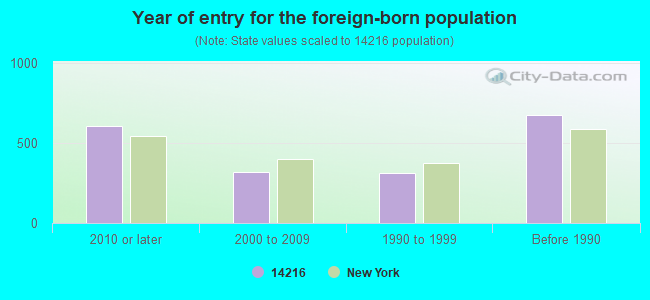


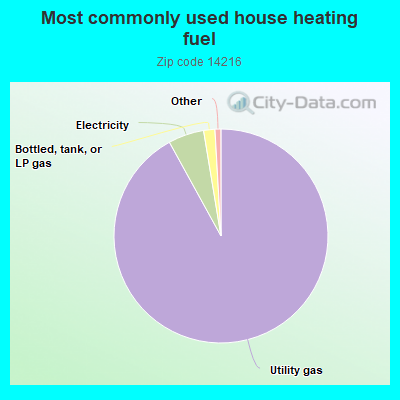
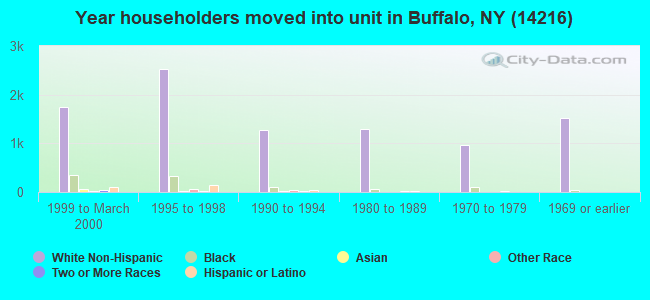
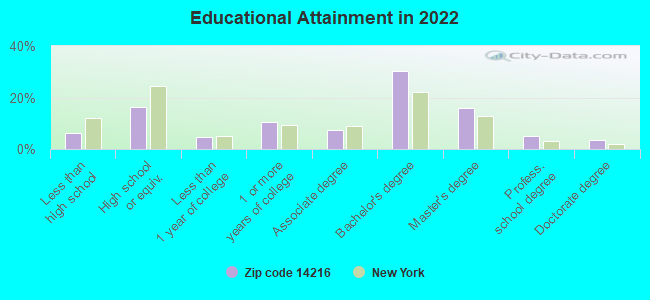
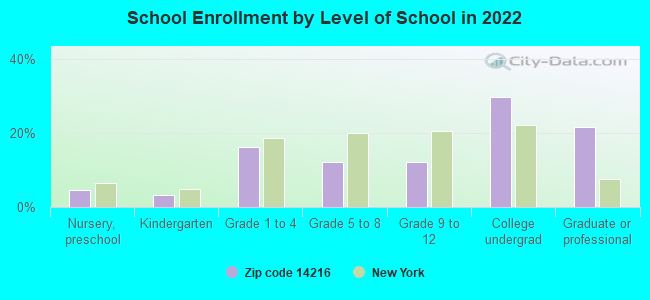
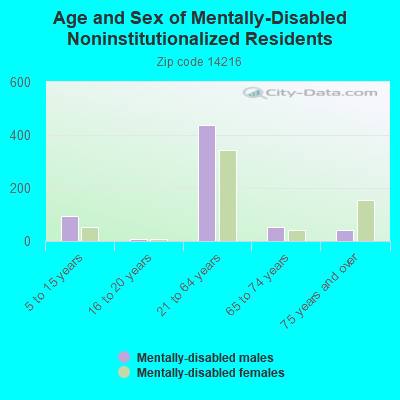

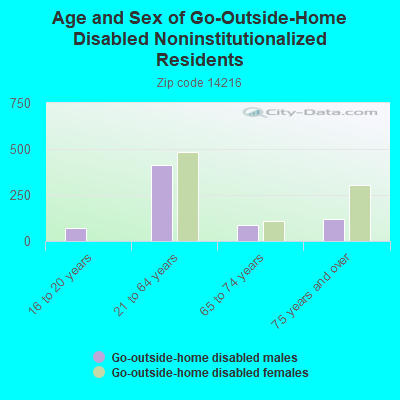
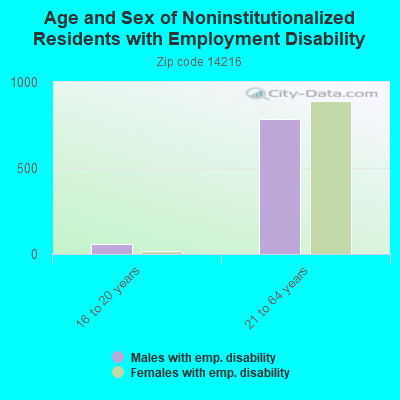
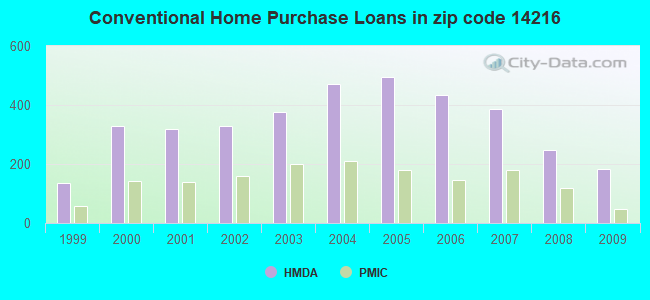
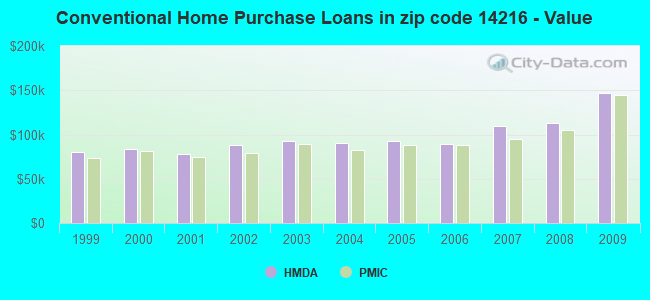
 According to the data from the years 2003 - 2018 the average number of fires per year is 13. The highest number of reported fire incidents - 42 took place in 2016, and the least - 0 in 2010. The data has a growing trend.
 When looking into fire subcategories, the most incidents belonged to: Structure Fires (48.3%), and Other (21.7%).