Estimated zip code population in 2022: 21,762 Zip code population in 2010: 19,775 Zip code population in 2000: 21,860
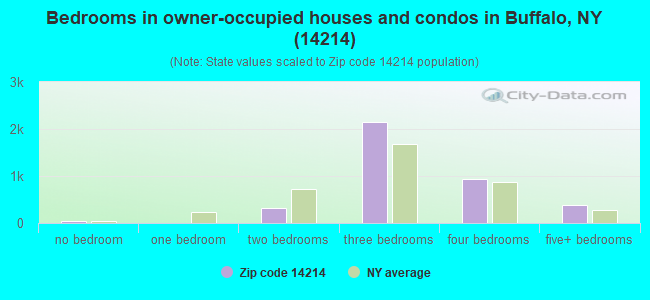
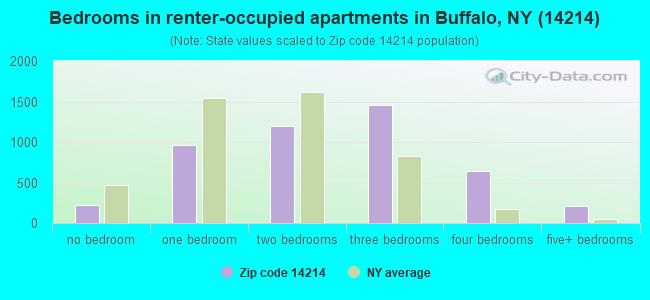
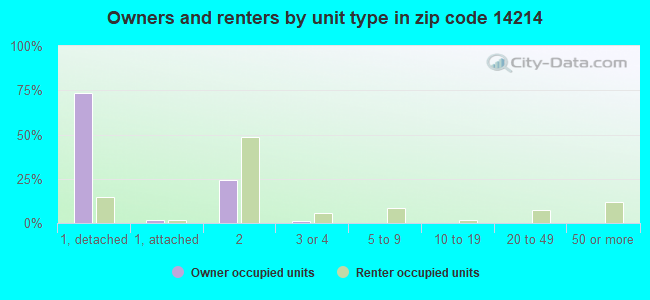
Houses and condos: 9,401 Renter-occupied apartments: 4,725
% of renters here:
55%
State:
46%
March 2022 cost of living index in zip code 14214: 102.4 (near average, U.S. average is 100)
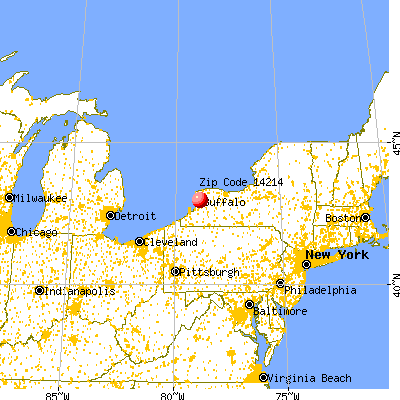
Land area: 2.9 sq. mi. Water area: 0.0 sq. mi.
Population density: 7,559 people per square mile
(high).
OSM Map
General Map
Google Map
MSN Map
OSM Map
General Map
Google Map
MSN Map
OSM Map
General Map
Google Map
MSN Map
OSM Map
General Map
Google Map
MSN Map
Please wait while loading the map...
Real estate property taxes paid for housing units in 2022:
This zip code:
1.2% ($2,625)
New York:
1.5% ($6,180)
Median real estate property taxes paid for housing units with mortgages in 2022: $3,437 (1.3%) Median real estate property taxes paid for housing units with no mortgage in 2022: $1,654 (1.1%)
Business Search- 14 Million verified businesses
Males: 11,629
(53.4%)
Females: 10,132
(46.6%)
For population 25 years and over in 14214:
High school or higher: 91.8%
Bachelor's degree or higher: 49.8%
Graduate or professional degree: 29.3%
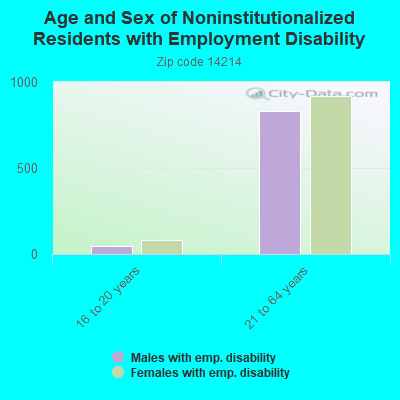
Unemployed: 3.8%
Mean travel time to work (commute): 18.5 minutes
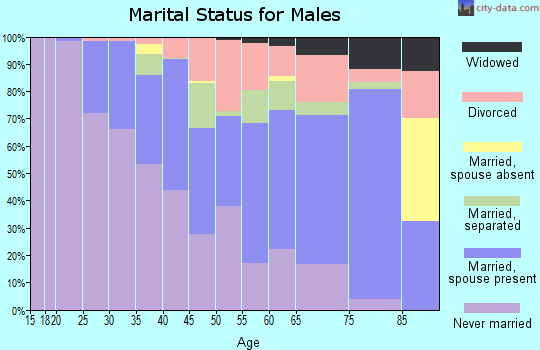
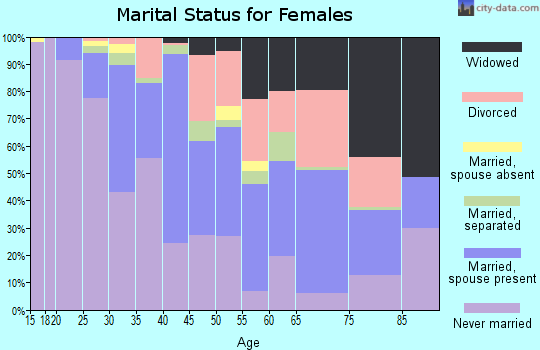
For population 15 years and over in 14214:
Never married: 57.6%
Now married: 29.1%
Separated: 2.1%
Widowed: 3.2%
Divorced: 8.0%
Zip code 14214 compared to state average:
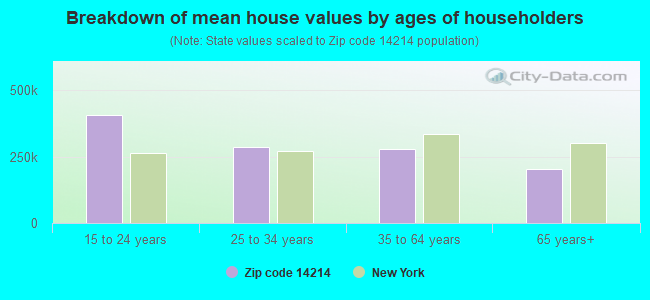
Median house value below state average.
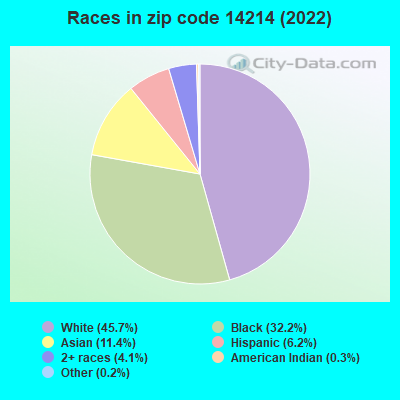
Black race population percentage above state average.
Hispanic race population percentage significantly below state average.
Median age significantly below state average.
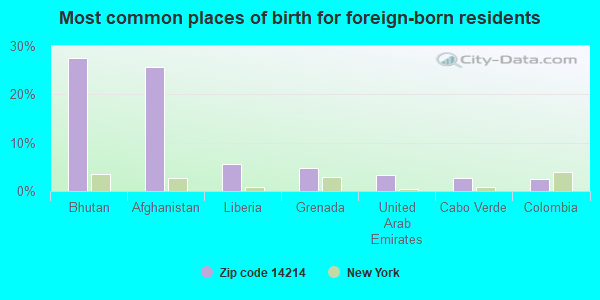
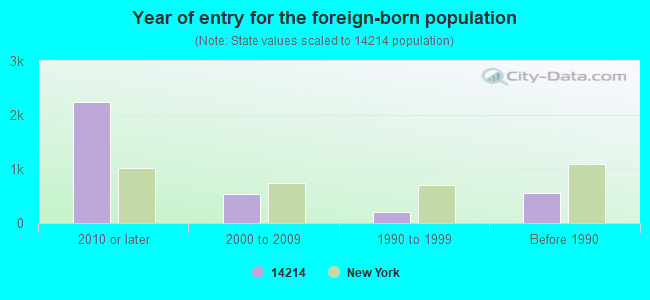
Foreign-born population percentage below state average.
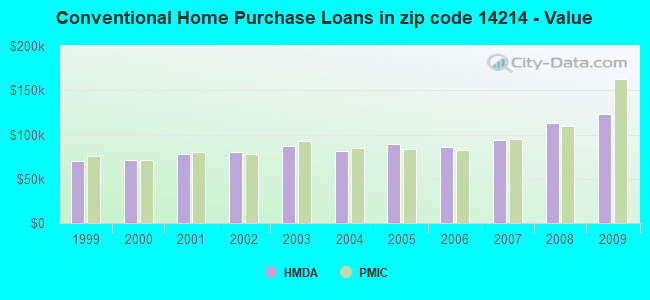
Estimated median house/condo value in 2022: $213,387
14214:
$213,387
New York:
$400,400
According to our research of New York and other state lists, there were 20 registered sex offenders living in 14214 zip code as of April 27, 2024. The ratio of all residents to sex offenders in zip code 14214 is 1,034 to 1. The ratio of registered sex offenders to all residents in this zip code is near the state average.
Median resident age:
This zip code:
29.2 years
New York median age:
40.0 years
Average household size:
This zip code:
2.4 people
New York:
2.5 people
Averages for the 2020 tax year for zip code 14214, filed in 2021:
Average Adjusted Gross Income (AGI) in 2020: $58,930 (Individual Income Tax Returns)
Here:
$58,930
State:
$90,930
Salary/wage: $48,392 (reported on 84.7% of returns)
Here:
$48,392
State:
$72,104
(% of AGI for various income ranges: 1130.2% for AGIs below $25k, 3506.1% for AGIs $25k-50k, 6904.2% for AGIs $50k-75k, 9974.4% for AGIs $75k-100k, 17664.3% for AGIs $100k-200k, 73674.0% for AGIs over 200k)
Taxable interest for individuals: $1,022 (reported on 25.3% of returns)
This zip code:
$1,022
New York:
$3,075
(% of AGI for various income ranges: 5.1% for AGIs below $25k, 9.6% for AGIs $25k-50k, 20.1% for AGIs $50k-75k, 71.7% for AGIs $75k-100k, 114.5% for AGIs $100k-200k, 873.0% for AGIs over 200k)
Ordinary dividends: $5,165 (reported on 15.9% of returns)
Here:
$5,165
State:
$11,095
(% of AGI for various income ranges: 15.4% for AGIs below $25k, 16.1% for AGIs $25k-50k, 55.3% for AGIs $50k-75k, 156.9% for AGIs $75k-100k, 412.6% for AGIs $100k-200k, 3143.0% for AGIs over 200k)
Net capital gain/loss in AGI: +$9,808 (reported on 14.4% of returns)
Here:
+$9,808
State:
+$44,925
(% of AGI for various income ranges: 6.9% for AGIs below $25k, 15.8% for AGIs $25k-50k, 55.7% for AGIs $50k-75k, 145.0% for AGIs $75k-100k, 549.8% for AGIs $100k-200k, 7600.0% for AGIs over 200k)
Profit/loss from business: +$14,796 (reported on 14.1% of returns)
Here:
+$14,796
State:
+$14,940
(% of AGI for various income ranges: 54.7% for AGIs below $25k, 72.2% for AGIs $25k-50k, 138.5% for AGIs $50k-75k, 329.2% for AGIs $75k-100k, 699.1% for AGIs $100k-200k, 8895.0% for AGIs over 200k)
Taxable individual retirement arrangement distribution: $15,522 (reported on 5.6% of returns)
14214:
$15,522
New York:
$19,609
(% of AGI for various income ranges: 24.4% for AGIs below $25k, 37.6% for AGIs $25k-50k, 123.6% for AGIs $50k-75k, 262.2% for AGIs $75k-100k, 623.2% for AGIs $100k-200k, 1080.0% for AGIs over 200k)
Self-employed (Keogh) retirement plans: $24,029 (reported on 0.9% of returns)
14214:
$24,029
New York:
$32,497
(% of AGI for various income ranges: 102.6% for AGIs $100k-200k, 1200.0% for AGIs over 200k)
Total itemized deductions: $29,571 (reported on 4.3% of returns)
Here:
$29,571
State:
$39,326
(% of AGI for various income ranges: 63.4% for AGIs $25k-50k, 155.3% for AGIs $50k-75k, 199.2% for AGIs $75k-100k, 651.3% for AGIs $100k-200k, 4243.0% for AGIs over 200k)
Charity contributions: $10,731 (reported on 3.5% of returns)
Here:
$10,731
State:
$15,420
(% of AGI for various income ranges: 8.3% for AGIs $25k-50k, 35.7% for AGIs $50k-75k, 35.6% for AGIs $75k-100k, 181.7% for AGIs $100k-200k, 1712.0% for AGIs over 200k)
Taxes paid: $7,909 (reported on 4.3% of returns)
14214:
$7,909
State:
$9,183
(% of AGI for various income ranges: 7.5% for AGIs $25k-50k, 35.7% for AGIs $50k-75k, 78.9% for AGIs $75k-100k, 198.3% for AGIs $100k-200k, 1148.0% for AGIs over 200k)
Earned income credit: $2,220 (reported on 19.6% of returns)
Here:
$2,220
State:
$2,138
(% of AGI for various income ranges: 89.4% for AGIs below $25k, 78.5% for AGIs $25k-50k)
Percentage of individuals using paid preparers for their 2020 taxes: 94.6%
Here:
95%
State:
95%
(% for various income ranges: 94.4% for AGIs below $25k, 95.7% for AGIs $25k-50k, 94.4% for AGIs $50k-75k, 93.0% for AGIs $75k-100k, 93.1% for AGIs $100k-200k, 97.0% for AGIs over 200k)
Averages for the 2012 tax year for zip code 14214, filed in 2013:
Average Adjusted Gross Income (AGI) in 2012: $49,113 (Individual Income Tax Returns)
Here:
$49,113
State:
$77,088
Salary/wage: $41,411 (reported on 87.6% of returns)
Here:
$41,411
State:
$60,593
(% of AGI for various income ranges: 80.3% for AGIs below $25k, 86.7% for AGIs $25k-50k, 80.3% for AGIs $50k-75k, 74.0% for AGIs $75k-100k, 72.4% for AGIs $100k-200k, 57.8% for AGIs over 200k)
Taxable interest for individuals: $1,385 (reported on 30.0% of returns)
This zip code:
$1,385
New York:
$3,125
(% of AGI for various income ranges: 0.5% for AGIs below $25k, 0.2% for AGIs $25k-50k, 0.4% for AGIs $50k-75k, 0.3% for AGIs $75k-100k, 0.4% for AGIs $100k-200k, 2.5% for AGIs over 200k)
Ordinary dividends: $4,515 (reported on 15.5% of returns)
Here:
$4,515
State:
$10,299
(% of AGI for various income ranges: 0.8% for AGIs below $25k, 0.5% for AGIs $25k-50k, 1.1% for AGIs $50k-75k, 1.1% for AGIs $75k-100k, 1.3% for AGIs $100k-200k, 3.0% for AGIs over 200k)
Net capital gain/loss in AGI: +$7,217 (reported on 10.7% of returns)
Here:
+$7,217
State:
+$42,474
(% of AGI for various income ranges: 0.4% for AGIs $50k-75k, 0.4% for AGIs $75k-100k, 0.9% for AGIs $100k-200k, 5.7% for AGIs over 200k)
Profit/loss from business: +$15,592 (reported on 12.8% of returns)
Here:
+$15,592
State:
+$16,168
(% of AGI for various income ranges: 5.1% for AGIs below $25k, 1.4% for AGIs $25k-50k, 2.3% for AGIs $50k-75k, 3.5% for AGIs $75k-100k, 4.1% for AGIs $100k-200k, 6.9% for AGIs over 200k)
Taxable individual retirement arrangement distribution: $11,850 (reported on 6.6% of returns)
14214:
$11,850
New York:
$17,621
(% of AGI for various income ranges: 1.2% for AGIs below $25k, 1.1% for AGIs $25k-50k, 1.6% for AGIs $50k-75k, 2.0% for AGIs $75k-100k, 2.5% for AGIs $100k-200k, 1.1% for AGIs over 200k)
Self-employment retirement plans: $22,550 (reported on 1.1% of returns)
14214:
$22,550
New York:
$27,330
Total itemized deductions: $21,971 (17% of AGI, reported on 21.3% of returns)
Here:
$21,971
State:
$34,985
Here:
17.3% of AGI
State:
21.3% of AGI
(% of AGI for various income ranges: 3.3% for AGIs below $25k, 4.5% for AGIs $25k-50k, 8.2% for AGIs $50k-75k, 10.4% for AGIs $75k-100k, 13.2% for AGIs $100k-200k, 13.3% for AGIs over 200k)
Charity contributions: $4,225 (reported on 18.8% of returns)
Here:
$4,225
State:
$5,572
(% of AGI for various income ranges: 0.3% for AGIs below $25k, 0.6% for AGIs $25k-50k, 1.5% for AGIs $50k-75k, 1.8% for AGIs $75k-100k, 2.4% for AGIs $100k-200k, 2.3% for AGIs over 200k)
Taxes paid: $11,093 (reported on 21.1% of returns)
14214:
$11,093
State:
$18,656
(% of AGI for various income ranges: 0.7% for AGIs below $25k, 1.4% for AGIs $25k-50k, 3.2% for AGIs $50k-75k, 4.6% for AGIs $75k-100k, 6.7% for AGIs $100k-200k, 8.6% for AGIs over 200k)
Earned income credit: $2,118 (reported on 23.9% of returns)
Here:
$2,118
State:
$2,230
(% of AGI for various income ranges: 7.3% for AGIs below $25k, 1.1% for AGIs $25k-50k)
Percentage of individuals using paid preparers for their 2012 taxes: 49.7%
Here:
50%
State:
66%
(% for various income ranges: 43.8% for AGIs below $25k, 45.4% for AGIs $25k-50k, 57.0% for AGIs $50k-75k, 61.2% for AGIs $75k-100k, 66.7% for AGIs $100k-200k, 80.0% for AGIs over 200k)
Averages for the 2004 tax year for zip code 14214, filed in 2005:
Average Adjusted Gross Income (AGI) in 2004: $39,026 (Individual Income Tax Returns)
Here:
$39,026
State:
$59,519
Salary/wage: $34,219 (reported on 87.3% of returns)
Here:
$34,219
State:
$50,673
(% of AGI for various income ranges: 98.9% for AGIs below $10k, 82.0% for AGIs $10k-25k, 88.0% for AGIs $25k-50k, 83.4% for AGIs $50k-75k, 81.9% for AGIs $75k-100k, 61.4% for AGIs over 100k)
Taxable interest for individuals: $946 (reported on 40.9% of returns)
This zip code:
$946
New York:
$2,377
(% of AGI for various income ranges: 2.7% for AGIs below $10k, 1.1% for AGIs $10k-25k, 1.0% for AGIs $25k-50k, 1.1% for AGIs $50k-75k, 0.8% for AGIs $75k-100k, 0.9% for AGIs over 100k)
Taxable dividends: $2,728 (reported on 21.1% of returns)
Here:
$2,728
State:
$5,394
(% of AGI for various income ranges: 2.1% for AGIs below $10k, 0.7% for AGIs $10k-25k, 0.6% for AGIs $25k-50k, 1.1% for AGIs $50k-75k, 1.5% for AGIs $75k-100k, 2.3% for AGIs over 100k)
Net capital gain/loss: +$6,530 (reported on 14.7% of returns)
Here:
+$6,530
State:
+$23,581
(% of AGI for various income ranges: -2.2% for AGIs below $10k, 0.2% for AGIs $10k-25k, 0.2% for AGIs $25k-50k, 1.0% for AGIs $50k-75k, 1.0% for AGIs $75k-100k, 6.0% for AGIs over 100k)
Profit/loss from business: +$12,079 (reported on 11.3% of returns)
Here:
+$12,079
State:
+$13,809
(% of AGI for various income ranges: 5.0% for AGIs below $10k, 2.4% for AGIs $10k-25k, 1.0% for AGIs $25k-50k, 1.8% for AGIs $50k-75k, 3.4% for AGIs $75k-100k, 5.9% for AGIs over 100k)
IRA payment deduction: $2,661 (reported on 2.2% of returns)
14214:
$2,661
New York:
$3,115
(% of AGI for various income ranges: 0.2% for AGIs $10k-25k, 0.3% for AGIs $25k-50k, 0.2% for AGIs $50k-75k, 0.1% for AGIs $75k-100k, 0.1% for AGIs over 100k)
Self-employed pension: $19,167 (reported on 1.0% of returns)
Here:
$19,167
New York:
$19,016
Total itemized deductions: $16,136 (19% of AGI, reported on 27.0% of returns)
Here:
$16,136
State:
$25,864
Here:
18.8% of AGI
State:
21.9% of AGI
(% of AGI for various income ranges: 12.4% for AGIs below $10k, 5.4% for AGIs $10k-25k, 6.8% for AGIs $25k-50k, 11.1% for AGIs $50k-75k, 15.3% for AGIs $75k-100k, 14.0% for AGIs over 100k)
Charity contributions deductions: $3,538 (4% of AGI, reported on 23.1% of returns)
Here:
$3,538
State:
$4,439
Here:
3.7% of AGI
State:
3.6% of AGI
(% of AGI for various income ranges: 0.3% for AGIs below $10k, 0.7% for AGIs $10k-25k, 1.2% for AGIs $25k-50k, 2.0% for AGIs $50k-75k, 2.7% for AGIs $75k-100k, 3.0% for AGIs over 100k)
Total tax: $6,873 (reported on 67.9% of returns)
14214:
$6,873
State:
$11,730
(% of AGI for various income ranges: 1.9% for AGIs below $10k, 3.7% for AGIs $10k-25k, 7.5% for AGIs $25k-50k, 10.2% for AGIs $50k-75k, 11.4% for AGIs $75k-100k, 19.0% for AGIs over 100k)
Earned income credit: $1,672 (reported on 21.0% of returns)
Here:
$1,672
State:
$1,757
Percentage of individuals using paid preparers for their 2004 taxes: 58.8%
Here:
59%
State:
67%
(% for various income ranges: 48.5% for AGIs below $10k, 62.2% for AGIs $10k-25k, 59.3% for AGIs $25k-50k, 63.6% for AGIs $50k-75k, 65.0% for AGIs $75k-100k, 70.5% for AGIs over 100k)
Likely homosexual households (counted as self-reported same-sex unmarried-partner households)
Lesbian couples: 0.2% of all households
Gay men: 0.2% of all households
Household received Food Stamps/SNAP in the past 12 months: 1,590 Household did not receive Food Stamps/SNAP in the past 12 months: 7,020
Women who had a birth in the past 12 months: 110 (108 now married, 0 unmarried) Women who did not have a birth in the past 12 months: 5,384 (1,434 now married, 3,974 unmarried)
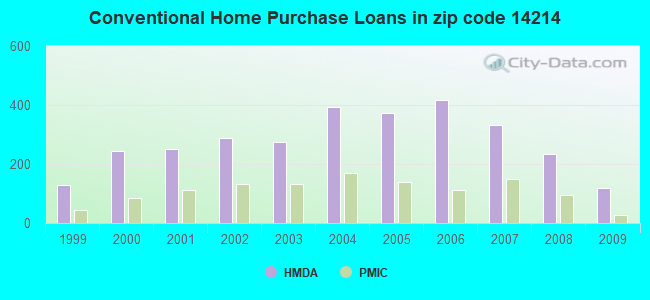
Housing units in zip code 14214 with a mortgage: 2,268 (270 second mortgage, 5 home equity loan, 268 both second mortgage and home equity loan) Houses without a mortgage: 76
Median monthly owner costs for units with a mortgage: $1,535 Median monthly owner costs for units without a mortgage: $463
Residents with income below the poverty level in 2022:
This zip code:
27.1%
Whole state:
14.3%
Residents with income below 50% of the poverty level in 2022:
This zip code:
8.9%
Whole state:
6.8%
Median number of rooms in houses and condos:
Here:
7.1
State:
6.3
Median number of rooms in apartments:
Here:
5.2
State:
3.8
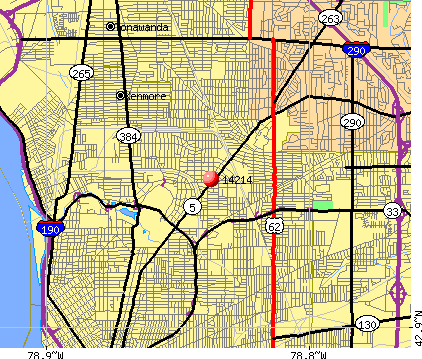
Notable locations in this zip code not listed on our city pages
Notable locations in zip code 14214: Robert Rich Senior All High Stadium (A), Delaware Park Golf Course (B), North Residence Hall (C), South Residence Hall (D), Huber Hall (E), Downey Science Building (F), Kevin I Sullivan Campus Center (G), Main Building Medaille College (H), Desmond Hall (I), Campion Residence Hall (J), Demerly Hall (K). Display/hide their locations on the map
Churches in zip code 14214 include: Carmelite Monastery (A), Berea Church of God in Christ (B), Central Park United Methodist Church (C), Central Presbyterian Church (D), Church in Buffalo (E), Linwood Church of Christ (F), Cornerstone Community Church (G), Episcopal Church of the Good Shepherd (H), Eternal Hope Church of God and Christ (I). Display/hide their locations on the map
1,975 married couples with children.
1,515 single-parent households (359 men, 1,156 women).
80.8% of residents of 14214 zip code speak English at home.
3.8% of residents speak Spanish at home (80% very well, 12% well, 1% not well, 6% not at all).
8.7% of residents speak other Indo-European language at home (56% very well, 28% well, 13% not well, 3% not at all).
3.6% of residents speak Asian or Pacific Island language at home (82% very well, 16% well, 2% not well).
2.6% of residents speak other language at home (74% very well, 8% well, 15% not well, 3% not at all).
Foreign born population: 3,090 (14.2%) (41.6% of them are naturalized citizens)
Major facilities with environmental interests located in this zip code:
HARBISON BROTHERS INCORPORATED (32 APPENHEIMER AVE in BUFFALO, NY)
STATE MASTER (New York facility tracking) - AIR PROGRAM, HAZARDOUS WASTE PROGRAM HAZARDOUS WASTE BIENNIAL REPORTER (Resource Conservation and Recovery Act (tracking hazardous waste)) (Resource Conservation and Recovery Act (tracking hazardous waste)) Business SIC classification: REPAIR SHOPS AND RELATED SERVICES Organizations: ROBERT HARBISON (FACILITY APPLICATION CONTACT)
, HARBISON BROS INC (LEGALLY RESPONSIBLE PARTY)
COLOR COMMUNICATIONS INC (2495 MAIN STREET in BUFFALO, NY)
AIR SYNTHETIC MINOR (AIRS/AFS) STATE MASTER (New York facility tracking) - AIR PROGRAM HAZARDOUS WASTE BIENNIAL REPORTER (Resource Conservation and Recovery Act (tracking hazardous waste)) Large Quantity Generators, more that 1000 kg of hazardous waste/month (Resource Conservation and Recovery Act (tracking hazardous waste)) Business SIC and NAICS classification: COATED AND LAMINATED PAPER
ILLOS PIANO REBUILDERS (2940 MAIN ST in BUFFALO, NY)
STATE MASTER (New York facility tracking) - AIR PROGRAM, (Resource Conservation and Recovery Act (tracking hazardous waste)) Business SIC classification: REPAIR SHOPS AND RELATED SERVICES
BENNETT HS ( in BUFFALO, NY)
(National Center for Education Statistics) - STATE ID-140600010099 Organizations: BUFFALO CITY SD (SCHOOL DISTRICT)
IVOCLAR NORTH AMERICA INCORPORATED (2948 MAIN STREET in BUFFALO, NY)
HAZARDOUS WASTE BIENNIAL REPORTER (Resource Conservation and Recovery Act (tracking hazardous waste)) Large Quantity Generators, more that 1000 kg of hazardous waste/month (Resource Conservation and Recovery Act (tracking hazardous waste))
BENDERSON DEVELOPMENT PROPERTY (2585 MAIN ST in BUFFALO, NY)
Large Quantity Generators, more that 1000 kg of hazardous waste/month (Resource Conservation and Recovery Act (tracking hazardous waste)) - notification Organizations: BENDERSON DEV CO INC (CONTACT/OWNER)
7-ELEVEN #22491 (3488 MAIN ST in BUFFALO, NY)
(Resource Conservation and Recovery Act (tracking hazardous waste))
ALL HIGH STADIUM #902 (50 MERCER ST in BUFFALO, NY)
Conditionally Exempt Small Quantity Generators, less than 100 kg/month of hazardous waste (Resource Conservation and Recovery Act (tracking hazardous waste)) Organizations: BUFFALO BOARD OF EDUCATION (CONTACT/OPERATOR)
, CITY OF BUFFALO (CONTACT/OWNER)
GREAT LAKES MOTOR CORP (3068 MAIN ST in BUFFALO, NY)
(Resource Conservation and Recovery Act (tracking hazardous waste))
HOUSING & PROPERTY INSPECT (240 KENSINGTON AVE in BUFFALO, NY)
(Resource Conservation and Recovery Act (tracking hazardous waste))
CRANZ RUBBER & GASKET INC (2671 MAIN ST in BUFFALO, NY)
(Resource Conservation and Recovery Act (tracking hazardous waste))
HOLY ANGELS ACADEMY (24 SHOSHONE DR in BUFFALO, NY)
Conditionally Exempt Small Quantity Generators, less than 100 kg/month of hazardous waste (Resource Conservation and Recovery Act (tracking hazardous waste)) - notification Organizations: GRAY NUNS OF THE SACRED HEART (CONTACT/OWNER)
BENEDICT HOUSE OF WESTERN NY (2211 MAIN ST in BUFFALO, NY)
Small Quantity Generators, between 100 kg and 1000 kg of hazardous waste/month (Resource Conservation and Recovery Act (tracking hazardous waste)) - notification Organizations: BENEDICT OUSE OF WESTERN NY (CONTACT/OWNER)
Housing units lacking complete plumbing facilities: 1.1% Housing units lacking complete kitchen facilities: 3.8%
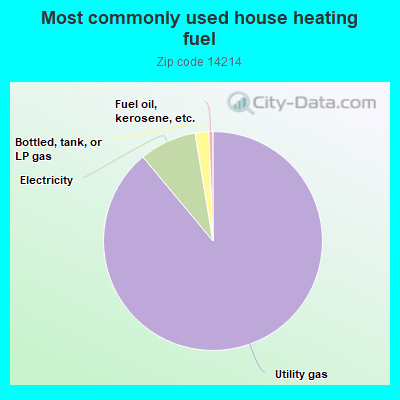
88.5%Utility gas
8.4%Electricity
2.0%Bottled, tank, or LP gas
0.6%Fuel oil, kerosene, etc.
Population in 1990: 21,770. Population change in the 1990s: +90 (+0.4%).
Place of birth for U.S.-born residents:
This state: 15,747
Northeast: 585
Midwest: 602
South: 1,033
West: 461
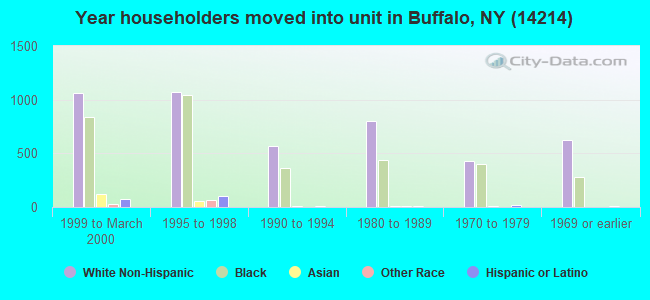
49% of the 14214 zip code residents lived in the same house 5 years ago. Out of people who lived in different houses, 63% lived in this county. Out of people who lived in different counties, 50% lived in New York.
85% of the 14214 zip code residents lived in the same house 1 year ago. Out of people who lived in different houses, 58% moved from this county. Out of people who lived in different houses, 18% moved from different county within same state. Out of people who lived in different houses, 12% moved from different state. Out of people who lived in different houses, 12% moved from abroad.
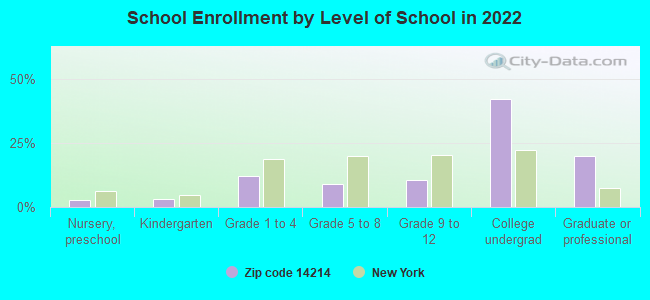
Private vs. public school enrollment:
Students in private schools in grades 1 to 8 (elementary and middle school): 480
Here:
28.1%
New York:
15.6%
Students in private schools in grades 9 to 12 (high school): 188
Here:
21.9%
New York:
15.0%
Students in private undergraduate colleges: 596
Here:
17.9%
New York:
39.2%
Occupation by median earnings in the past 12 months ($)
77,956Legal occupations
74,583Health diagnosing and treating practitioners and other technical occupations
66,726Law enforcement workers including supervisors
63,812Business and financial operations occupations
63,062Arts, design, entertainment, sports, and media occupations
58,114Management occupations
Companies with federal contracts located in this zip code (BUFFALO, NY):
STROCK CONTRACTING INC (2495 MAIN STREET, SUITE 34; small business) : $30,414,478 in 222 contractsfrom 1999 to 2006
Contracts for Construction of Structures and Facilities -- Other Non-Building Facilities, Construction of Structures and Facilities -- Other Administrative Facilities and Service Buildings, Maintenance, Repair or Alteration of Real Property -- Other Airfield Structures, Maintenance, Repair or Alteration of Real Property -- Hospitals and Infirmaries, and moreby National Park Service, Air Force, Department of Veterans Affairs, U.S. Army Corps of Engineers - civil program financing only, and others Signed by year:2000: $1,946,710; 2001: $3,136,707; 2002: $3,587,718; 2003: $11,486,853; 2004: $4,808,194; 2005: $4,107,243; 2006: $1,321,053.
Biggest contracts:
$2,041,889 with National Park Service for Construction of Structures and Facilities -- Other Non-Building Facilities. Taking place in NJ. Signed on 2003-03-15. Completion date: 2004-04-15.
$1,854,014 with Air Force for Construction of Structures and Facilities -- Other Administrative Facilities and Service Buildings. Signed on 2004-09-27. Completion date: 2005-08-23.
$1,843,476 with Air Force for Maintenance, Repair or Alteration of Real Property -- Other Airfield Structures. Signed on 2001-09-29. Completion date: 2002-04-09.
$997,000 with National Park Service for Construction of Structures and Facilities -- Other Non-Building Facilities. Taking place in NJ. Signed on 2002-09-15. Completion date: 2003-07-15.
S&W CONTRACTING OF WNY INC (2317 MAIN ST; small business) : $1,158,548 in 27 contractsfrom 2002 to 2006
Contracts for Custodial Janitorial Services, Maintenance, Repair or Alteration of Real Property -- Other Airfield Structures, Maintenance, Repair or Alteration of Real Property -- Hospitals and Infirmaries, Maintenance, Repair or Alteration of Real Property -- Office Buildings, and moreby Army, Air Force, Transportation Security Administration, Department of Veterans Affairs, and others Signed by year:2000: $0; 2001: $0; 2002: $93,492; 2003: $0; 2004: $159,016; 2005: $831,331; 2006: $74,709.
Biggest contracts:
$596,571 with Army for Custodial Janitorial Services. Signed on 2005-09-29. Completion date: 2009-10-31.
$93,492 with Air Force for Maintenance, Repair or Alteration of Real Property -- Other Airfield Structures. Signed on 2002-09-25. Completion date: 2002-11-13.
$66,596 with Transportation Security Administration for Custodial Janitorial Services. Signed on 2005-06-13. Effective on 2005-07-24. Completion date: 2006-07-23.
$50,000 with Department of Veterans Affairs for Maintenance, Repair or Alteration of Real Property -- Hospitals and Infirmaries. Signed on 2005-12-15. Completion date: 2006-03-31.
EDUCATION, NEW YORK DEPT OF (3435 MAIN ST)
$29,807 with Army for Educational Services. Signed on 2005-02-22. Completion date: 2005-09-30.
RODGERS WELDING SUPPLY INC (1791 FILLMORE AVE; small business)
$7,680 with Army for Electric Arc Welding Equipment. Signed on 2005-07-08. Completion date: 2005-08-08.
Top industries in this zip code by the number of employees in 2005:
Professional, Scientific, and Technical Services: Research and Development in the Physical, Engineering, and Life Sciences (over 1000 employees: 1 establishment, 1-4 employees: 1 establishment)
Health Care and Social Assistance: General Medical and Surgical Hospitals (over 1000: 1)
Health Care and Social Assistance: Offices of Physicians (except Mental Health Specialists) (500-999: 1, 20-49: 2, 5-9: 13, 1-4: 15)
2003 - 2018 National Fire Incident Reporting System (NFIRS) incidents
According to the data from the years 2003 - 2018 the average number of fires per year is 10. The highest number of reported fire incidents - 40 took place in 2012, and the least - 0 in 2008. The data has a growing trend.
When looking into fire subcategories, the most incidents belonged to: Structure Fires (66.5%), and Mobile Property/Vehicle Fires (17.4%).
Fire incident types reported to NFIRS in Zip Code 14214


 Nearest zip codes: 14216, 14208, 14215, 14223, 14209, 14211.
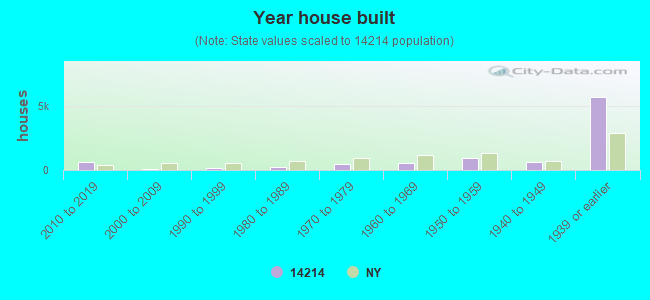


 According to the data from the years 2003 - 2018 the average number of fires per year is 10. The highest number of reported fire incidents - 40 took place in 2012, and the least - 0 in 2008. The data has a growing trend.
 When looking into fire subcategories, the most incidents belonged to: Structure Fires (66.5%), and Mobile Property/Vehicle Fires (17.4%).