Estimated zip code population in 2022: 23,759 Zip code population in 2010: 22,611 Zip code population in 2000: 29,590
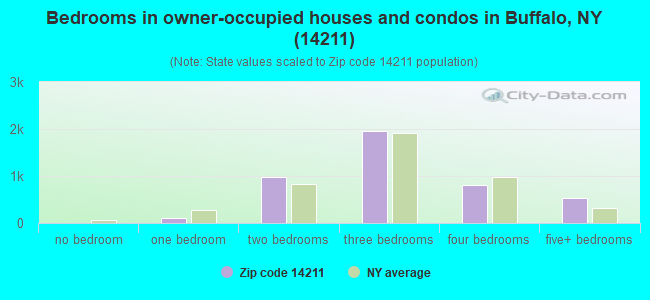
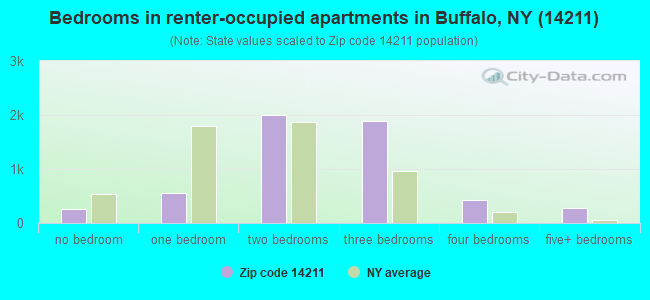
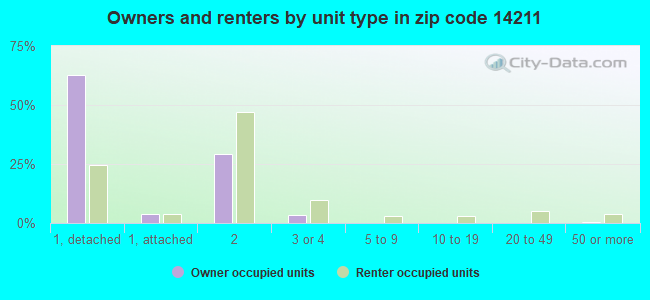
Houses and condos: 11,476 Renter-occupied apartments: 5,486
% of renters here:
56%
State:
46%
March 2022 cost of living index in zip code 14211: 100.6 (near average, U.S. average is 100)
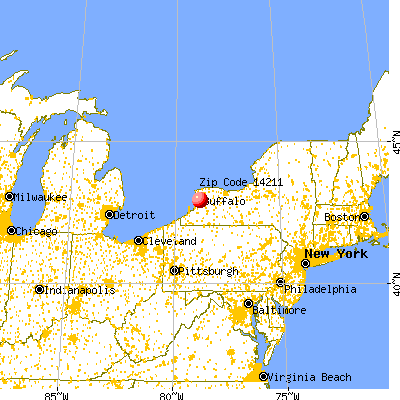
Land area: 4.0 sq. mi. Water area: 0.0 sq. mi.
Population density: 5,867 people per square mile
(average).
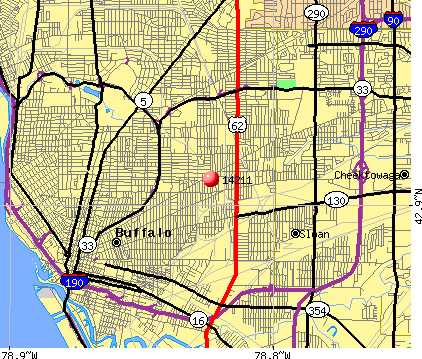
OSM Map
General Map
Google Map
MSN Map
OSM Map
General Map
Google Map
MSN Map
OSM Map
General Map
Google Map
MSN Map
OSM Map
General Map
Google Map
MSN Map
Please wait while loading the map...
Real estate property taxes paid for housing units in 2022:
This zip code:
1.4% ($1,035)
New York:
1.5% ($6,180)
Median real estate property taxes paid for housing units with mortgages in 2022: $1,329 (1.2%) Median real estate property taxes paid for housing units with no mortgage in 2022: $823 (1.5%)
Averages for the 2020 tax year for zip code 14211, filed in 2021:
Average Adjusted Gross Income (AGI) in 2020: $28,476 (Individual Income Tax Returns)
Here:
$28,476
State:
$90,930
Salary/wage: $24,657 (reported on 86.3% of returns)
Here:
$24,657
State:
$72,104
(% of AGI for various income ranges: 1055.2% for AGIs below $25k, 3212.1% for AGIs $25k-50k, 7018.7% for AGIs $50k-75k, 9923.5% for AGIs $75k-100k, 21673.8% for AGIs $100k-200k)
Taxable interest for individuals: $240 (reported on 7.6% of returns)
This zip code:
$240
New York:
$3,075
(% of AGI for various income ranges: 1.2% for AGIs below $25k, 1.5% for AGIs $25k-50k, 3.7% for AGIs $50k-75k, 22.9% for AGIs $75k-100k, 30.0% for AGIs $100k-200k)
Ordinary dividends: $1,269 (reported on 2.6% of returns)
Here:
$1,269
State:
$11,095
(% of AGI for various income ranges: 2.5% for AGIs below $25k, 1.2% for AGIs $25k-50k, 2.2% for AGIs $50k-75k, 17.6% for AGIs $75k-100k, 183.8% for AGIs $100k-200k)
Net capital gain/loss in AGI: +$2,830 (reported on 2.7% of returns)
Here:
+$2,830
State:
+$44,925
(% of AGI for various income ranges: 1.8% for AGIs below $25k, 6.3% for AGIs $25k-50k, 19.6% for AGIs $50k-75k, 41.2% for AGIs $75k-100k, 415.0% for AGIs $100k-200k)
Profit/loss from business: +$4,812 (reported on 12.3% of returns)
Here:
+$4,812
State:
+$14,940
(% of AGI for various income ranges: 71.7% for AGIs below $25k, 73.2% for AGIs $25k-50k, 37.8% for AGIs $50k-75k, 130.6% for AGIs $75k-100k, 235.0% for AGIs $100k-200k)
Taxable individual retirement arrangement distribution: $8,000 (reported on 1.8% of returns)
14211:
$8,000
New York:
$19,609
(% of AGI for various income ranges: 5.8% for AGIs below $25k, 17.3% for AGIs $25k-50k, 160.0% for AGIs $75k-100k, 532.5% for AGIs $100k-200k)
Total itemized deductions: $22,214 (reported on 0.7% of returns)
Here:
$22,214
State:
$39,326
(% of AGI for various income ranges: 33.0% for AGIs $25k-50k, 363.5% for AGIs $75k-100k)
Charity contributions: $10,280 (reported on 0.5% of returns)
Here:
$10,280
State:
$15,420
(% of AGI for various income ranges: 7.7% for AGIs $25k-50k, 173.5% for AGIs $75k-100k)
Taxes paid: $5,383 (reported on 0.6% of returns)
14211:
$5,383
State:
$9,183
(% of AGI for various income ranges: 5.8% for AGIs $25k-50k, 93.5% for AGIs $75k-100k)
Earned income credit: $2,685 (reported on 43.3% of returns)
Here:
$2,685
State:
$2,138
(% of AGI for various income ranges: 165.7% for AGIs below $25k, 147.8% for AGIs $25k-50k, 3.5% for AGIs $50k-75k)
Percentage of individuals using paid preparers for their 2020 taxes: 95.7%
Here:
96%
State:
95%
(% for various income ranges: 96.0% for AGIs below $25k, 95.9% for AGIs $25k-50k, 94.8% for AGIs $50k-75k, 96.3% for AGIs $75k-100k, 88.9% for AGIs $100k-200k)
Averages for the 2012 tax year for zip code 14211, filed in 2013:
Average Adjusted Gross Income (AGI) in 2012: $24,205 (Individual Income Tax Returns)
Here:
$24,205
State:
$77,088
Salary/wage: $22,180 (reported on 88.6% of returns)
Here:
$22,180
State:
$60,593
(% of AGI for various income ranges: 77.9% for AGIs below $25k, 86.3% for AGIs $25k-50k, 82.5% for AGIs $50k-75k, 78.9% for AGIs $75k-100k, 70.1% for AGIs $100k-200k)
Taxable interest for individuals: $352 (reported on 12.7% of returns)
This zip code:
$352
New York:
$3,125
(% of AGI for various income ranges: 0.2% for AGIs below $25k, 0.1% for AGIs $25k-50k, 0.6% for AGIs $100k-200k)
Ordinary dividends: $1,083 (reported on 4.2% of returns)
Here:
$1,083
State:
$10,299
(% of AGI for various income ranges: 0.2% for AGIs below $25k, 0.2% for AGIs $25k-50k, 0.1% for AGIs $75k-100k, 0.3% for AGIs $100k-200k)
Net capital gain/loss in AGI: +$193 (reported on 1.8% of returns)
Here:
+$193
State:
+$42,474
(% of AGI for various income ranges: )
Profit/loss from business: +$8,036 (reported on 9.8% of returns)
Here:
+$8,036
State:
+$16,168
(% of AGI for various income ranges: 7.5% for AGIs below $25k, 1.0% for AGIs $25k-50k, 1.4% for AGIs $50k-75k, 2.4% for AGIs $75k-100k)
Taxable individual retirement arrangement distribution: $7,196 (reported on 2.7% of returns)
14211:
$7,196
New York:
$17,621
(% of AGI for various income ranges: 0.5% for AGIs below $25k, 0.7% for AGIs $25k-50k, 1.1% for AGIs $50k-75k, 2.5% for AGIs $75k-100k)
Total itemized deductions: $14,023 (23% of AGI, reported on 6.2% of returns)
Here:
$14,023
State:
$34,985
Here:
23.0% of AGI
State:
21.3% of AGI
(% of AGI for various income ranges: 1.1% for AGIs below $25k, 2.8% for AGIs $25k-50k, 6.0% for AGIs $50k-75k, 7.1% for AGIs $75k-100k, 9.8% for AGIs $100k-200k)
Charity contributions: $4,151 (reported on 5.1% of returns)
Here:
$4,151
State:
$5,572
(% of AGI for various income ranges: 0.2% for AGIs below $25k, 0.7% for AGIs $25k-50k, 1.6% for AGIs $50k-75k, 2.2% for AGIs $75k-100k, 2.0% for AGIs $100k-200k)
Taxes paid: $4,290 (reported on 6.2% of returns)
14211:
$4,290
State:
$18,656
(% of AGI for various income ranges: 0.2% for AGIs below $25k, 0.7% for AGIs $25k-50k, 1.9% for AGIs $50k-75k, 2.5% for AGIs $75k-100k, 3.9% for AGIs $100k-200k)
Earned income credit: $2,589 (reported on 46.0% of returns)
Here:
$2,589
State:
$2,230
(% of AGI for various income ranges: 12.8% for AGIs below $25k, 1.8% for AGIs $25k-50k)
Percentage of individuals using paid preparers for their 2012 taxes: 53.3%
Here:
53%
State:
66%
(% for various income ranges: 53.7% for AGIs below $25k, 48.6% for AGIs $25k-50k, 60.4% for AGIs $50k-75k, 63.2% for AGIs $75k-100k, 70.0% for AGIs $100k-200k)
Averages for the 2004 tax year for zip code 14211, filed in 2005:
Average Adjusted Gross Income (AGI) in 2004: $22,123 (Individual Income Tax Returns)
Here:
$22,123
State:
$59,519
Salary/wage: $21,060 (reported on 90.2% of returns)
Here:
$21,060
State:
$50,673
(% of AGI for various income ranges: 82.3% for AGIs below $10k, 83.8% for AGIs $10k-25k, 89.3% for AGIs $25k-50k, 88.0% for AGIs $50k-75k, 83.5% for AGIs $75k-100k, 75.5% for AGIs over 100k)
Taxable interest for individuals: $526 (reported on 21.7% of returns)
This zip code:
$526
New York:
$2,377
(% of AGI for various income ranges: 0.8% for AGIs below $10k, 0.7% for AGIs $10k-25k, 0.4% for AGIs $25k-50k, 0.3% for AGIs $50k-75k, 0.6% for AGIs $75k-100k, 0.5% for AGIs over 100k)
Taxable dividends: $524 (reported on 8.0% of returns)
Here:
$524
State:
$5,394
(% of AGI for various income ranges: 0.5% for AGIs below $10k, 0.2% for AGIs $10k-25k, 0.1% for AGIs $25k-50k, 0.2% for AGIs $50k-75k, 0.1% for AGIs $75k-100k, 0.1% for AGIs over 100k)
Net capital gain/loss: +$561 (reported on 3.8% of returns)
Here:
+$561
State:
+$23,581
(% of AGI for various income ranges: -0.3% for AGIs below $10k, 0.0% for AGIs $10k-25k, 0.1% for AGIs $25k-50k, 0.1% for AGIs $50k-75k, 0.3% for AGIs $75k-100k, 0.4% for AGIs over 100k)
Profit/loss from business: +$4,698 (reported on 7.5% of returns)
Here:
+$4,698
State:
+$13,809
(% of AGI for various income ranges: 5.7% for AGIs below $10k, 2.0% for AGIs $10k-25k, 1.2% for AGIs $25k-50k, 0.8% for AGIs $50k-75k, 0.2% for AGIs $75k-100k)
IRA payment deduction: $1,717 (reported on 1.1% of returns)
14211:
$1,717
New York:
$3,115
Total itemized deductions: $12,035 (23% of AGI, reported on 9.2% of returns)
Here:
$12,035
State:
$25,864
Here:
22.7% of AGI
State:
21.9% of AGI
(% of AGI for various income ranges: 0.6% for AGIs below $10k, 2.0% for AGIs $10k-25k, 4.3% for AGIs $25k-50k, 8.9% for AGIs $50k-75k, 12.5% for AGIs $75k-100k, 11.5% for AGIs over 100k)
Charity contributions deductions: $3,316 (6% of AGI, reported on 8.4% of returns)
Here:
$3,316
State:
$4,439
Here:
6.1% of AGI
State:
3.6% of AGI
(% of AGI for various income ranges: 0.4% for AGIs $10k-25k, 1.1% for AGIs $25k-50k, 2.3% for AGIs $50k-75k, 3.6% for AGIs $75k-100k, 2.6% for AGIs over 100k)
Total tax: $2,649 (reported on 52.5% of returns)
14211:
$2,649
State:
$11,730
(% of AGI for various income ranges: 1.3% for AGIs below $10k, 2.7% for AGIs $10k-25k, 6.2% for AGIs $25k-50k, 9.7% for AGIs $50k-75k, 11.5% for AGIs $75k-100k, 18.1% for AGIs over 100k)
Earned income credit: $2,099 (reported on 45.1% of returns)
Here:
$2,099
State:
$1,757
Percentage of individuals using paid preparers for their 2004 taxes: 70.9%
Here:
71%
State:
67%
(% for various income ranges: 68.7% for AGIs below $10k, 74.0% for AGIs $10k-25k, 68.3% for AGIs $25k-50k, 68.9% for AGIs $50k-75k, 76.7% for AGIs $75k-100k, 78.1% for AGIs over 100k)
Likely homosexual households (counted as self-reported same-sex unmarried-partner households)
Lesbian couples: 0.3% of all households
Gay men: 0.0% of all households
Household received Food Stamps/SNAP in the past 12 months: 4,484 Household did not receive Food Stamps/SNAP in the past 12 months: 5,717
Women who had a birth in the past 12 months: 408 (152 now married, 262 unmarried) Women who did not have a birth in the past 12 months: 5,312 (1,503 now married, 3,829 unmarried)
Housing units in zip code 14211 with a mortgage: 1,677 (221 second mortgage, 189 both second mortgage and home equity loan) Houses without a mortgage: 120
Median monthly owner costs for units with a mortgage: $943 Median monthly owner costs for units without a mortgage: $441
Residents with income below the poverty level in 2022:
This zip code:
34.3%
Whole state:
14.3%
Residents with income below 50% of the poverty level in 2022:
This zip code:
19.9%
Whole state:
6.8%
Median number of rooms in houses and condos:
Here:
6.5
State:
6.3
Median number of rooms in apartments:
Here:
5.5
State:
3.8
Notable locations in this zip code not listed on our city pages
Churches in zip code 14211 include: Antioch Baptist Church (A), Bethlehem Baptist Church (B), Calvary Baptist Church (C), Centennial African Methodist Episcopal Zion Church (D), Church of God Tabernacle (E), Cornerstne Church of God in Christ (F), Evening Star Church of God (G), Faith Baptist Church (H), First Timothy Baptist Church (I). Display/hide their locations on the map
In group quarters: 380 (-1 institutionalized population)
Size of family households: 2,199 2-persons, 1,349 3-persons, 683 4-persons, 618 5-persons, 349 6-persons, 152 7-or-more-persons
Size of nonfamily households: 4,161 1-person, 373 2-persons
2,681 married couples with children.
3,088 single-parent households (102 men, 2,986 women).
76.7% of residents of 14211 zip code speak English at home.
5.2% of residents speak Spanish at home (46% very well, 27% well, 10% not well, 17% not at all).
13.1% of residents speak other Indo-European language at home (36% very well, 47% well, 13% not well, 4% not at all).
2.0% of residents speak Asian or Pacific Island language at home (36% very well, 30% well, 17% not well, 16% not at all).
3.0% of residents speak other language at home (45% very well, 39% well, 11% not well, 5% not at all).
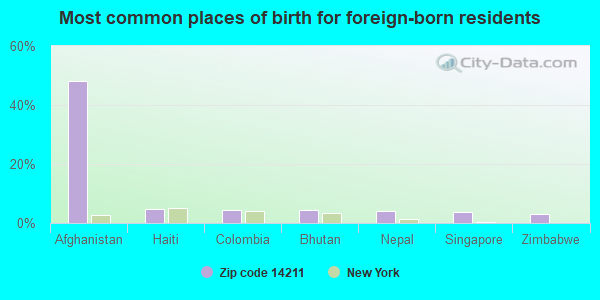
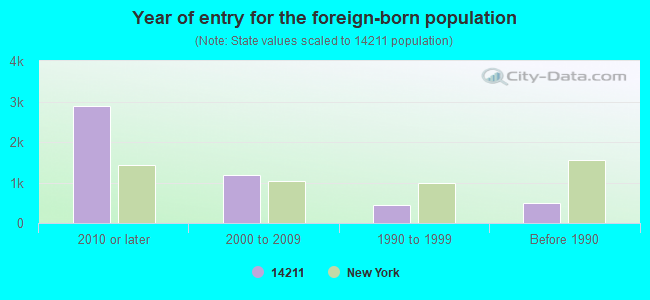
Foreign born population: 3,780 (15.9%) (55.0% of them are naturalized citizens)
Major facilities with environmental interests located in this zip code:
COUNTY OF ERIE DETENTION FACILITY ( in BUFFALO, NY)
(National Center for Education Statistics) - STATE ID-140600950005 (National Center for Education Statistics) - STATE ID-140600950006 (National Center for Education Statistics) - STATE ID-140600950007 (National Center for Education Statistics) - STATE ID-140600950008 Organizations: BUFFALO CITY SD (SCHOOL DISTRICT)
ADAORA DRY CLEANERS (1385 FILLMORE AVE in BUFFALO, NY)
AIR MINOR (AIRS/AFS) STATE MASTER (New York facility tracking) - AIR PROGRAM, HAZARDOUS WASTE PROGRAM Small Quantity Generators, between 100 kg and 1000 kg of hazardous waste/month (Resource Conservation and Recovery Act (tracking hazardous waste)) Business SIC classification: DRYCLEANING PLANTS, EXCEPT RUG CLEANING Business NAICS classification: DRYCLEANING AND LAUNDRY SERVICES (EXCEPT COIN-OPERATED). Organizations: BELL BROS CLEANERS INC (LEGALLY RESPONSIBLE PARTY)
, UBATEL INC (LEGALLY RESPONSIBLE PARTY)
Alternative names: BELL BROS CLEANERS INC, BELL BROTHERS DRIVE IN CLEANERS
INTERSTATE BRANDS CORPORATION (313 FOUGERON STREET in BUFFALO, NY)
AIR SYNTHETIC MINOR (AIRS/AFS) STATE MASTER (New York facility tracking) - AIR PROGRAM, Conditionally Exempt Small Quantity Generators, less than 100 kg/month of hazardous waste (Resource Conservation and Recovery Act (tracking hazardous waste)) - notification Business SIC classification: BREAD AND OTHER BAKERY PRODUCTS, EXCEPT COOKIES AND CRACKERS Business NAICS classification: COMMERCIAL BAKERIES. Organizations: CONTINENTAL BAKING CO (LEGALLY RESPONSIBLE PARTY)
Alternative names: INTERSTATE BRANDS - BUFFALO
218 ORLANDO - AMIRS VISION, INC. (218 ORLANDO STREET in BUFFALO, NY)
AMERICAN AXLE & MANUFACTURING INC CHEEKTOWAGA (2799 WALDEN AVE. in CHEEKTOWAGA, NY)
CRITERIA AND HAZARDOUS AIR POLLUTANT INVENTORY (Inventory of air pollution sources) Small Quantity Generators, between 100 kg and 1000 kg of hazardous waste/month (Resource Conservation and Recovery Act (tracking hazardous waste)) - notification TRI REPORTER (Tracking of toxic chemicals releasing facilities) Business SIC classification: MOTOR VEHICLE PARTS AND ACCESSORIES Organizations: AMERICAN AXLE & MFG INC (CONTACT/OWNER)
GOMCO DIV ALLIED HEALTH CARE (828 E FERRY ST in BUFFALO, NY)
(Resource Conservation and Recovery Act (tracking hazardous waste)) Alternative names: GOMCO SURGICAL EQUIP
GRIFFITH ENERGY (905 ELMWOOD AVE in BUFFALO, NY)
(Resource Conservation and Recovery Act (tracking hazardous waste))
ADAMS MINNIE (116 WENDE ST in BUFFALO, NY)
Conditionally Exempt Small Quantity Generators, less than 100 kg/month of hazardous waste (Resource Conservation and Recovery Act (tracking hazardous waste)) - notification Organizations: MINNIE ADAMS (CONTACT/OWNER)
ADDISON VERNELL (64 MOSELLE AVE in BUFFALO, NY)
Conditionally Exempt Small Quantity Generators, less than 100 kg/month of hazardous waste (Resource Conservation and Recovery Act (tracking hazardous waste)) - notification Organizations: VERNELL ADDISON (CONTACT/OWNER)
GRIFFIN BRENDA (270 ROTHER ST in BUFFALO, NY)
Conditionally Exempt Small Quantity Generators, less than 100 kg/month of hazardous waste (Resource Conservation and Recovery Act (tracking hazardous waste)) - notification Organizations: BRENDA GRIFFIN (CONTACT/OWNER)
HALL AGATHA (187 LESLIE AVE in BUFFALO, NY)
Conditionally Exempt Small Quantity Generators, less than 100 kg/month of hazardous waste (Resource Conservation and Recovery Act (tracking hazardous waste)) - notification Organizations: AGATHA HALL (CONTACT/OWNER)
HARRIS IRENE (111 FAY ST in BUFFALO, NY)
Small Quantity Generators, between 100 kg and 1000 kg of hazardous waste/month (Resource Conservation and Recovery Act (tracking hazardous waste)) - notification Organizations: IRENE HARRIS (CONTACT/OWNER)
Housing units lacking complete plumbing facilities: 4.4% Housing units lacking complete kitchen facilities: 9.2%
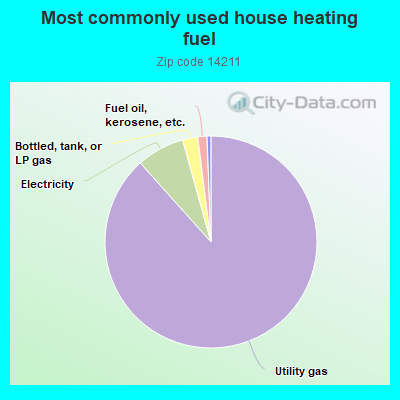
88.3%Utility gas
7.3%Electricity
2.3%Bottled, tank, or LP gas
1.4%Fuel oil, kerosene, etc.
0.6%Other fuel
Population in 1990: 38,411.
Place of birth for U.S.-born residents:
This state: 16,359
Northeast: 220
Midwest: 375
South: 1,879
West: 130
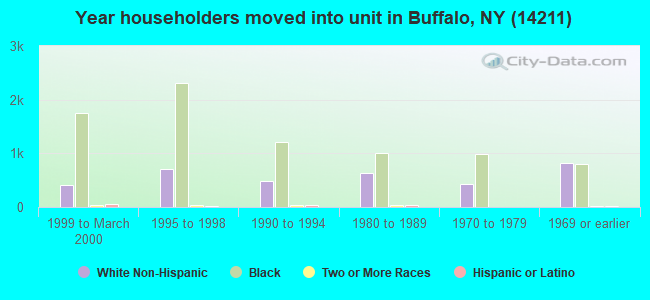
58% of the 14211 zip code residents lived in the same house 5 years ago. Out of people who lived in different houses, 90% lived in this county. Out of people who lived in different counties, 50% lived in New York.
88% of the 14211 zip code residents lived in the same house 1 year ago. Out of people who lived in different houses, 67% moved from this county. Out of people who lived in different houses, 21% moved from different county within same state. Out of people who lived in different houses, 9% moved from different state. Out of people who lived in different houses, 1% moved from abroad.
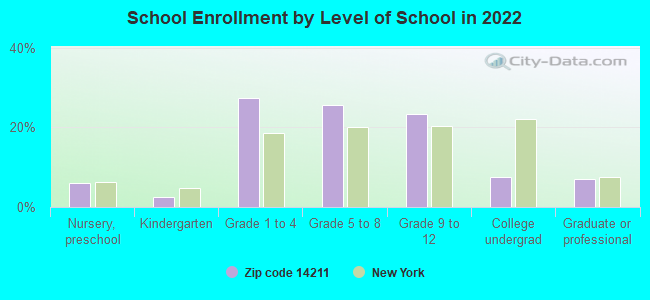
Private vs. public school enrollment:
Students in private schools in grades 1 to 8 (elementary and middle school): 501
Here:
15.1%
New York:
15.6%
Students in private schools in grades 9 to 12 (high school): 166
Here:
11.4%
New York:
15.0%
Students in private undergraduate colleges: 127
Here:
26.8%
New York:
39.2%
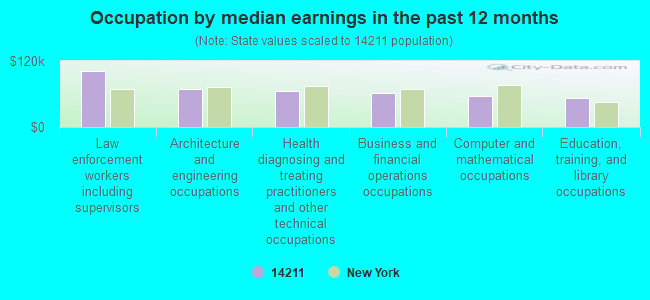
Occupation by median earnings in the past 12 months ($)
101,252Law enforcement workers including supervisors
69,781Architecture and engineering occupations
65,193Health diagnosing and treating practitioners and other technical occupations
61,204Business and financial operations occupations
55,907Computer and mathematical occupations
52,178Education, training, and library occupations
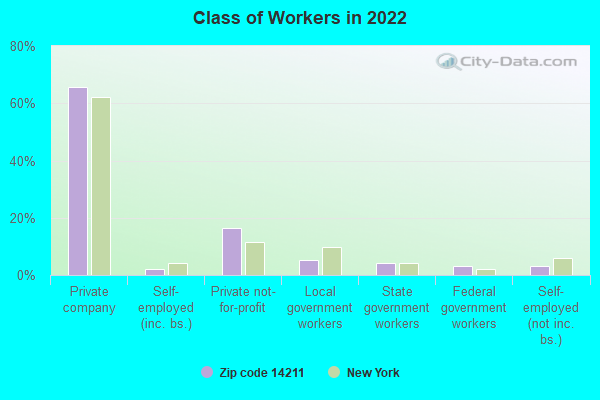
Companies with federal contracts located in this zip code:
MCCLOUD MAINTENANCE INC (1518 FILLMORE AVENUE in BUFFALO, NY; small business) : $78,497 in 5 contractsfrom 2003 to 2006
Contracts for Custodial Janitorial Services by Army Signed by year:2000: $0; 2001: $0; 2002: $0; 2003: $11,700; 2004: $12,168; 2005: $41,969; 2006: $12,660.
Biggest contracts:
$29,801 with Army for Custodial Janitorial Services. Signed on 2005-04-29. Completion date: 2006-04-30.
$12,660, same as above.Signed on 2006-06-06. Completion date: 2007-05-31.
$12,168, same as above.Signed on 2005-05-24. Completion date: 2005-06-04.
$12,168, same as above.Signed on 2004-06-04. Completion date: 2005-06-04.
ROEHRIG, ALFRED G AND SON (1277 FILLMORE AVE in BUFFALO, NY; small business)
$3,338 with Army for Air Conditioning Equipment. Signed on 2004-10-11. Completion date: 2005-04-01.
Muhammad ( in Buffalo, NY; small business) : $2,800 in 9 contractsfrom 2004 to 2006
Contracts for Operation of Government-Owned Facilities -- Religious Facilities, Chaplain Services by Bureau of Prisoners/Federal Prison System Signed by year:2000: $0; 2001: $0; 2002: $0; 2003: $0; 2004: $2,200; 2005: $1,200; 2006: -$600.
Biggest contracts:
$2,000 with Bureau of Prisoners/Federal Prison System for Operation of Government-Owned Facilities -- Religious Facilities. Taking place in PA. Signed on 2004-12-16. Effective on 2005-12-16. Completion date: 2005-09-30.
$1,200 with Bureau of Prisoners/Federal Prison System for Chaplain Services. Taking place in PA. Signed on 2005-10-01. Completion date: 2006-09-30.
$200 with Bureau of Prisoners/Federal Prison System for Operation of Government-Owned Facilities -- Religious Facilities. Signed on 2005-04-28. Completion date: 2005-04-28.
$200 with Bureau of Prisoners/Federal Prison System for Operation of Government-Owned Facilities -- Religious Facilities. Taking place in PA. Signed on 2005-03-21. Completion date: 2005-03-21.
Top industries in this zip code by the number of employees in 2005:
Administrative and Support and Waste Management and Remediation Services: Convention and Trade Show Organizers (250-499 employees: 1 establishment)
Other Services (except Public Administration): Religious Organizations (100-249: 1, 20-49: 1, 10-19: 2, 5-9: 7, 1-4: 10)
2002 - 2018 National Fire Incident Reporting System (NFIRS) incidents
According to the data from the years 2002 - 2018 the average number of fires per year is 18. The highest number of reported fire incidents - 67 took place in 2016, and the least - 2 in 2010. The data has a growing trend.
When looking into fire subcategories, the most incidents belonged to: Structure Fires (63.3%), and Mobile Property/Vehicle Fires (17.0%).
Fire incident types reported to NFIRS in Zip Code 14211


 Nearest zip codes: 14212, 14206, 14215, 14208, 14214, 14210.


 According to the data from the years 2002 - 2018 the average number of fires per year is 18. The highest number of reported fire incidents - 67 took place in 2016, and the least - 2 in 2010. The data has a growing trend.
 When looking into fire subcategories, the most incidents belonged to: Structure Fires (63.3%), and Mobile Property/Vehicle Fires (17.0%).