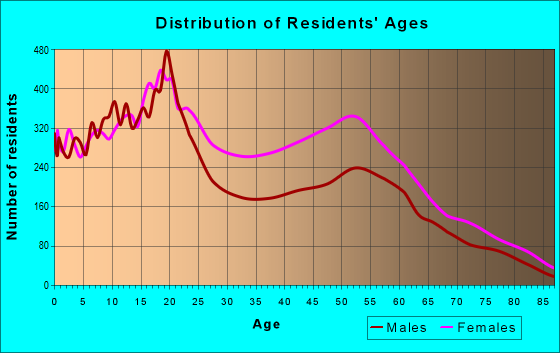
Estimated zip code population in 2022: 41,695 Zip code population in 2010: 39,999 Zip code population in 2000: 44,484
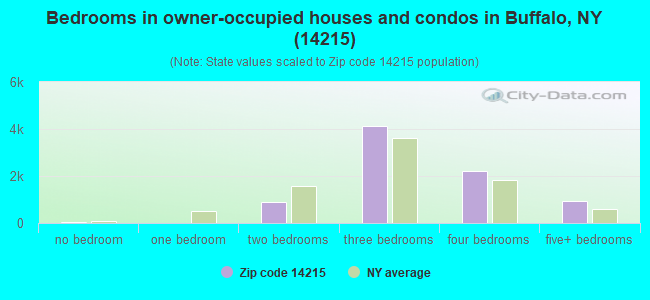
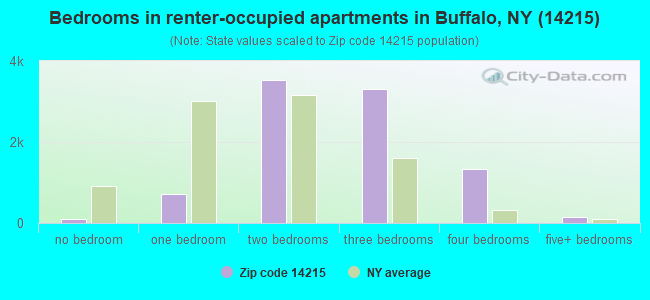
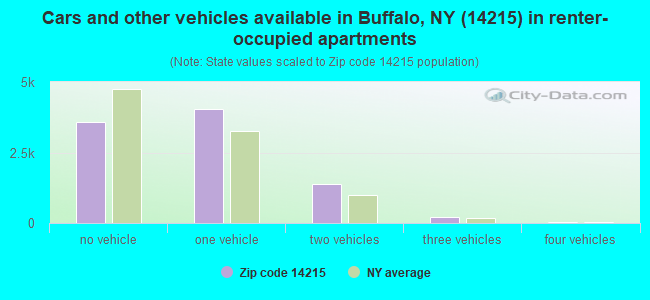
Houses and condos: 19,499 Renter-occupied apartments: 9,251
% of renters here:
53%
State:
46%
March 2022 cost of living index in zip code 14215: 100.5 (near average, U.S. average is 100)
Land area: 4.9 sq. mi. Water area: 0.0 sq. mi.
Population density: 8,486 people per square mile
(high).
OSM Map
General Map
Google Map
MSN Map
OSM Map
General Map
Google Map
MSN Map
OSM Map
General Map
Google Map
MSN Map
OSM Map
General Map
Google Map
MSN Map
Please wait while loading the map...
Real estate property taxes paid for housing units in 2022:
This zip code:
1.2% ($1,167)
New York:
1.5% ($6,180)
Median real estate property taxes paid for housing units with mortgages in 2022: $1,291 (1.2%) Median real estate property taxes paid for housing units with no mortgage in 2022: $955 (1.1%)
Averages for the 2020 tax year for zip code 14215, filed in 2021:
Average Adjusted Gross Income (AGI) in 2020: $33,955 (Individual Income Tax Returns)
Here:
$33,955
State:
$90,930
Salary/wage: $29,571 (reported on 84.8% of returns)
Here:
$29,571
State:
$72,104
(% of AGI for various income ranges: 1063.4% for AGIs below $25k, 3487.4% for AGIs $25k-50k, 6804.6% for AGIs $50k-75k, 10418.8% for AGIs $75k-100k, 15698.6% for AGIs $100k-200k)
Taxable interest for individuals: $325 (reported on 11.5% of returns)
This zip code:
$325
New York:
$3,075
(% of AGI for various income ranges: 2.1% for AGIs below $25k, 2.2% for AGIs $25k-50k, 13.0% for AGIs $50k-75k, 16.7% for AGIs $75k-100k, 38.0% for AGIs $100k-200k)
Ordinary dividends: $2,038 (reported on 4.5% of returns)
Here:
$2,038
State:
$11,095
(% of AGI for various income ranges: 2.3% for AGIs below $25k, 3.0% for AGIs $25k-50k, 13.6% for AGIs $50k-75k, 56.9% for AGIs $75k-100k, 244.6% for AGIs $100k-200k)
Net capital gain/loss in AGI: +$4,067 (reported on 3.6% of returns)
Here:
+$4,067
State:
+$44,925
(% of AGI for various income ranges: 1.3% for AGIs below $25k, 6.7% for AGIs $25k-50k, 21.3% for AGIs $50k-75k, 135.1% for AGIs $75k-100k, 352.3% for AGIs $100k-200k)
Profit/loss from business: +$5,436 (reported on 11.0% of returns)
Here:
+$5,436
State:
+$14,940
(% of AGI for various income ranges: 65.3% for AGIs below $25k, 55.9% for AGIs $25k-50k, 79.3% for AGIs $50k-75k, 164.3% for AGIs $75k-100k, 444.0% for AGIs $100k-200k)
Taxable individual retirement arrangement distribution: $11,894 (reported on 2.9% of returns)
14215:
$11,894
New York:
$19,609
(% of AGI for various income ranges: 9.4% for AGIs below $25k, 22.2% for AGIs $25k-50k, 105.1% for AGIs $50k-75k, 188.0% for AGIs $75k-100k, 597.4% for AGIs $100k-200k)
Total itemized deductions: $22,961 (reported on 1.8% of returns)
Here:
$22,961
State:
$39,326
(% of AGI for various income ranges: 7.1% for AGIs below $25k, 23.6% for AGIs $25k-50k, 128.9% for AGIs $50k-75k, 270.4% for AGIs $75k-100k, 812.6% for AGIs $100k-200k)
Charity contributions: $8,970 (reported on 1.5% of returns)
Here:
$8,970
State:
$15,420
(% of AGI for various income ranges: 7.8% for AGIs $25k-50k, 37.9% for AGIs $50k-75k, 103.9% for AGIs $75k-100k, 289.4% for AGIs $100k-200k)
Taxes paid: $5,862 (reported on 1.8% of returns)
14215:
$5,862
State:
$9,183
(% of AGI for various income ranges: 0.8% for AGIs below $25k, 6.2% for AGIs $25k-50k, 27.0% for AGIs $50k-75k, 84.9% for AGIs $75k-100k, 208.9% for AGIs $100k-200k)
Earned income credit: $2,625 (reported on 34.7% of returns)
Here:
$2,625
State:
$2,138
(% of AGI for various income ranges: 156.6% for AGIs below $25k, 112.3% for AGIs $25k-50k, 2.0% for AGIs $50k-75k)
Percentage of individuals using paid preparers for their 2020 taxes: 95.0%
Here:
95%
State:
95%
(% for various income ranges: 95.2% for AGIs below $25k, 95.2% for AGIs $25k-50k, 94.0% for AGIs $50k-75k, 94.9% for AGIs $75k-100k, 95.0% for AGIs $100k-200k, 100.0% for AGIs over 200k)
Averages for the 2012 tax year for zip code 14215, filed in 2013:
Average Adjusted Gross Income (AGI) in 2012: $29,467 (Individual Income Tax Returns)
Here:
$29,467
State:
$77,088
Salary/wage: $26,343 (reported on 88.6% of returns)
Here:
$26,343
State:
$60,593
(% of AGI for various income ranges: 79.5% for AGIs below $25k, 83.2% for AGIs $25k-50k, 78.5% for AGIs $50k-75k, 79.1% for AGIs $75k-100k, 74.8% for AGIs $100k-200k, 36.7% for AGIs over 200k)
Taxable interest for individuals: $306 (reported on 17.6% of returns)
This zip code:
$306
New York:
$3,125
(% of AGI for various income ranges: 0.2% for AGIs below $25k, 0.1% for AGIs $25k-50k, 0.3% for AGIs $50k-75k, 0.2% for AGIs $75k-100k, 0.1% for AGIs $100k-200k, 0.7% for AGIs over 200k)
Ordinary dividends: $1,648 (reported on 5.8% of returns)
Here:
$1,648
State:
$10,299
(% of AGI for various income ranges: 0.2% for AGIs below $25k, 0.2% for AGIs $25k-50k, 0.2% for AGIs $50k-75k, 0.4% for AGIs $75k-100k, 1.1% for AGIs $100k-200k)
Net capital gain/loss in AGI: +$933 (reported on 3.0% of returns)
Here:
+$933
State:
+$42,474
(% of AGI for various income ranges: 0.7% for AGIs $100k-200k)
Profit/loss from business: +$7,166 (reported on 8.5% of returns)
Here:
+$7,166
State:
+$16,168
(% of AGI for various income ranges: 5.1% for AGIs below $25k, 0.9% for AGIs $25k-50k, 0.8% for AGIs $50k-75k, 0.5% for AGIs $75k-100k, 3.0% for AGIs $100k-200k)
Taxable individual retirement arrangement distribution: $9,580 (reported on 3.6% of returns)
14215:
$9,580
New York:
$17,621
(% of AGI for various income ranges: 0.6% for AGIs below $25k, 0.7% for AGIs $25k-50k, 1.6% for AGIs $50k-75k, 1.3% for AGIs $75k-100k, 2.8% for AGIs $100k-200k)
Total itemized deductions: $14,956 (22% of AGI, reported on 11.5% of returns)
Here:
$14,956
State:
$34,985
Here:
22.0% of AGI
State:
21.3% of AGI
(% of AGI for various income ranges: 2.2% for AGIs below $25k, 4.1% for AGIs $25k-50k, 7.1% for AGIs $50k-75k, 9.1% for AGIs $75k-100k, 12.3% for AGIs $100k-200k, 15.5% for AGIs over 200k)
Charity contributions: $4,242 (reported on 9.6% of returns)
Here:
$4,242
State:
$5,572
(% of AGI for various income ranges: 0.3% for AGIs below $25k, 0.9% for AGIs $25k-50k, 1.6% for AGIs $50k-75k, 2.7% for AGIs $75k-100k, 3.2% for AGIs $100k-200k, 2.1% for AGIs over 200k)
Taxes paid: $5,292 (reported on 11.4% of returns)
14215:
$5,292
State:
$18,656
(% of AGI for various income ranges: 0.4% for AGIs below $25k, 1.2% for AGIs $25k-50k, 2.6% for AGIs $50k-75k, 3.6% for AGIs $75k-100k, 5.1% for AGIs $100k-200k, 6.8% for AGIs over 200k)
Earned income credit: $2,531 (reported on 38.4% of returns)
Here:
$2,531
State:
$2,230
(% of AGI for various income ranges: 11.4% for AGIs below $25k, 1.6% for AGIs $25k-50k)
Percentage of individuals using paid preparers for their 2012 taxes: 52.6%
Here:
53%
State:
66%
(% for various income ranges: 51.8% for AGIs below $25k, 48.8% for AGIs $25k-50k, 60.8% for AGIs $50k-75k, 60.9% for AGIs $75k-100k, 66.7% for AGIs $100k-200k, 66.7% for AGIs over 200k)
Averages for the 2004 tax year for zip code 14215, filed in 2005:
Average Adjusted Gross Income (AGI) in 2004: $27,109 (Individual Income Tax Returns)
Here:
$27,109
State:
$59,519
Salary/wage: $25,635 (reported on 89.9% of returns)
Here:
$25,635
State:
$50,673
(% of AGI for various income ranges: 87.3% for AGIs below $10k, 83.5% for AGIs $10k-25k, 87.0% for AGIs $25k-50k, 84.9% for AGIs $50k-75k, 87.0% for AGIs $75k-100k, 77.1% for AGIs over 100k)
Taxable interest for individuals: $554 (reported on 27.2% of returns)
This zip code:
$554
New York:
$2,377
(% of AGI for various income ranges: 0.9% for AGIs below $10k, 0.5% for AGIs $10k-25k, 0.4% for AGIs $25k-50k, 0.5% for AGIs $50k-75k, 0.7% for AGIs $75k-100k, 0.8% for AGIs over 100k)
Taxable dividends: $1,256 (reported on 9.8% of returns)
Here:
$1,256
State:
$5,394
(% of AGI for various income ranges: 0.6% for AGIs below $10k, 0.3% for AGIs $10k-25k, 0.2% for AGIs $25k-50k, 0.5% for AGIs $50k-75k, 0.6% for AGIs $75k-100k, 1.1% for AGIs over 100k)
Net capital gain/loss: +$1,293 (reported on 5.3% of returns)
Here:
+$1,293
State:
+$23,581
(% of AGI for various income ranges: -0.3% for AGIs below $10k, 0.1% for AGIs $10k-25k, 0.1% for AGIs $25k-50k, 0.2% for AGIs $50k-75k, 0.6% for AGIs $75k-100k, 1.3% for AGIs over 100k)
Profit/loss from business: +$4,631 (reported on 7.4% of returns)
Here:
+$4,631
State:
+$13,809
(% of AGI for various income ranges: 2.6% for AGIs below $10k, 2.1% for AGIs $10k-25k, 0.7% for AGIs $25k-50k, 0.6% for AGIs $50k-75k, 0.4% for AGIs $75k-100k, 3.3% for AGIs over 100k)
IRA payment deduction: $1,896 (reported on 1.3% of returns)
14215:
$1,896
New York:
$3,115
Self-employed pension: $7,000 (reported on 0.1% of returns)
Here:
$7,000
New York:
$19,016
Total itemized deductions: $12,832 (23% of AGI, reported on 18.0% of returns)
Here:
$12,832
State:
$25,864
Here:
22.5% of AGI
State:
21.9% of AGI
(% of AGI for various income ranges: 2.8% for AGIs below $10k, 3.8% for AGIs $10k-25k, 7.6% for AGIs $25k-50k, 11.3% for AGIs $50k-75k, 13.1% for AGIs $75k-100k, 13.8% for AGIs over 100k)
Charity contributions deductions: $3,530 (6% of AGI, reported on 16.5% of returns)
Here:
$3,530
State:
$4,439
Here:
6.0% of AGI
State:
3.6% of AGI
(% of AGI for various income ranges: 0.3% for AGIs below $10k, 0.7% for AGIs $10k-25k, 1.9% for AGIs $25k-50k, 3.0% for AGIs $50k-75k, 3.4% for AGIs $75k-100k, 3.9% for AGIs over 100k)
Total tax: $3,431 (reported on 58.6% of returns)
14215:
$3,431
State:
$11,730
(% of AGI for various income ranges: 1.3% for AGIs below $10k, 2.8% for AGIs $10k-25k, 6.3% for AGIs $25k-50k, 9.6% for AGIs $50k-75k, 11.4% for AGIs $75k-100k, 15.8% for AGIs over 100k)
Earned income credit: $2,034 (reported on 36.3% of returns)
Here:
$2,034
State:
$1,757
Percentage of individuals using paid preparers for their 2004 taxes: 69.3%
Here:
69%
State:
67%
(% for various income ranges: 65.1% for AGIs below $10k, 73.5% for AGIs $10k-25k, 67.9% for AGIs $25k-50k, 68.6% for AGIs $50k-75k, 70.4% for AGIs $75k-100k, 71.8% for AGIs over 100k)
Likely homosexual households (counted as self-reported same-sex unmarried-partner households)
Lesbian couples: 0.0% of all households
Gay men: 0.0% of all households
Household received Food Stamps/SNAP in the past 12 months: 6,351 Household did not receive Food Stamps/SNAP in the past 12 months: 11,580
Women who had a birth in the past 12 months: 639 (203 now married, 448 unmarried) Women who did not have a birth in the past 12 months: 11,434 (2,139 now married, 9,393 unmarried)
Housing units in zip code 14215 with a mortgage: 4,579 (257 second mortgage, 63 home equity loan, 147 both second mortgage and home equity loan) Houses without a mortgage: 271
Median monthly owner costs for units with a mortgage: $905 Median monthly owner costs for units without a mortgage: $433
Residents with income below the poverty level in 2022:
This zip code:
32.0%
Whole state:
14.3%
Residents with income below 50% of the poverty level in 2022:
This zip code:
14.6%
Whole state:
6.8%
Median number of rooms in houses and condos:
Here:
6.6
State:
6.3
Median number of rooms in apartments:
Here:
5.5
State:
3.8
Notable locations in this zip code not listed on our city pages
Notable locations in zip code 14215: Grover Cleveland Golf Course (A), Buffalo Public Library East Delavan Branch (B). Display/hide their locations on the map
Churches in zip code 14215 include: Bailey Avenue African Methodist Episcopal Zion Church (A), Calvary's Rock Fellowship (B), Church of God of Prophecy (C), Cleveland Hill Lutheran Church (D), Cleveland Hill United Methodist Church (E), Edison Street Baptist Church (F), End Time Revival Center Church (G), Expressway Assembly of God (H), Faith Bible Tabernacle (I). Display/hide their locations on the map
2,689 married couples with children.
5,977 single-parent households (789 men, 5,188 women).
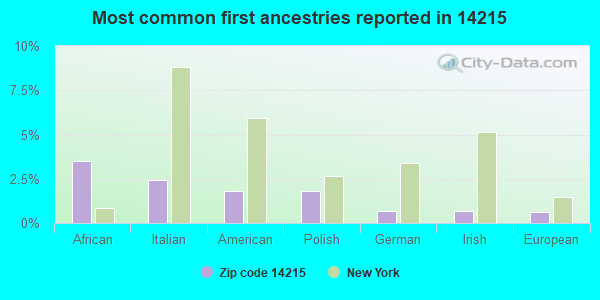
88.2% of residents of 14215 zip code speak English at home.
3.6% of residents speak Spanish at home (77% very well, 8% well, 8% not well, 7% not at all).
4.4% of residents speak other Indo-European language at home (56% very well, 34% well, 8% not well, 1% not at all).
1.1% of residents speak Asian or Pacific Island language at home (74% very well, 20% well, 4% not well, 2% not at all).
2.2% of residents speak other language at home (49% very well, 37% well, 11% not well, 3% not at all).
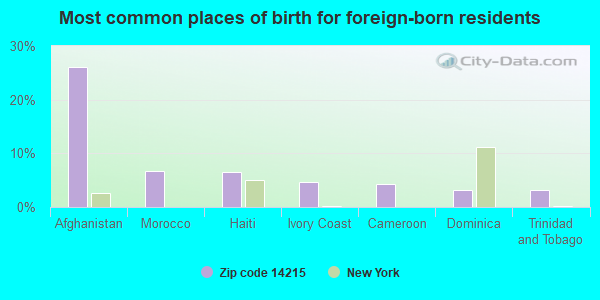
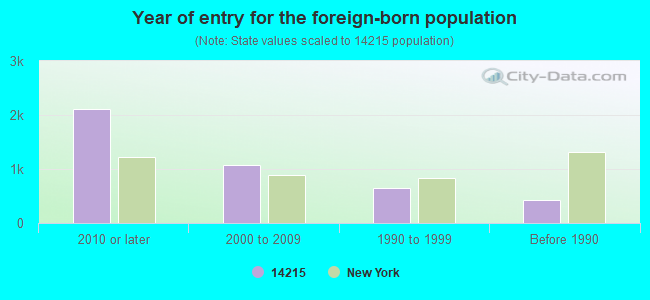
Foreign born population: 3,477 (8.3%) (59.0% of them are naturalized citizens)
Major facilities with environmental interests located in this zip code:
INTERNATIONAL EXTRUDED PRODUCTS (60 GRIDER STREET in BUFFALO, NY) . Federal Facility. U.S. AIR FORCE
STATE MASTER (New York facility tracking) - AIR PROGRAM, (Integrated Compliance Information System) - ICIS-02-1993-0215, FORMAL ENFORCEMENT ACTION COMPLIANCE ACTIVITY (Tracking inspections of insecticide, fungicide, and rodenticide, and toxic substances) HAZARDOUS WASTE BIENNIAL REPORTER (Resource Conservation and Recovery Act (tracking hazardous waste)) (Resource Conservation and Recovery Act (tracking hazardous waste)) TRI REPORTER (Tracking of toxic chemicals releasing facilities) Business SIC classification: STEEL PIPE AND TUBES; IRON AND STEEL FORGINGS Business NAICS classification: IRON AND STEEL PIPE AND TUBE MANUFACTURING FROM PURCHASED STEEL. Organizations: CURTISS WRIGHT CORP (LEGALLY RESPONSIBLE PARTY)
Alternative names: CURTIS WRIGHT CORP, CURTISS WRIGHT CORP, CURTISS WRIGHT CORPORATION INTERNATIONAL EXTRUDED PRODUCTS L L C
AMERICAN AXLE & MANUFACTURING INC. BUFFALO FACILITY (1001 EAST DELAVAN AVENUE in BUFFALO, NY)
AIR SYNTHETIC MINOR (AIRS/AFS) COMPLIANCE ACTIVITY (Tracking inspections of insecticide, fungicide, and rodenticide, and toxic substances) CRITERIA AND HAZARDOUS AIR POLLUTANT INVENTORY (Inventory of air pollution sources) HAZARDOUS WASTE BIENNIAL REPORTER (Resource Conservation and Recovery Act (tracking hazardous waste)) Large Quantity Generators, more that 1000 kg of hazardous waste/month (Resource Conservation and Recovery Act (tracking hazardous waste)) - notification TRI REPORTER (Tracking of toxic chemicals releasing facilities) - ICIS-, ENFORCEMENT/COMPLIANCE ACTIVITY, ICIS-02-2004-4207, FORMAL ENFORCEMENT ACTION Business SIC classification: MOTOR VEHICLE PARTS AND ACCESSORIES Organizations: AMERICAN AXLE & MANUFACTURING, INC. (CONTACT/OPERATOR)
Alternative names: AMERICAN AXEL, AMERICAN AXLE & MFG BUFFALO PLANT
BENTLEY MARBLE CORP (671 WYOMING AVE in BUFFALO, NY)
AIR MINOR (AIRS/AFS) STATE MASTER (New York facility tracking) - AIR PROGRAM, (Resource Conservation and Recovery Act (tracking hazardous waste)) Business SIC classification: CUT STONE AND STONE PRODUCTS Business NAICS classification: CUT STONE AND STONE PRODUCT MANUFACTURING. Alternative names: VENETIAN MARBLE CO
HOBSONS ONE HOUR DRY CLEANERS (874 E DELAVAN AVE in BUFFALO, NY)
AIR MINOR (AIRS/AFS) STATE MASTER (New York facility tracking) - AIR PROGRAM (Resource Conservation and Recovery Act (tracking hazardous waste)) Business SIC classification: DRYCLEANING PLANTS, EXCEPT RUG CLEANING Business NAICS classification: DRYCLEANING AND LAUNDRY SERVICES (EXCEPT COIN-OPERATED). Alternative names: HOBSON CLEANERS
COMM CHARTER SCHOOL ( in BUFFALO, NY)
(National Center for Education Statistics) - STATE ID-140600860843
AMERIMART DEVELOPMENT CORPORATION (1440 KENSINGTON AVENUE in BUFFALO, NY)
ENFORCEMENT/COMPLIANCE ACTIVITY (Integrated Compliance Information System) (Resource Conservation and Recovery Act (tracking hazardous waste)) Alternative names: NYO007003007
501 CORNWALL CORP (501 CORNWALL AVE in BUFFALO, NY)
(Resource Conservation and Recovery Act (tracking hazardous waste))
ALLIANCE ENERGY INC (2885 BAILEY AVE in BUFFALO, NY)
Conditionally Exempt Small Quantity Generators, less than 100 kg/month of hazardous waste (Resource Conservation and Recovery Act (tracking hazardous waste)) Organizations: ROBERT M SNYDER (CONTACT/OPERATOR)
, JOSEPH P ALONGE (CONTACT/OWNER)
Alternative names: RECYCLE TEC INC
H & R TOOL WORKS INC (65 CLYDE AVE in BUFFALO, NY)
(Resource Conservation and Recovery Act (tracking hazardous waste)) Business NAICS classification: METAL STAMPING.; SPECIAL DIE AND TOOL, DIE SET, JIG, AND FIXTURE MANUFACTURING.
INNOVATIVE CONCEPTS IN ENTERTAINMENT INC (1501 KENSINGTON AVE in BUFFALO, NY)
(Resource Conservation and Recovery Act (tracking hazardous waste))
CUMBERLAND FARMS (1055 GENESEE ST & FILLMORE in BUFFALO, NY)
(Resource Conservation and Recovery Act (tracking hazardous waste))
CUMBERLAND FARMS #3215 (155 BAILEY AVE & MCKINLEY ST in BUFFALO, NY)
(Resource Conservation and Recovery Act (tracking hazardous waste))
APPLIED GLASSTEC INC (203 EGGERT RD in BUFFALO, NY)
Small Quantity Generators, between 100 kg and 1000 kg of hazardous waste/month (Resource Conservation and Recovery Act (tracking hazardous waste)) - notification
Housing units lacking complete plumbing facilities: 1.4% Housing units lacking complete kitchen facilities: 5.5%
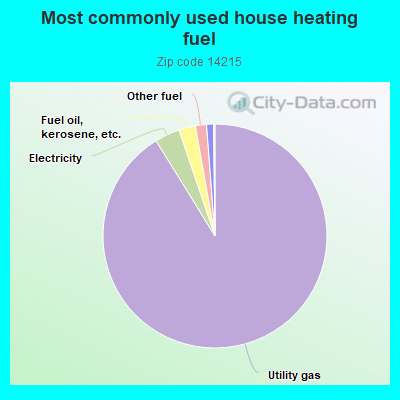
91.2%Utility gas
3.6%Electricity
2.4%Fuel oil, kerosene, etc.
1.6%Other fuel
1.0%Bottled, tank, or LP gas
Population in 1990: 46,789.
Place of birth for U.S.-born residents:
This state: 32,374
Northeast: 451
Midwest: 1,003
South: 3,265
West: 380
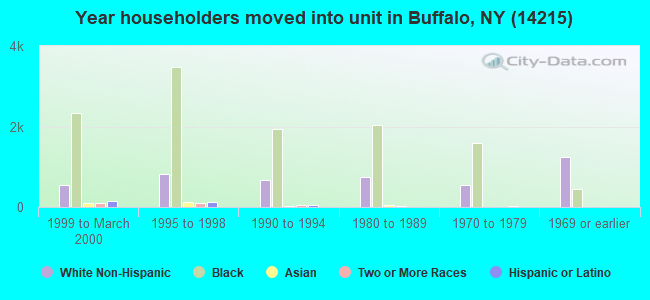
58% of the 14215 zip code residents lived in the same house 5 years ago. Out of people who lived in different houses, 86% lived in this county. Out of people who lived in different counties, 50% lived in New York.
91% of the 14215 zip code residents lived in the same house 1 year ago. Out of people who lived in different houses, 67% moved from this county. Out of people who lived in different houses, 19% moved from different county within same state. Out of people who lived in different houses, 9% moved from different state. Out of people who lived in different houses, 3% moved from abroad.
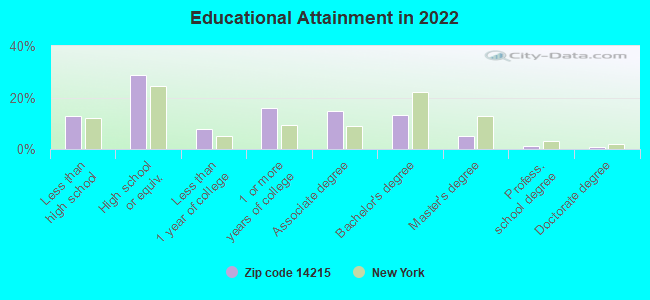
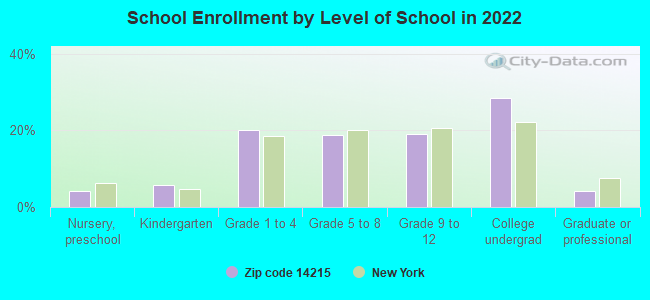
Private vs. public school enrollment:
Students in private schools in grades 1 to 8 (elementary and middle school): 457
Here:
9.6%
New York:
15.6%
Students in private schools in grades 9 to 12 (high school): 252
Here:
10.9%
New York:
15.0%
Students in private undergraduate colleges: 881
Here:
25.7%
New York:
39.2%
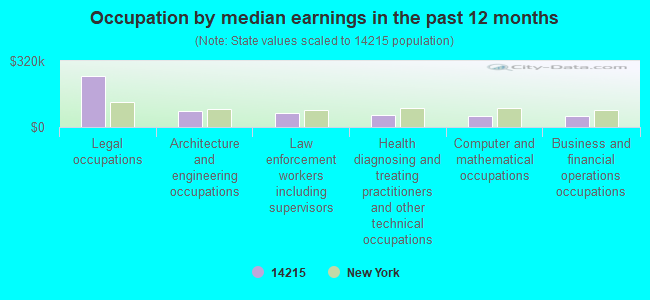
Occupation by median earnings in the past 12 months ($)
247,483Legal occupations
78,995Architecture and engineering occupations
65,844Law enforcement workers including supervisors
59,947Health diagnosing and treating practitioners and other technical occupations
55,365Computer and mathematical occupations
53,300Business and financial operations occupations
Companies with federal contracts located in this zip code (BUFFALO, NY):
L & S CONSTRUCTION, LLC (432 WILLIAM GAITER PARKWAY; small business) : $3,420,592 in 3 contractsfrom 2001 to 2002
$3,333,723 with Army for Construction of Structures and Facilities -- Airport Runways. Signed on 2001-09-17. Completion date: 2002-08-09.
$58,957, same as above.Signed on 2002-08-27. Completion date: 2002-08-09.
$27,912, same as above.Signed on 2002-06-18. Completion date: 2002-08-09.
WINFIELD INDUSTRIES INCORPORAT (852 KENSINGTON AVE; small business) : $1,569,167 in 7 contractsfrom 2000 to 2002
Contracts for Vehicular Brake, Steering, Axle, Wheel, and Track Components by Defense Logistics Agency, Army Signed by year:2000: $504,988; 2001: $1,019,371; 2002: $44,808; 2003: $0; 2004: $0; 2005: $0; 2006: $0.
Biggest contracts:
$515,846 with Defense Logistics Agency for Vehicular Brake, Steering, Axle, Wheel, and Track Components. Signed on 2001-02-23. Completion date: 2001-08-02.
$346,047, same as above.Signed on 2001-05-22. Completion date: 2001-11-03.
$252,494, same as above.Signed on 2000-08-08. Completion date: 2001-01-06.
$252,494, same as above.Signed on 2000-08-08. Completion date: 2001-01-06.
HARD MANUFACTURING CO, INC (230 GRIDER ST; small business) : $518,765 in 21 contractsfrom 1999 to 2006
Contracts for Hospital Furniture, Equipment, Utensils, and Supplies, Chemical Analysis Instruments, Medical and Surgical Instruments, Equipment, and Supplies, Office Furniture, and moreby Defense Logistics Agency, Army, NASA, Navy, and others Signed by year:2000: $0; 2001: $27,292; 2002: $0; 2003: $31,091; 2004: $22,506; 2005: $347,377; 2006: $61,417.
Biggest contracts:
$246,950 with Defense Logistics Agency for Hospital Furniture, Equipment, Utensils, and Supplies. Signed on 2005-07-08. Completion date: 2005-08-08.
$37,042 with Defense Logistics Agency for Chemical Analysis Instruments. Signed on 2005-10-20. Completion date: 2005-12-10.
$29,082 with Army for Medical and Surgical Instruments, Equipment, and Supplies. Taking place in GA. Signed on 1999-11-29. Completion date: 2000-01-17.
$27,292 with Army for Office Furniture. Taking place in KS. Signed on 2001-02-02. Completion date: 2001-03-10.
APX SCIENTIFIC INSTRUMENTS, IN (25-60 CLYDE AVE; small business)
$38,000 with NASA for Pressure, Temperature, and Humidity Measuring and Controlling Instruments. Signed on 2002-04-15. Completion date: 2002-07-15.
APPALOOSA PRODUCTIONS LTD (108 LEONARD STREET; small business)
$22,500 with U.S. Army Corps of Engineers - civil program financing only for Technical Writing Services. Signed on 2002-09-26. Completion date: 2002-12-30.
PROPERTY INNOVATORS INC (790 E BELAFAN AVE; small business) 3 employees, $60000 revenue. 8A Firm, Small Disadvantaged Business, Woman Owned Business, Veteran Owned Business: $12,000 in 3 contractsin 2001
$11,000 with Public Buildings Service for Maintenance, Repair or Alteration of Real Property -- Office Buildings. Signed on 2001-09-15. Completion date: 2001-12-15.
$1,000, same as above.Signed on 2001-11-15. Completion date: 2001-12-15.
$0, same as above.Signed on 2001-11-15. Completion date: 2001-12-15.
AMERICAN RATED CABLE AND COMMU (790 E. DELAVAN AVE.; small business)
$9,488 with Army for Maintenance, Repair or Alteration of Real Property -- Other Residential Buildings. Signed on 2000-07-20. Completion date: 2000-07-20.
Top industries in this zip code by the number of employees in 2005:
Health Care and Social Assistance: General Medical and Surgical Hospitals (over 1000 employees: 2 establishments)
Health Care and Social Assistance: Offices of Physicians (except Mental Health Specialists) (50-99: 3, 20-49: 4, 10-19: 5, 5-9: 8, 1-4: 8)
Administrative and Support and Waste Management and Remediation Services: Janitorial Services (100-249: 1, 20-49: 1, 10-19: 1, 5-9: 7, 1-4: 7)
Other Services (except Public Administration): Religious Organizations (20-49: 2, 10-19: 3, 5-9: 6, 1-4: 13)
2004 - 2018 National Fire Incident Reporting System (NFIRS) incidents
According to the data from the years 2004 - 2018 the average number of fires per year is 39. The highest number of reported fire incidents - 91 took place in 2016, and the least - 8 in 2008. The data has a constant trend.
When looking into fire subcategories, the most reports belonged to: Structure Fires (61.3%), and Other (18.3%).
Fire incident types reported to NFIRS in Zip Code 14215
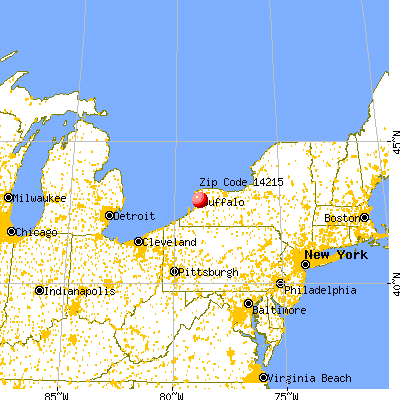


 Nearest zip codes: 14214, 14211, 14226, 14212, 14208, 14223.


 . Federal Facility. U.S. AIR FORCE
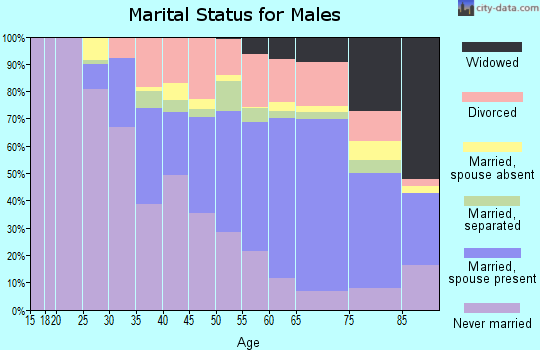
 According to the data from the years 2004 - 2018 the average number of fires per year is 39. The highest number of reported fire incidents - 91 took place in 2016, and the least - 8 in 2008. The data has a constant trend.
 When looking into fire subcategories, the most reports belonged to: Structure Fires (61.3%), and Other (18.3%).