Estimated zip code population in 2022: 20,603 Zip code population in 2010: 19,039 Zip code population in 2000: 20,203
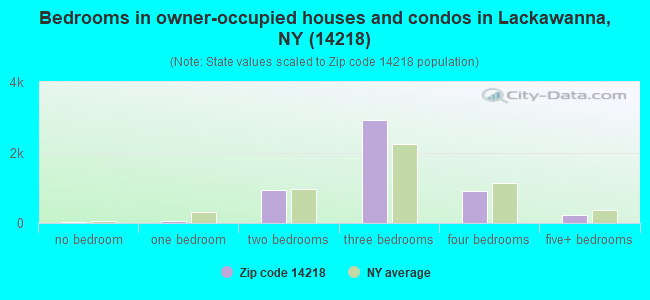
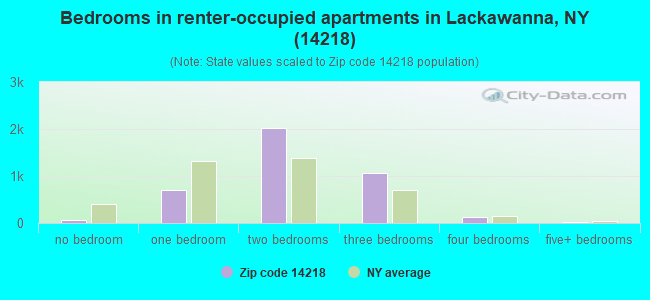
Houses and condos: 9,823 Renter-occupied apartments: 4,034
% of renters here:
44%
State:
46%
March 2022 cost of living index in zip code 14218: 100.4 (near average, U.S. average is 100)
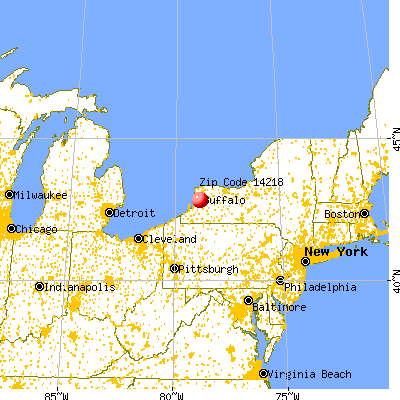
Land area: 8.2 sq. mi. Water area: 0.4 sq. mi.
Population density: 2,523 people per square mile
(average).
OSM Map
General Map
Google Map
MSN Map
OSM Map
General Map
Google Map
MSN Map
OSM Map
General Map
Google Map
MSN Map
OSM Map
General Map
Google Map
MSN Map
Please wait while loading the map...
Real estate property taxes paid for housing units in 2022:
This zip code:
2.8% ($3,556)
New York:
1.5% ($6,180)
Median real estate property taxes paid for housing units with mortgages in 2022: $3,637 (2.6%) Median real estate property taxes paid for housing units with no mortgage in 2022: $3,481 (2.9%)
Averages for the 2020 tax year for zip code 14218, filed in 2021:
Average Adjusted Gross Income (AGI) in 2020: $42,608 (Individual Income Tax Returns)
Here:
$42,608
State:
$90,930
Salary/wage: $37,447 (reported on 81.0% of returns)
Here:
$37,447
State:
$72,104
(% of AGI for various income ranges: 1035.3% for AGIs below $25k, 3326.6% for AGIs $25k-50k, 6076.8% for AGIs $50k-75k, 9049.6% for AGIs $75k-100k, 14622.6% for AGIs $100k-200k)
Taxable interest for individuals: $747 (reported on 25.1% of returns)
This zip code:
$747
New York:
$3,075
(% of AGI for various income ranges: 10.1% for AGIs below $25k, 10.4% for AGIs $25k-50k, 52.3% for AGIs $50k-75k, 37.5% for AGIs $75k-100k, 105.1% for AGIs $100k-200k)
Ordinary dividends: $2,056 (reported on 11.4% of returns)
Here:
$2,056
State:
$11,095
(% of AGI for various income ranges: 9.8% for AGIs below $25k, 14.3% for AGIs $25k-50k, 45.9% for AGIs $50k-75k, 74.7% for AGIs $75k-100k, 179.5% for AGIs $100k-200k)
Net capital gain/loss in AGI: +$4,569 (reported on 9.0% of returns)
Here:
+$4,569
State:
+$44,925
(% of AGI for various income ranges: 7.2% for AGIs below $25k, 9.5% for AGIs $25k-50k, 33.6% for AGIs $50k-75k, 132.2% for AGIs $75k-100k, 611.3% for AGIs $100k-200k)
Profit/loss from business: +$9,100 (reported on 9.5% of returns)
Here:
+$9,100
State:
+$14,940
(% of AGI for various income ranges: 71.7% for AGIs below $25k, 92.7% for AGIs $25k-50k, 106.5% for AGIs $50k-75k, 187.8% for AGIs $75k-100k, 465.9% for AGIs $100k-200k)
Taxable individual retirement arrangement distribution: $10,933 (reported on 7.2% of returns)
14218:
$10,933
New York:
$19,609
(% of AGI for various income ranges: 43.0% for AGIs below $25k, 55.1% for AGIs $25k-50k, 121.8% for AGIs $50k-75k, 295.1% for AGIs $75k-100k, 520.5% for AGIs $100k-200k)
Total itemized deductions: $21,242 (reported on 2.6% of returns)
Here:
$21,242
State:
$39,326
(% of AGI for various income ranges: 36.6% for AGIs $25k-50k, 126.5% for AGIs $50k-75k, 227.5% for AGIs $75k-100k, 439.2% for AGIs $100k-200k)
Charity contributions: $3,606 (reported on 1.9% of returns)
Here:
$3,606
State:
$15,420
(% of AGI for various income ranges: 2.9% for AGIs below $25k, 15.6% for AGIs $50k-75k, 41.6% for AGIs $75k-100k, 50.3% for AGIs $100k-200k)
Taxes paid: $7,900 (reported on 2.6% of returns)
14218:
$7,900
State:
$9,183
(% of AGI for various income ranges: 10.7% for AGIs $25k-50k, 49.0% for AGIs $50k-75k, 110.0% for AGIs $75k-100k, 143.1% for AGIs $100k-200k)
Earned income credit: $2,530 (reported on 21.8% of returns)
Here:
$2,530
State:
$2,138
(% of AGI for various income ranges: 114.8% for AGIs below $25k, 82.3% for AGIs $25k-50k, 1.8% for AGIs $50k-75k)
Percentage of individuals using paid preparers for their 2020 taxes: 95.9%
Here:
96%
State:
95%
(% for various income ranges: 95.8% for AGIs below $25k, 96.3% for AGIs $25k-50k, 95.7% for AGIs $50k-75k, 95.9% for AGIs $75k-100k, 96.7% for AGIs $100k-200k, 80.0% for AGIs over 200k)
Averages for the 2012 tax year for zip code 14218, filed in 2013:
Average Adjusted Gross Income (AGI) in 2012: $35,087 (Individual Income Tax Returns)
Here:
$35,087
State:
$77,088
Salary/wage: $32,033 (reported on 84.0% of returns)
Here:
$32,033
State:
$60,593
(% of AGI for various income ranges: 72.7% for AGIs below $25k, 80.0% for AGIs $25k-50k, 76.3% for AGIs $50k-75k, 78.3% for AGIs $75k-100k, 82.7% for AGIs $100k-200k)
Taxable interest for individuals: $647 (reported on 33.1% of returns)
This zip code:
$647
New York:
$3,125
(% of AGI for various income ranges: 0.8% for AGIs below $25k, 0.5% for AGIs $25k-50k, 0.6% for AGIs $50k-75k, 0.8% for AGIs $75k-100k, 0.5% for AGIs $100k-200k)
Ordinary dividends: $1,944 (reported on 13.8% of returns)
Here:
$1,944
State:
$10,299
(% of AGI for various income ranges: 0.9% for AGIs below $25k, 0.5% for AGIs $25k-50k, 0.7% for AGIs $50k-75k, 0.7% for AGIs $75k-100k, 1.3% for AGIs $100k-200k)
Net capital gain/loss in AGI: +$1,285 (reported on 7.8% of returns)
Here:
+$1,285
State:
+$42,474
(% of AGI for various income ranges: 0.3% for AGIs $50k-75k, 0.4% for AGIs $75k-100k, 1.1% for AGIs $100k-200k)
Profit/loss from business: +$8,280 (reported on 7.3% of returns)
Here:
+$8,280
State:
+$16,168
(% of AGI for various income ranges: 4.6% for AGIs below $25k, 1.0% for AGIs $25k-50k, 1.2% for AGIs $50k-75k, 1.1% for AGIs $75k-100k, 1.3% for AGIs $100k-200k)
Taxable individual retirement arrangement distribution: $7,933 (reported on 9.0% of returns)
14218:
$7,933
New York:
$17,621
(% of AGI for various income ranges: 2.4% for AGIs below $25k, 1.9% for AGIs $25k-50k, 1.9% for AGIs $50k-75k, 2.1% for AGIs $75k-100k, 2.4% for AGIs $100k-200k)
Total itemized deductions: $14,792 (21% of AGI, reported on 15.3% of returns)
Here:
$14,792
State:
$34,985
Here:
21.4% of AGI
State:
21.3% of AGI
(% of AGI for various income ranges: 3.0% for AGIs below $25k, 5.2% for AGIs $25k-50k, 6.1% for AGIs $50k-75k, 8.6% for AGIs $75k-100k, 12.4% for AGIs $100k-200k)
Charity contributions: $2,113 (reported on 12.1% of returns)
Here:
$2,113
State:
$5,572
(% of AGI for various income ranges: 0.3% for AGIs below $25k, 0.5% for AGIs $25k-50k, 0.7% for AGIs $50k-75k, 1.1% for AGIs $75k-100k, 1.5% for AGIs $100k-200k)
Taxes paid: $6,571 (reported on 15.3% of returns)
14218:
$6,571
State:
$18,656
(% of AGI for various income ranges: 0.9% for AGIs below $25k, 1.8% for AGIs $25k-50k, 2.7% for AGIs $50k-75k, 4.0% for AGIs $75k-100k, 7.0% for AGIs $100k-200k)
Earned income credit: $2,364 (reported on 23.4% of returns)
Here:
$2,364
State:
$2,230
(% of AGI for various income ranges: 7.2% for AGIs below $25k, 1.0% for AGIs $25k-50k)
Percentage of individuals using paid preparers for their 2012 taxes: 58.3%
Here:
58%
State:
66%
(% for various income ranges: 53.2% for AGIs below $25k, 59.1% for AGIs $25k-50k, 67.3% for AGIs $50k-75k, 66.7% for AGIs $75k-100k, 77.1% for AGIs $100k-200k)
Averages for the 2004 tax year for zip code 14218, filed in 2005:
Average Adjusted Gross Income (AGI) in 2004: $30,238 (Individual Income Tax Returns)
Here:
$30,238
State:
$59,519
Salary/wage: $29,117 (reported on 83.3% of returns)
Here:
$29,117
State:
$50,673
(% of AGI for various income ranges: 76.7% for AGIs below $10k, 75.0% for AGIs $10k-25k, 82.1% for AGIs $25k-50k, 82.4% for AGIs $50k-75k, 80.7% for AGIs $75k-100k, 79.4% for AGIs over 100k)
Taxable interest for individuals: $1,019 (reported on 48.2% of returns)
This zip code:
$1,019
New York:
$2,377
(% of AGI for various income ranges: 3.3% for AGIs below $10k, 2.1% for AGIs $10k-25k, 1.2% for AGIs $25k-50k, 1.2% for AGIs $50k-75k, 1.4% for AGIs $75k-100k, 2.8% for AGIs over 100k)
Taxable dividends: $935 (reported on 19.8% of returns)
Here:
$935
State:
$5,394
(% of AGI for various income ranges: 1.2% for AGIs below $10k, 0.8% for AGIs $10k-25k, 0.5% for AGIs $25k-50k, 0.5% for AGIs $50k-75k, 0.4% for AGIs $75k-100k, 1.1% for AGIs over 100k)
Net capital gain/loss: +$819 (reported on 11.5% of returns)
Here:
+$819
State:
+$23,581
(% of AGI for various income ranges: -0.6% for AGIs below $10k, 0.1% for AGIs $10k-25k, 0.1% for AGIs $25k-50k, 0.2% for AGIs $50k-75k, 0.5% for AGIs $75k-100k, 1.7% for AGIs over 100k)
Profit/loss from business: +$6,192 (reported on 6.7% of returns)
Here:
+$6,192
State:
+$13,809
(% of AGI for various income ranges: 2.6% for AGIs below $10k, 1.8% for AGIs $10k-25k, 1.0% for AGIs $25k-50k, 0.6% for AGIs $50k-75k, 1.6% for AGIs $75k-100k, 2.8% for AGIs over 100k)
IRA payment deduction: $2,590 (reported on 2.1% of returns)
14218:
$2,590
New York:
$3,115
Total itemized deductions: $12,563 (21% of AGI, reported on 16.9% of returns)
Here:
$12,563
State:
$25,864
Here:
20.6% of AGI
State:
21.9% of AGI
(% of AGI for various income ranges: 1.9% for AGIs below $10k, 2.9% for AGIs $10k-25k, 6.1% for AGIs $25k-50k, 8.2% for AGIs $50k-75k, 10.8% for AGIs $75k-100k, 12.0% for AGIs over 100k)
Charity contributions deductions: $1,894 (3% of AGI, reported on 15.6% of returns)
Here:
$1,894
State:
$4,439
Here:
3.0% of AGI
State:
3.6% of AGI
(% of AGI for various income ranges: 0.1% for AGIs below $10k, 0.5% for AGIs $10k-25k, 0.8% for AGIs $25k-50k, 1.1% for AGIs $50k-75k, 1.6% for AGIs $75k-100k, 1.9% for AGIs over 100k)
Total tax: $3,515 (reported on 70.1% of returns)
14218:
$3,515
State:
$11,730
(% of AGI for various income ranges: 1.4% for AGIs below $10k, 3.8% for AGIs $10k-25k, 7.1% for AGIs $25k-50k, 9.3% for AGIs $50k-75k, 11.0% for AGIs $75k-100k, 15.3% for AGIs over 100k)
Earned income credit: $1,714 (reported on 19.8% of returns)
Here:
$1,714
State:
$1,757
Percentage of individuals using paid preparers for their 2004 taxes: 64.7%
Here:
65%
State:
67%
(% for various income ranges: 60.5% for AGIs below $10k, 64.6% for AGIs $10k-25k, 64.3% for AGIs $25k-50k, 68.2% for AGIs $50k-75k, 72.3% for AGIs $75k-100k, 75.5% for AGIs over 100k)
Likely homosexual households (counted as self-reported same-sex unmarried-partner households)
Lesbian couples: 0.1% of all households
Gay men: 0.1% of all households
Household received Food Stamps/SNAP in the past 12 months: 2,616 Household did not receive Food Stamps/SNAP in the past 12 months: 6,648
Women who had a birth in the past 12 months: 339 (144 now married, 200 unmarried) Women who did not have a birth in the past 12 months: 4,287 (1,469 now married, 2,822 unmarried)
Housing units in zip code 14218 with a mortgage: 2,678 (218 second mortgage, 43 home equity loan, 145 both second mortgage and home equity loan) Houses without a mortgage: 299
Median monthly owner costs for units with a mortgage: $1,172 Median monthly owner costs for units without a mortgage: $567
Residents with income below the poverty level in 2022:
This zip code:
21.4%
Whole state:
14.3%
Residents with income below 50% of the poverty level in 2022:
This zip code:
9.3%
Whole state:
6.8%
Median number of rooms in houses and condos:
Here:
5.9
State:
6.3
Median number of rooms in apartments:
Here:
4.3
State:
3.8
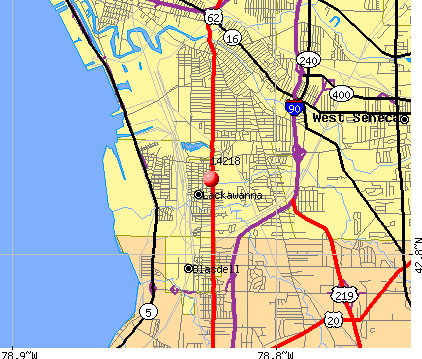
Notable locations in this zip code not listed on our city pages
Notable locations in zip code 14218: North Side Light (A), South Side Light (B), McKinley Circle (C), Lackawanna Toll Plaza (D), Lackawanna Wastewater Treatment Plant (E), South Park Stadium (F), Lackawanna Fire Department (G), Lackawanna Public Library (H). Display/hide their locations on the map
Churches in zip code 14218 include: Saint Michaels Church (A), Abundant Life Enlightenment Church (B), Bethel Assembly of God Lackawanna (C), Bethel Presbyterian Church (D), Croatian Roman Catholic Church (E), Ebenezer Baptist Church (F), First Baptist Church (G), Kingdom Hall of Jehovah's Witnesses (H), Lackawanna Church of God (I). Display/hide their locations on the map
2,471 married couples with children.
1,382 single-parent households (482 men, 900 women).
80.7% of residents of 14218 zip code speak English at home.
5.1% of residents speak Spanish at home (76% very well, 18% well, 6% not well).
2.1% of residents speak other Indo-European language at home (64% very well, 20% well, 16% not well).
0.4% of residents speak Asian or Pacific Island language at home (68% very well, 32% not well).
12.4% of residents speak other language at home (54% very well, 31% well, 10% not well, 5% not at all).
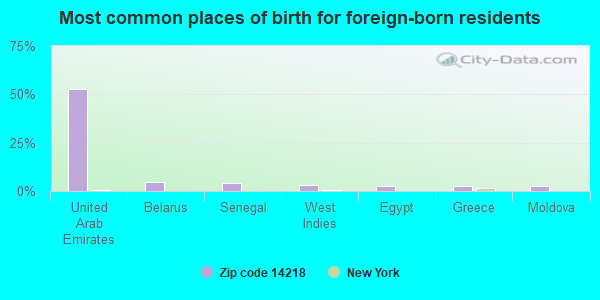
Foreign born population: 1,609 (7.8%) (71.8% of them are naturalized citizens)
This zip code:
7.8%
Whole state:
22.7%
53%United Arab Emirates
4%Belarus
4%Senegal
3%West Indies
3%Egypt
2%Greece
2%Moldova
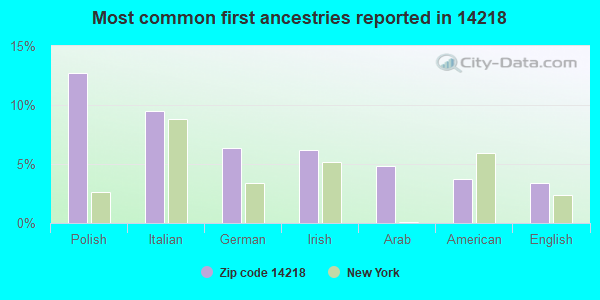
13%Polish
9%Italian
6%German
6%Irish
5%Arab
4%American
3%English
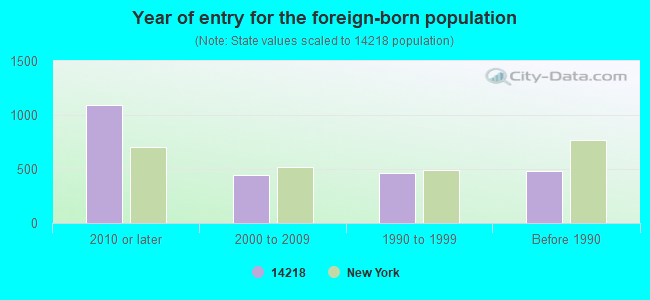
Year of entry for the foreign-born population
1,0902010 or later
4442000 to 2009
4661990 to 1999
480Before 1990
Facilities with environmental interests located in this zip code:
BETHLEHEM STEEL CORPORATION LACKAWANNA (1951 HAMBURG TURNPIKE in LACKAWANNA, NY)
AIR MAJOR (AIRS/AFS) ENFORCEMENT/COMPLIANCE ACTIVITY (Integrated Compliance Information System) - ICIS-02-1992-0042, FORMAL ENFORCEMENT ACTION, ICIS-02-1987-0235, ICIS-02-1989-0046, ICIS-02-1989-0047, ICIS-02-1999-0510, (Integrated Compliance Information System) - ICIS-02-1992-0042, FORMAL ENFORCEMENT ACTION, ICIS-02-1987-0235, ICIS-02-1989-0046, ICIS-02-1989-0047, ICIS-02-1999-0510, COMPLIANCE ACTIVITY (Tracking inspections of insecticide, fungicide, and rodenticide, and toxic substances) CRITERIA AND HAZARDOUS AIR POLLUTANT INVENTORY (Inventory of air pollution sources) Business SIC classification: STEEL WORKS, BLAST FURNACES (INCLUDING COKE OVENS), AND ROLLING MILLS; TRANSPORTATION SERVICES Alternative names: BETH ENERGY, BETHENERGY LACK COKE, BETHENERGY LACK COKE LA, BETHENERGY LACKAWANNA COKE DIVISION, BETHLEHEM STEEL CORP-GALVANIZED PRODUCT, BETHLEHEM STEEL CORPORATION LACKAWANNA COKE DIVISION, BETHLEHEM STEEL CORPORATION LACKAWANNA PLANT, BETHLEHEM STEEL-BAR ROD & WIRE DIV, BETHLEHEM STEEL-BETHENERGY/RECLAMAT-DIV
INDEPENDENT CEMENT CORP (1751 FUHRMANN BLVD in BUFFALO, NY)
STATE MASTER (New York facility tracking) - AIR PROGRAM, (Integrated Compliance Information System) - ICIS-02-1994-0029, FORMAL ENFORCEMENT ACTION COMPLIANCE ACTIVITY (Tracking inspections of insecticide, fungicide, and rodenticide, and toxic substances) Business SIC classification: CEMENT, HYDRAULIC Business NAICS classification: CEMENT MANUFACTURING. Organizations: ST LAWRENCE CEMENT CO LLC (LEGALLY RESPONSIBLE PARTY)
STATE MASTER (New York facility tracking) - HAZARDOUS WASTE PROGRAM (Integrated Compliance Information System) - ICIS-02-1992-0014, FORMAL ENFORCEMENT ACTION, ICIS-02-1986-0015, ICIS-02-1990-0177, CRITERIA AND HAZARDOUS AIR POLLUTANT INVENTORY (Inventory of air pollution sources) Business SIC classification: STEEL WORKS, BLAST FURNACES (INCLUDING COKE OVENS), AND ROLLING MILLS Alternative names: BETHENERGY LACK COKE, BETHENERGY LACK COKE LA, BETHENERGY LACKAWANNA COKE DIVISION, BETHLEHEM STEEL CORPORATION, BETHLEHEM STEEL CORPORATION LACKAWANNA, BETHLEHEM STEEL CORPORATION LACKAWANNA COKE DIVISION, BETHLEHEM STEEL-BAR ROD & WIRE DIV
BETHLEHEM STEEL CORPORATION (2600 HAMBURG TURNPIKE in LACKAWANNA, NY)
(Integrated Compliance Information System) - ICIS-02-1991-0197, FORMAL ENFORCEMENT ACTION COMPLIANCE ACTIVITY (Tracking inspections of insecticide, fungicide, and rodenticide, and toxic substances) HAZARDOUS WASTE BIENNIAL REPORTER (Resource Conservation and Recovery Act (tracking hazardous waste)) TSD (Resource Conservation and Recovery Act (tracking hazardous waste)) - notification (Resource Conservation and Recovery Act (tracking hazardous waste)) Business SIC classification: RAILROAD SWITCHING AND TERMINAL ESTABLISHMENTS Business NAICS classification: ROLLED STEEL SHAPE MANUFACTURING. Alternative names: BETHENERGY LACK COKE, BETHENERGY LACK COKE LA, BETHENERGY LACKAWANNA COKE DIVISION, BETHLEHEM STEEL CORPORATION LACKAWANNA, BETHLEHEM STEEL CORPORATION LACKAWANNA COKE DIVISION, BETHLEHEM STEEL CORPORATION LACKAWANNA PLANT, BETHLEHEM STEEL-BAR ROD & WIRE DIV, SOUTH BUFFALO RAILWAY CO
HAZMAT ENVIRONMENTAL GROUP (60 COMMERCE DRIVE in LACKAWANNA, NY)
STATE MASTER (New York facility tracking) - National Pollutant Discharge Elimination System Permit TRANSPORTER (Resource Conservation and Recovery Act (tracking hazardous waste)) - notification (Resource Conservation and Recovery Act (tracking hazardous waste)) Business SIC classification: TERMINAL AND JOINT TERMINAL MAINTENANCE FACILITIES FOR MOTOR FREIGHT TRANSPORTATION Organizations: ONE COMMERCE DRIVE PROPERTIES INC (CONTACT/OWNER)
, HAZMAT ENVIRONMENTAL GROUP INC (LEGALLY RESPONSIBLE PARTY)
GREAT LAKES MDF (300 COMMERCE DR in LACKAWANNA, NY)
AIR MAJOR (AIRS/AFS) AIR SYNTHETIC MINOR (AIRS/AFS) STATE MASTER (New York facility tracking) - AIR PROGRAM, National Pollutant Discharge Elimination System Permit, AIR MAJOR Business SIC classification: RECONSTITUTED WOOD PRODUCTS Business NAICS classification: RECONSTITUTED WOOD PRODUCT MANUFACTURING. Organizations: CAN FIBRE OF LACKAWANNA LLC (LEGALLY RESPONSIBLE PARTY)
, GREAT LAKES MDF LLC (LEGALLY RESPONSIBLE PARTY)
Alternative names: CANFIBRE OF LACKAWANNA LLC
GLOBAL CONCEPTS CHARTER SCHOOL ( in LACKAWANNA, NY)
(National Center for Education Statistics) - STATE ID-141800860044
HOLY CROSS CEMETERY (2900 S PARK AVE in LACKAWANNA, NY)
(Resource Conservation and Recovery Act (tracking hazardous waste))
CUMBERLAND FARMS #3255 (2052-2080 ABBOTT RD & GRANT in LACKAWANNA, NY)
(Resource Conservation and Recovery Act (tracking hazardous waste))
2955 S PARK VACANT BLDG - B HOLYNSKI (2955 S PARK AVE in LACKAWANNA, NY)
Small Quantity Generators, between 100 kg and 1000 kg of hazardous waste/month (Resource Conservation and Recovery Act (tracking hazardous waste)) - notification Organizations: BARBARA HOLYNSKI (CONTACT/OWNER)
CONCRETE DELIVERY CO INC (7 N STEELAWANNA AVE in BUFFALO, NY)
Conditionally Exempt Small Quantity Generators, less than 100 kg/month of hazardous waste (Resource Conservation and Recovery Act (tracking hazardous waste)) - notification
Housing units lacking complete plumbing facilities: 1.8% Housing units lacking complete kitchen facilities: 2.7%
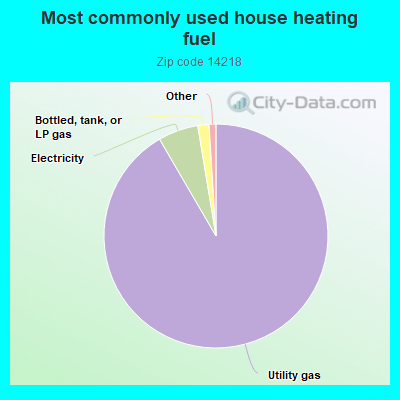
91.7%Utility gas
5.8%Electricity
1.6%Bottled, tank, or LP gas
Population in 1990: 22,309.
Place of birth for U.S.-born residents:
This state: 16,614
Northeast: 378
Midwest: 526
South: 390
West: 244
65% of the 14218 zip code residents lived in the same house 5 years ago. Out of people who lived in different houses, 90% lived in this county. Out of people who lived in different counties, 50% lived in New York.
92% of the 14218 zip code residents lived in the same house 1 year ago. Out of people who lived in different houses, 78% moved from this county. Out of people who lived in different houses, 4% moved from different county within same state. Out of people who lived in different houses, 15% moved from different state. Out of people who lived in different houses, 1% moved from abroad.
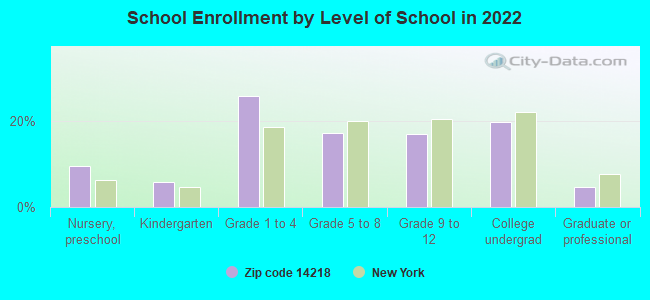
Private vs. public school enrollment:
Students in private schools in grades 1 to 8 (elementary and middle school): 167
Here:
9.9%
New York:
15.6%
Students in private schools in grades 9 to 12 (high school): 24
Here:
3.7%
New York:
15.0%
Students in private undergraduate colleges: 304
Here:
39.1%
New York:
39.2%
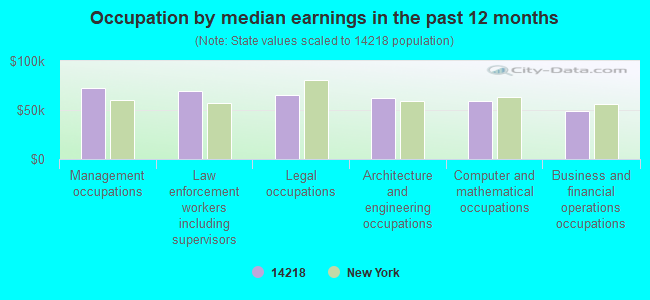
Occupation by median earnings in the past 12 months ($)
72,779Management occupations
68,987Law enforcement workers including supervisors
64,993Legal occupations
62,663Architecture and engineering occupations
59,110Computer and mathematical occupations
49,063Business and financial operations occupations
Companies with federal contracts located in this zip code:
AMW DESIGN (33 COLTON AVE in LACKAWANNA, NY; small business) : -$68 in 2 contractsin 2005
$0 with Army for Other Professional Services. Signed on 2005-11-29. Completion date: 2005-12-31.
-$68, same as above.Signed on 2005-11-29. Completion date: 2005-12-31.
Top industries in this zip code by the number of employees in 2005:
Health Care and Social Assistance: Other Residential Care Facilities (500-999 employees: 1 establishment, 10-19 employees: 1 establishment)
2002 - 2018 National Fire Incident Reporting System (NFIRS) incidents
According to the data from the years 2002 - 2018 the average number of fires per year is 93. The highest number of reported fire incidents - 151 took place in 2002, and the least - 45 in 2015. The data has a dropping trend.
When looking into fire subcategories, the most incidents belonged to: Structure Fires (42.5%), and Outside Fires (37.5%).
Fire incident types reported to NFIRS in Zip Code 14218


 Nearest zip codes: 14220, 14219, 14210, 14203, 14206, 14204.


 According to the data from the years 2002 - 2018 the average number of fires per year is 93. The highest number of reported fire incidents - 151 took place in 2002, and the least - 45 in 2015. The data has a dropping trend.
 When looking into fire subcategories, the most incidents belonged to: Structure Fires (42.5%), and Outside Fires (37.5%).