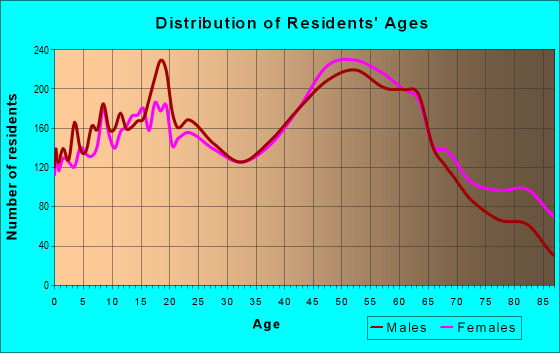
Estimated zip code population in 2022: 28,128 Zip code population in 2010: 27,007 Zip code population in 2000: 24,878
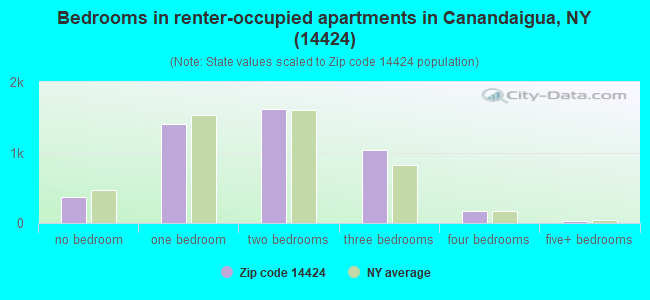
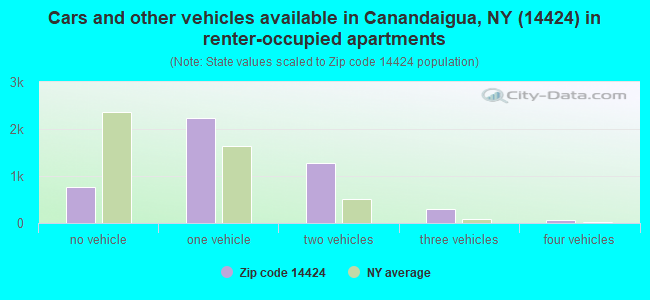
Houses and condos: 14,602 Renter-occupied apartments: 4,632
% of renters here:
36%
State:
46%
March 2022 cost of living index in zip code 14424: 103.4 (near average, U.S. average is 100)
Land area: 127.2 sq. mi. Water area: 0.2 sq. mi.
Population density: 221 people per square mile
(very low).
OSM Map
General Map
Google Map
MSN Map
OSM Map
General Map
Google Map
MSN Map
OSM Map
General Map
Google Map
MSN Map
OSM Map
General Map
Google Map
MSN Map
Please wait while loading the map...
Real estate property taxes paid for housing units in 2022:
This zip code:
2.0% ($5,023)
New York:
1.5% ($6,180)
Median real estate property taxes paid for housing units with mortgages in 2022: $5,062 (2.0%) Median real estate property taxes paid for housing units with no mortgage in 2022: $4,976 (2.0%)
Averages for the 2020 tax year for zip code 14424, filed in 2021:
Average Adjusted Gross Income (AGI) in 2020: $76,775 (Individual Income Tax Returns)
Here:
$76,775
State:
$90,930
Salary/wage: $58,425 (reported on 77.7% of returns)
Here:
$58,425
State:
$72,104
(% of AGI for various income ranges: 1124.9% for AGIs below $25k, 3404.9% for AGIs $25k-50k, 5763.7% for AGIs $50k-75k, 8210.7% for AGIs $75k-100k, 15773.9% for AGIs $100k-200k, 69390.9% for AGIs over 200k)
Taxable interest for individuals: $1,244 (reported on 47.4% of returns)
This zip code:
$1,244
New York:
$3,075
(% of AGI for various income ranges: 19.4% for AGIs below $25k, 24.5% for AGIs $25k-50k, 56.4% for AGIs $50k-75k, 103.4% for AGIs $75k-100k, 157.8% for AGIs $100k-200k, 1477.0% for AGIs over 200k)
Ordinary dividends: $8,854 (reported on 26.4% of returns)
Here:
$8,854
State:
$11,095
(% of AGI for various income ranges: 42.1% for AGIs below $25k, 66.0% for AGIs $25k-50k, 150.1% for AGIs $50k-75k, 280.6% for AGIs $75k-100k, 489.7% for AGIs $100k-200k, 8462.2% for AGIs over 200k)
Net capital gain/loss in AGI: +$15,446 (reported on 21.7% of returns)
Here:
+$15,446
State:
+$44,925
(% of AGI for various income ranges: 28.6% for AGIs below $25k, 48.1% for AGIs $25k-50k, 146.3% for AGIs $50k-75k, 277.0% for AGIs $75k-100k, 784.3% for AGIs $100k-200k, 13655.2% for AGIs over 200k)
Profit/loss from business: +$16,529 (reported on 12.7% of returns)
Here:
+$16,529
State:
+$14,940
(% of AGI for various income ranges: 61.7% for AGIs below $25k, 97.3% for AGIs $25k-50k, 202.7% for AGIs $50k-75k, 312.7% for AGIs $75k-100k, 629.3% for AGIs $100k-200k, 5097.8% for AGIs over 200k)
Taxable individual retirement arrangement distribution: $21,210 (reported on 14.6% of returns)
14424:
$21,210
New York:
$19,609
(% of AGI for various income ranges: 88.6% for AGIs below $25k, 155.3% for AGIs $25k-50k, 398.5% for AGIs $50k-75k, 700.2% for AGIs $75k-100k, 1227.6% for AGIs $100k-200k, 4017.0% for AGIs over 200k)
Self-employed (Keogh) retirement plans: $22,675 (reported on 0.8% of returns)
14424:
$22,675
New York:
$32,497
(% of AGI for various income ranges: 6.5% for AGIs $25k-50k, 55.1% for AGIs $100k-200k, 783.9% for AGIs over 200k)
Total itemized deductions: $31,531 (reported on 7.2% of returns)
Here:
$31,531
State:
$39,326
(% of AGI for various income ranges: 49.5% for AGIs below $25k, 80.0% for AGIs $25k-50k, 264.9% for AGIs $50k-75k, 415.3% for AGIs $75k-100k, 661.0% for AGIs $100k-200k, 5570.0% for AGIs over 200k)
Charity contributions: $11,995 (reported on 5.8% of returns)
Here:
$11,995
State:
$15,420
(% of AGI for various income ranges: 3.0% for AGIs below $25k, 11.9% for AGIs $25k-50k, 31.3% for AGIs $50k-75k, 57.0% for AGIs $75k-100k, 179.4% for AGIs $100k-200k, 2725.7% for AGIs over 200k)
Taxes paid: $8,609 (reported on 7.2% of returns)
14424:
$8,609
State:
$9,183
(% of AGI for various income ranges: 11.9% for AGIs below $25k, 23.6% for AGIs $25k-50k, 82.9% for AGIs $50k-75k, 150.8% for AGIs $75k-100k, 215.8% for AGIs $100k-200k, 1062.6% for AGIs over 200k)
Earned income credit: $1,891 (reported on 10.7% of returns)
Here:
$1,891
State:
$2,138
(% of AGI for various income ranges: 53.4% for AGIs below $25k, 47.7% for AGIs $25k-50k)
Percentage of individuals using paid preparers for their 2020 taxes: 95.6%
Here:
96%
State:
95%
(% for various income ranges: 95.0% for AGIs below $25k, 95.5% for AGIs $25k-50k, 94.5% for AGIs $50k-75k, 95.7% for AGIs $75k-100k, 96.7% for AGIs $100k-200k, 98.6% for AGIs over 200k)
Averages for the 2012 tax year for zip code 14424, filed in 2013:
Average Adjusted Gross Income (AGI) in 2012: $60,024 (Individual Income Tax Returns)
Here:
$60,024
State:
$77,088
Salary/wage: $48,464 (reported on 81.3% of returns)
Here:
$48,464
State:
$60,593
(% of AGI for various income ranges: 73.4% for AGIs below $25k, 74.1% for AGIs $25k-50k, 68.1% for AGIs $50k-75k, 68.4% for AGIs $75k-100k, 68.4% for AGIs $100k-200k, 51.8% for AGIs over 200k)
Taxable interest for individuals: $1,124 (reported on 47.5% of returns)
This zip code:
$1,124
New York:
$3,125
(% of AGI for various income ranges: 1.2% for AGIs below $25k, 0.9% for AGIs $25k-50k, 0.8% for AGIs $50k-75k, 0.7% for AGIs $75k-100k, 0.8% for AGIs $100k-200k, 1.1% for AGIs over 200k)
Ordinary dividends: $5,935 (reported on 26.2% of returns)
Here:
$5,935
State:
$10,299
(% of AGI for various income ranges: 1.7% for AGIs below $25k, 1.5% for AGIs $25k-50k, 1.8% for AGIs $50k-75k, 1.9% for AGIs $75k-100k, 2.0% for AGIs $100k-200k, 5.1% for AGIs over 200k)
Net capital gain/loss in AGI: +$12,845 (reported on 20.1% of returns)
Here:
+$12,845
State:
+$42,474
(% of AGI for various income ranges: 0.6% for AGIs $25k-50k, 0.9% for AGIs $50k-75k, 1.9% for AGIs $75k-100k, 2.8% for AGIs $100k-200k, 13.2% for AGIs over 200k)
Profit/loss from business: +$16,007 (reported on 13.5% of returns)
Here:
+$16,007
State:
+$16,168
(% of AGI for various income ranges: 5.5% for AGIs below $25k, 3.6% for AGIs $25k-50k, 2.6% for AGIs $50k-75k, 2.0% for AGIs $75k-100k, 2.9% for AGIs $100k-200k, 5.3% for AGIs over 200k)
Taxable individual retirement arrangement distribution: $16,127 (reported on 14.0% of returns)
14424:
$16,127
New York:
$17,621
(% of AGI for various income ranges: 4.3% for AGIs below $25k, 3.8% for AGIs $25k-50k, 4.5% for AGIs $50k-75k, 4.8% for AGIs $75k-100k, 3.9% for AGIs $100k-200k, 2.4% for AGIs over 200k)
Self-employment retirement plans: $16,977 (reported on 1.0% of returns)
14424:
$16,977
New York:
$27,330
(% of AGI for various income ranges: 0.3% for AGIs $50k-75k, 0.2% for AGIs $100k-200k, 0.8% for AGIs over 200k)
Total itemized deductions: $23,898 (21% of AGI, reported on 34.6% of returns)
Here:
$23,898
State:
$34,985
Here:
20.5% of AGI
State:
21.3% of AGI
(% of AGI for various income ranges: 7.6% for AGIs below $25k, 9.5% for AGIs $25k-50k, 12.5% for AGIs $50k-75k, 14.7% for AGIs $75k-100k, 16.6% for AGIs $100k-200k, 15.1% for AGIs over 200k)
Charity contributions: $3,489 (reported on 29.2% of returns)
Here:
$3,489
State:
$5,572
(% of AGI for various income ranges: 0.5% for AGIs below $25k, 0.9% for AGIs $25k-50k, 1.4% for AGIs $50k-75k, 1.7% for AGIs $75k-100k, 2.0% for AGIs $100k-200k, 2.5% for AGIs over 200k)
Taxes paid: $12,183 (reported on 34.5% of returns)
14424:
$12,183
State:
$18,656
(% of AGI for various income ranges: 2.5% for AGIs below $25k, 3.6% for AGIs $25k-50k, 5.3% for AGIs $50k-75k, 7.0% for AGIs $75k-100k, 8.7% for AGIs $100k-200k, 9.6% for AGIs over 200k)
Earned income credit: $1,934 (reported on 13.5% of returns)
Here:
$1,934
State:
$2,230
(% of AGI for various income ranges: 4.4% for AGIs below $25k, 0.8% for AGIs $25k-50k)
Percentage of individuals using paid preparers for their 2012 taxes: 55.4%
Here:
55%
State:
66%
(% for various income ranges: 48.0% for AGIs below $25k, 52.6% for AGIs $25k-50k, 59.4% for AGIs $50k-75k, 63.2% for AGIs $75k-100k, 64.8% for AGIs $100k-200k, 84.1% for AGIs over 200k)
Averages for the 2004 tax year for zip code 14424, filed in 2005:
Average Adjusted Gross Income (AGI) in 2004: $47,217 (Individual Income Tax Returns)
Here:
$47,217
State:
$59,519
Salary/wage: $40,640 (reported on 82.6% of returns)
Here:
$40,640
State:
$50,673
(% of AGI for various income ranges: 112.8% for AGIs below $10k, 72.7% for AGIs $10k-25k, 75.4% for AGIs $25k-50k, 74.7% for AGIs $50k-75k, 75.7% for AGIs $75k-100k, 63.0% for AGIs over 100k)
Taxable interest for individuals: $1,513 (reported on 54.5% of returns)
This zip code:
$1,513
New York:
$2,377
(% of AGI for various income ranges: 5.8% for AGIs below $10k, 2.5% for AGIs $10k-25k, 1.6% for AGIs $25k-50k, 1.4% for AGIs $50k-75k, 1.2% for AGIs $75k-100k, 1.9% for AGIs over 100k)
Taxable dividends: $3,386 (reported on 30.8% of returns)
Here:
$3,386
State:
$5,394
(% of AGI for various income ranges: 6.7% for AGIs below $10k, 1.9% for AGIs $10k-25k, 1.7% for AGIs $25k-50k, 1.3% for AGIs $50k-75k, 1.4% for AGIs $75k-100k, 3.1% for AGIs over 100k)
Net capital gain/loss: +$8,637 (reported on 23.9% of returns)
Here:
+$8,637
State:
+$23,581
(% of AGI for various income ranges: -3.8% for AGIs below $10k, 0.7% for AGIs $10k-25k, 0.7% for AGIs $25k-50k, 1.2% for AGIs $50k-75k, 1.8% for AGIs $75k-100k, 10.0% for AGIs over 100k)
Profit/loss from business: +$13,621 (reported on 14.3% of returns)
Here:
+$13,621
State:
+$13,809
(% of AGI for various income ranges: 7.0% for AGIs below $10k, 4.4% for AGIs $10k-25k, 3.0% for AGIs $25k-50k, 2.8% for AGIs $50k-75k, 3.0% for AGIs $75k-100k, 5.6% for AGIs over 100k)
Profit/loss from farming: +$214 (reported on 1.1% of returns)
Here:
+$214
State:
-$2,666
(% of AGI for various income ranges: -1.5% for AGIs below $10k, 0.1% for AGIs $10k-25k, -0.1% for AGIs $25k-50k, 0.1% for AGIs $50k-75k, 0.0% for AGIs $75k-100k, 0.0% for AGIs over 100k)
IRA payment deduction: $2,878 (reported on 2.9% of returns)
14424:
$2,878
New York:
$3,115
(% of AGI for various income ranges: 0.3% for AGIs below $10k, 0.3% for AGIs $10k-25k, 0.3% for AGIs $25k-50k, 0.2% for AGIs $50k-75k, 0.2% for AGIs $75k-100k, 0.1% for AGIs over 100k)
Self-employed pension: $12,876 (reported on 1.3% of returns)
Here:
$12,876
New York:
$19,016
(% of AGI for various income ranges: 0.1% for AGIs $25k-50k, 0.1% for AGIs $50k-75k, 0.2% for AGIs $75k-100k, 0.7% for AGIs over 100k)
Total itemized deductions: $19,159 (21% of AGI, reported on 35.8% of returns)
Here:
$19,159
State:
$25,864
Here:
21.4% of AGI
State:
21.9% of AGI
(% of AGI for various income ranges: 15.5% for AGIs below $10k, 8.8% for AGIs $10k-25k, 10.7% for AGIs $25k-50k, 14.6% for AGIs $50k-75k, 17.0% for AGIs $75k-100k, 16.5% for AGIs over 100k)
Charity contributions deductions: $3,177 (3% of AGI, reported on 32.3% of returns)
Here:
$3,177
State:
$4,439
Here:
3.4% of AGI
State:
3.6% of AGI
(% of AGI for various income ranges: 0.9% for AGIs below $10k, 0.9% for AGIs $10k-25k, 1.2% for AGIs $25k-50k, 1.8% for AGIs $50k-75k, 2.3% for AGIs $75k-100k, 3.1% for AGIs over 100k)
Total tax: $7,170 (reported on 76.6% of returns)
14424:
$7,170
State:
$11,730
(% of AGI for various income ranges: 3.1% for AGIs below $10k, 4.5% for AGIs $10k-25k, 7.1% for AGIs $25k-50k, 9.0% for AGIs $50k-75k, 10.2% for AGIs $75k-100k, 17.7% for AGIs over 100k)
Earned income credit: $1,474 (reported on 11.3% of returns)
Here:
$1,474
State:
$1,757
Percentage of individuals using paid preparers for their 2004 taxes: 57.0%
Here:
57%
State:
67%
(% for various income ranges: 46.3% for AGIs below $10k, 55.2% for AGIs $10k-25k, 58.6% for AGIs $25k-50k, 61.9% for AGIs $50k-75k, 63.6% for AGIs $75k-100k, 68.6% for AGIs over 100k)
Likely homosexual households (counted as self-reported same-sex unmarried-partner households)
Lesbian couples: 0.1% of all households
Gay men: 0.0% of all households
Household received Food Stamps/SNAP in the past 12 months: 1,206 Household did not receive Food Stamps/SNAP in the past 12 months: 11,697
Women who had a birth in the past 12 months: 242 (171 now married, 70 unmarried) Women who did not have a birth in the past 12 months: 5,555 (2,511 now married, 3,020 unmarried)
Housing units in zip code 14424 with a mortgage: 5,075 (854 second mortgage, 53 home equity loan, 798 both second mortgage and home equity loan) Houses without a mortgage: 237
Median monthly owner costs for units with a mortgage: $1,674 Median monthly owner costs for units without a mortgage: $732
Residents with income below the poverty level in 2022:
This zip code:
7.9%
Whole state:
14.3%
Residents with income below 50% of the poverty level in 2022:
This zip code:
3.5%
Whole state:
6.8%
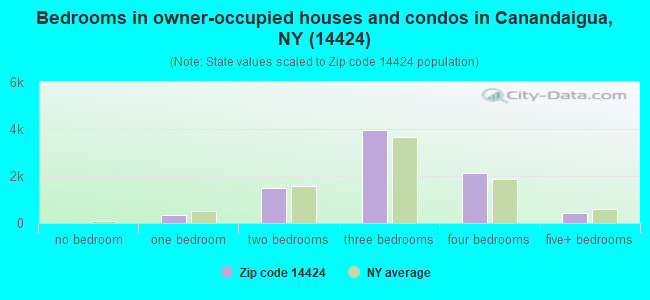
Median number of rooms in houses and condos:
Here:
6.7
State:
6.3
Median number of rooms in apartments:
Here:
4.1
State:
3.8
Notable locations in this zip code not listed on our city pages
Notable locations in zip code 14424: Teloga Valley Farm (A), Willow Pond Aqua Farm (B), Hilton Farms (C), Four Winds Corners (D), Mayflower's Nursery And Garden Center (E), Center Pointe Golf and Country Club (F), Canandaigua Country Club (G), Fletcher Corners (H), McMiller Corners (I), Bristol Woodlands Campground (J), Canandaigua City Hall (K), Ontario County Court House (L), Hallenbeck Building (M), Clark Manor House Adult Care Facility (N), Clark Meadows at Ferris Hills Adult Care Facility (O), Elijah House Adult Care Facility (P), Elm Manor Nursing Home (Q), Horizons Assisted Living Center (R), Quail Summit Adult Care Facility (S), Wood Library (T). Display/hide their locations on the map
Churches in zip code 14424 include: Bristol Valley Church (A), Calvary Assembly of God (B), Canandaigua Baptist Church (C), Cheshire Community Church (D), Crosswinds Wesleyan Church (E), First Church of Christ Scientist (F), Good Shepherd Lutheran Church (G), Grace Bible Baptist Church (H), The Church of Jesus Christ of Latter Day Saints (I). Display/hide their locations on the map
Cemeteries: Sand Hill Cemetery (1), Pioneer Cemetery (2), Moore Cemetery (3), West Avenue Cemetery (4), South Bloomfield Cemetery (5), Bristol Center Cemetery (6), Reed's Corners Cemetery (7). Display/hide their locations on the map
In group quarters: 1,009 (-1 institutionalized population)
Size of family households: 3,728 2-persons, 1,764 3-persons, 1,404 4-persons, 387 5-persons, 115 6-persons, 92 7-or-more-persons
Size of nonfamily households: 4,288 1-person, 1,100 2-persons, 182 3-persons
3,179 married couples with children.
1,319 single-parent households (429 men, 890 women).
94.0% of residents of 14424 zip code speak English at home.
2.7% of residents speak Spanish at home (67% very well, 14% well, 14% not well, 5% not at all).
2.5% of residents speak other Indo-European language at home (55% very well, 34% well, 9% not well, 1% not at all).
0.4% of residents speak Asian or Pacific Island language at home (21% very well, 79% well).
0.7% of residents speak other language at home (39% very well, 22% well, 39% not well).
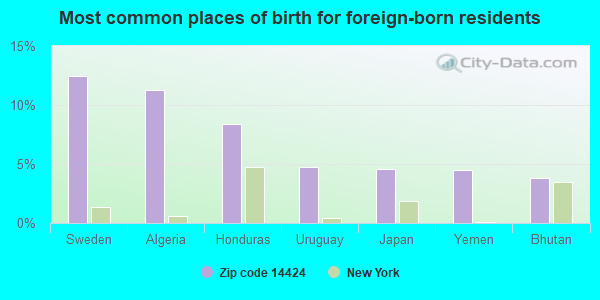
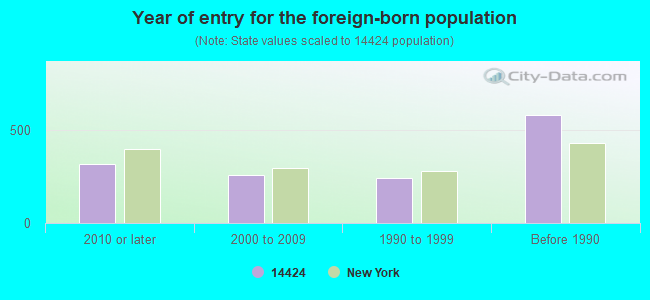
Foreign born population: 1,071 (3.8%) (67.0% of them are naturalized citizens)
Facilities with environmental interests located in this zip code:
HONEOYE STORAGE CORP (4511 EGYPT ROAD in CANANDAIGUA, NY)
AIR SYNTHETIC MINOR (AIRS/AFS) STATE MASTER (New York facility tracking) - AIR PROGRAM, HAZARDOUS WASTE BIENNIAL REPORTER (Resource Conservation and Recovery Act (tracking hazardous waste)) Large Quantity Generators, more that 1000 kg of hazardous waste/month (Resource Conservation and Recovery Act (tracking hazardous waste)) - notification Business SIC classification: NATURAL GAS TRANSMISSION Business NAICS classification: PIPELINE TRANSPORTATION OF NATURAL GAS.
HILTON FARMS (3188 CO RD 47 in CANANDAIGUA, NY)
STATE MASTER (New York facility tracking) - 401 CERTIFICATION, National Pollutant Discharge Elimination System Permit National Pollutant Discharge Elimination System NON-MAJOR (Tracking pollutant discharge elimination systems) - permit Business SIC classification: GENERAL FARMS, PRIMARILY LIVESTOCK AND ANIMAL SPECIALTIES Organizations: RICHARD N. HILTON (CONTACT/OWNER)
, ONTARIO CO SOIL & WATER CONSERVATION DIS (FACILITY APPLICATION CONTACT)
Alternative names: 1, RICHARD N. HILTON
AIR MINOR (AIRS/AFS) STATE MASTER (New York facility tracking) - AIR PROGRAM, HAZARDOUS WASTE PROGRAM TRI REPORTER (Tracking of toxic chemicals releasing facilities) Business SIC classification: COMPUTER PERIPHERAL EQUIPMENT; OFFICE MACHINES; PHOTOGRAPHIC EQUIPMENT AND SUPPLIES Organizations: XEROX CORP (LEGALLY RESPONSIBLE PARTY)
Alternative names: XEROX CORP.
COPCO (2495 BRICKYARD RD BOX 450 in CANANDAIGUA, NY)
STATE MASTER (New York facility tracking) - National Pollutant Discharge Elimination System Permit, Small Quantity Generators, between 100 kg and 1000 kg of hazardous waste/month (Resource Conservation and Recovery Act (tracking hazardous waste)) Business SIC classification: SERVICES Organizations: COPCO PUBLISHERS INC (LEGALLY RESPONSIBLE PARTY)
Alternative names: COPCO PUBLISHERS INC
INFOTONICS TECHNOLOGY CENTER INC (5450 CAMPUS DR in CANANDAIGUA, NY)
HAZARDOUS WASTE BIENNIAL REPORTER (Resource Conservation and Recovery Act (tracking hazardous waste)) Large Quantity Generators, more that 1000 kg of hazardous waste/month (Resource Conservation and Recovery Act (tracking hazardous waste)) - notification Organizations: ONTARIO COUNTY ECONMIC DEVELOPMENT (CONTACT/OWNER)
Alternative names: XEROX CORP
A G ENV TECH & SVCS INC (2369 ROCHESTER ROAD SITE 2 in CANANDAIGUA, NY)
(Resource Conservation and Recovery Act (tracking hazardous waste)) TRANSPORTER (Resource Conservation and Recovery Act (tracking hazardous waste)) Organizations: CHARLES ASKINS ANTONIO GOLINO (CONTACT/OWNER)
HEYS ENTERPRISES INC SHOP 1 (4608 COUNTY RD 1 in CANANDAIGUA, NY)
(Resource Conservation and Recovery Act (tracking hazardous waste)) Organizations: DOUGLAS C HEY (CONTACT/OPERATOR)
HERRS MOTOR EXPRESS INC (RD 2 4353 RTE 21 N in CANANDAIGUA, NY)
(Resource Conservation and Recovery Act (tracking hazardous waste))
ALLAN K BOYCE & SONS INC (51 LEICESTER ST in CANANDAIGUA, NY)
Conditionally Exempt Small Quantity Generators, less than 100 kg/month of hazardous waste (Resource Conservation and Recovery Act (tracking hazardous waste)) - notification
GOODYEAR AUTO SERVICE CENTER (2375-79 ROCHESTER RD in CANANDAIGUA, NY)
Conditionally Exempt Small Quantity Generators, less than 100 kg/month of hazardous waste (Resource Conservation and Recovery Act (tracking hazardous waste)) - notification Organizations: THE GOODYEAR TIRE & RUBBER CO (CONTACT/OWNER)
COMMUNITY COLLEGE OF THE FINGER LAKES (LINCOLN HILL CAMPUS in CANANDAIGUA, NY)
Small Quantity Generators, between 100 kg and 1000 kg of hazardous waste/month (Resource Conservation and Recovery Act (tracking hazardous waste)) - notification Organizations: ONTAIRO COUNTY (CONTACT/OWNER)
AMERADA HESS STATION 32451 (162 LAKE SHORE RD in CANANDAIGUA, NY)
Conditionally Exempt Small Quantity Generators, less than 100 kg/month of hazardous waste (Resource Conservation and Recovery Act (tracking hazardous waste))
CITY MINI STORAGE (493 SOUTH MAIN STREET in CANANDAIGUA, NY)
SUPERFUND (Superfund database)
Housing units lacking complete plumbing facilities: 1.6% Housing units lacking complete kitchen facilities: 2.5%
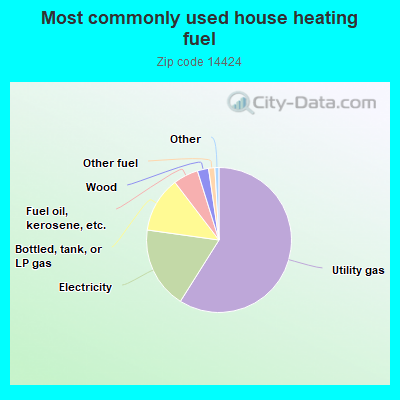
59.0%Utility gas
18.3%Electricity
12.4%Bottled, tank, or LP gas
5.6%Fuel oil, kerosene, etc.
2.5%Wood
1.4%Other fuel
Population in 1990: 20,748. Population change in the 1990s: +4,130 (+19.9%).
Place of birth for U.S.-born residents:
This state: 21,960
Northeast: 1,845
Midwest: 1,092
South: 1,023
West: 766
54% of the 14424 zip code residents lived in the same house 5 years ago. Out of people who lived in different houses, 62% lived in this county. Out of people who lived in different counties, 50% lived in New York.
88% of the 14424 zip code residents lived in the same house 1 year ago. Out of people who lived in different houses, 50% moved from this county. Out of people who lived in different houses, 33% moved from different county within same state. Out of people who lived in different houses, 18% moved from different state.
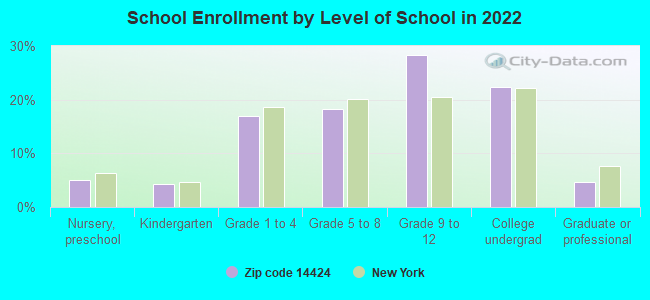
Private vs. public school enrollment:
Students in private schools in grades 1 to 8 (elementary and middle school): 149
Here:
7.9%
New York:
15.6%
Students in private schools in grades 9 to 12 (high school): 39
Here:
2.6%
New York:
15.0%
Students in private undergraduate colleges: 235
Here:
20.0%
New York:
39.2%
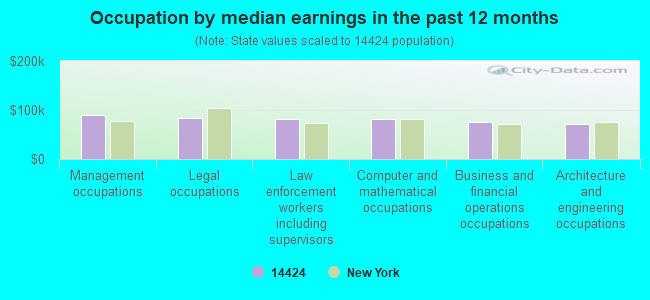
Occupation by median earnings in the past 12 months ($)
89,492Management occupations
83,456Legal occupations
82,395Law enforcement workers including supervisors
80,875Computer and mathematical occupations
74,849Business and financial operations occupations
71,489Architecture and engineering occupations
Companies with federal contracts located in this zip code (CANANDAIGUA, NY):
CORSAIR DISPLAY SYSTEMS, INC (2491 BRICKYARD ROAD; small business) : $111,324 in 3 contractsfrom 2000 to 2001
$43,254 with Army for Miscellaneous Furniture and Fixtures. Signed on 2000-07-12. Completion date: 2000-07-19.
$35,797, same as above.Signed on 2000-08-08. Completion date: 2000-10-02.
$32,273 with Army for Kitchen Equipment and Appliances. Signed on 2001-12-13. Completion date: 2002-01-11.
CONWAY GAGE SERVICE INC (2635 COUNTY ROAD 22; small business) : $109,786 in 7 contractsfrom 2002 to 2005
Contracts for ADP Software, Miscellaneous Machine Tools, Maintenance, Repair and Rebuilding of Equipment -- Metalworking Machinery, Electrical Hardware and Supplies, and moreby Army Signed by year:2000: $0; 2001: $0; 2002: $29,401; 2003: $73,709; 2004: $3,676; 2005: $3,000; 2006: $0.
Biggest contracts:
$74,100 with Army for ADP Software. Signed on 2003-08-04. Completion date: 2003-09-15.
$29,401 with Army for Miscellaneous Machine Tools. Signed on 2002-08-20. Completion date: 2002-10-10.
$4,100 with Army for Maintenance, Repair and Rebuilding of Equipment -- Metalworking Machinery. Signed on 2004-01-23. Completion date: 2004-01-23.
$3,000 with Army for Electrical Hardware and Supplies. Signed on 2005-08-10. Completion date: 2005-08-09.
TENSAR INC (4277 HOPEWELL CENTER RD; small business) : $100,129 in 8 contractsfrom 2002 to 2006
Contracts for ADPE System Configuration, Other ADP and Telecommunications Services (includes data storage on tapes, compact disks, etc.), Technical Representation Services -- Materials Handling Equipment, Programming Services by Army Signed by year:2000: $0; 2001: $0; 2002: $22,500; 2003: $23,800; 2004: $21,000; 2005: $33,500; 2006: -$671.
Biggest contracts:
$22,500 with Army for ADPE System Configuration. Taking place in IL. Signed on 2002-12-13. Completion date: 2003-01-24.
$21,000 with Army for Other ADP and Telecommunications Services (includes data storage on tapes, compact disks, etc.). Signed on 2005-09-16. Completion date: 2006-09-30.
$21,000 with Army for Technical Representation Services -- Materials Handling Equipment. Signed on 2004-08-31. Completion date: 2005-09-30.
$21,000 with Army for Other ADP and Telecommunications Services (includes data storage on tapes, compact disks, etc.). Signed on 2003-09-11. Completion date: 2004-09-30.
ONTARIO COUNTY CHAPTER NYSARC, (3071 COUNTY COMPLEX DR) : $79,955 in 22 contractsfrom 2003 to 2006
Contracts for Custodial Janitorial Services, Snow Removal/Salt Service (also spreading aggregate or other snow melting material), Trash/Garbage Collection Services - Including Portable Sanitation Services by Army Signed by year:2000: $0; 2001: $0; 2002: $0; 2003: $18,038; 2004: $32,906; 2005: $27,298; 2006: $1,713.
Biggest contracts:
$15,215 with Army for Custodial Janitorial Services. Signed on 2005-08-26. Completion date: 2004-08-31.
$14,631, same as above.Signed on 2004-07-22. Completion date: 2004-08-31.
$14,623, same as above.Signed on 2003-09-26. Completion date: 2004-08-31.
$7,666 with Army for Snow Removal/Salt Service (also spreading aggregate or other snow melting material). Signed on 2005-04-18. Completion date: 2003-12-31.
ONTARIO JANITORIAL SALES & SER (2400 ROUTE 332; small business) : $56,360 in 7 contractsfrom 2001 to 2005
Contracts for Custodial Janitorial Services by Army Signed by year:2000: $0; 2001: $12,612; 2002: $5,082; 2003: $13,658; 2004: $12,324; 2005: $12,684; 2006: $0.
Biggest contracts:
$12,684 with Army for Custodial Janitorial Services. Signed on 2005-03-31. Completion date: 2006-04-30.
$12,612, same as above.Signed on 2001-10-01. Completion date: 2002-09-30.
$12,324, same as above.Signed on 2004-05-01. Completion date: 2005-04-30.
$11,964, same as above.Signed on 2003-04-30. Completion date: 2004-04-30.
$12,875 with Army for Food Services. Signed on 2003-03-15. Completion date: 2003-03-21.
$1,650, same as above.Signed on 2003-04-11. Completion date: 2003-03-21.
TECH RESCUE CORP (4555 W LAKE RD; small business)
$3,516 with Army for Other Education and Training Services. Signed on 2004-07-23. Completion date: 2004-05-28.
AIRSUPPORT LLC (4490 W LAKE RD; small business)
$3,000 with Air Force for Other Social Services. Taking place in TX. Signed on 2005-10-28. Completion date: 2005-11-06.
Top industries in this zip code by the number of employees in 2005:
Health Care and Social Assistance: General Medical and Surgical Hospitals (over 1000 employees: 1 establishment)
Health Care and Social Assistance: Psychiatric and Substance Abuse Hospitals (500-999: 1)
Professional, Scientific, and Technical Services: Research and Development in the Social Sciences and Humanities (500-999: 1)
Administrative and Support and Waste Management and Remediation Services: Temporary Help Services (100-249: 2, 50-99: 3, 20-49: 1, 1-4: 1)
2002 - 2018 National Fire Incident Reporting System (NFIRS) incidents
According to the data from the years 2002 - 2018 the average number of fire incidents per year is 144. The highest number of reported fires - 204 took place in 2007, and the least - 90 in 2015. The data has a declining trend.
When looking into fire subcategories, the most reports belonged to: Structure Fires (54.5%), and Outside Fires (29.6%).
Fire incident types reported to NFIRS in Zip Code 14424


+$214
-$2,666
(% of AGI for various income ranges: -1.5% for AGIs below $10k, 0.1% for AGIs $10k-25k, -0.1% for AGIs $25k-50k, 0.1% for AGIs $50k-75k, 0.0% for AGIs $75k-100k, 0.0% for AGIs over 100k) Nearest zip codes: 14544, 14504, 14548, 14425, 14469, 14561.


 According to the data from the years 2002 - 2018 the average number of fire incidents per year is 144. The highest number of reported fires - 204 took place in 2007, and the least - 90 in 2015. The data has a declining trend.
 When looking into fire subcategories, the most reports belonged to: Structure Fires (54.5%), and Outside Fires (29.6%).