Estimated zip code population in 2022: 3,977
Zip code population in 2010: 4,249
Zip code population in 2000: 4,149
Houses and condos: 1,822
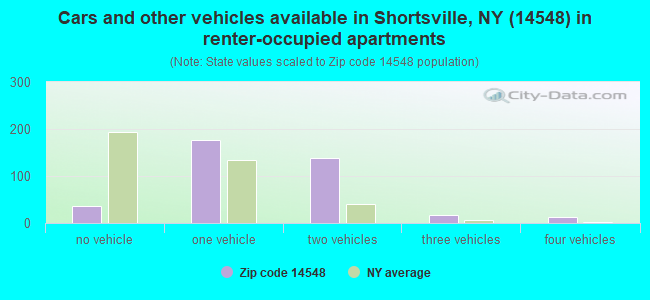
Renter-occupied apartments: 379
% of renters here:
22%State:
46%
March 2022 cost of living index in zip code 14548: 93.9
(less than average, U.S. average is 100)
Land area: 30.1
sq. mi.
Water area: 0.0
sq. mi.
Population density: 132 people per square mile (very low).
OSM Map
General Map
Google Map
MSN Map
OSM Map
General Map
Google Map
MSN Map
OSM Map
General Map
Google Map
MSN Map
OSM Map
General Map
Google Map
MSN Map
Please wait while loading the map...
Real estate property taxes paid for housing units in 2022:
This zip code:
2.8% ($3,955)New York:
1.5% ($6,180)
Median real estate property taxes paid for housing units with mortgages in 2022: $4,116 (2.6%)
Median real estate property taxes paid for housing units with no mortgage in 2022: $3,330 (2.9%)
Business Search - 14 Million verified businesses
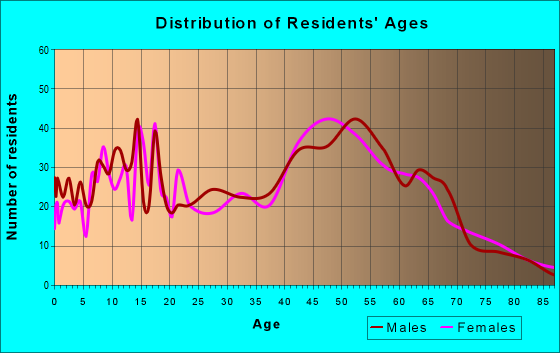
Males: 2,032 Females: 1,945
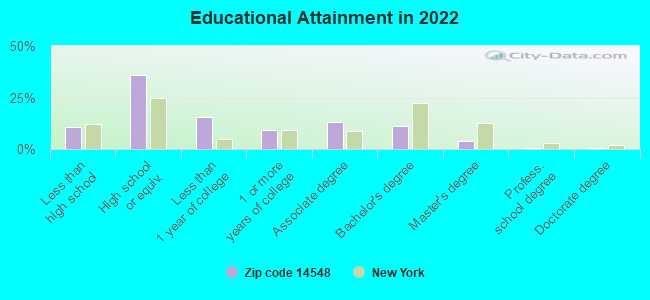
For population 25 years and over in 14548:
High school or higher: 88.7%Bachelor's degree or higher: 15.9%Graduate or professional degree: 4.7%Unemployed: 1.3%Mean travel time to work (commute): 26.9 minutes
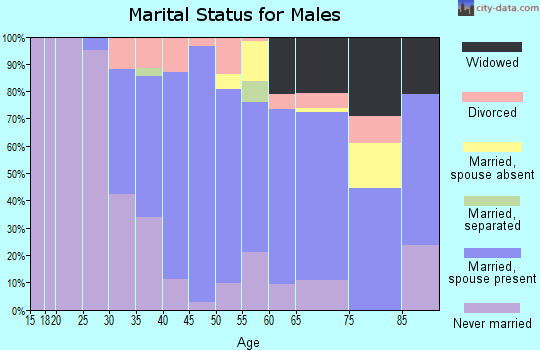
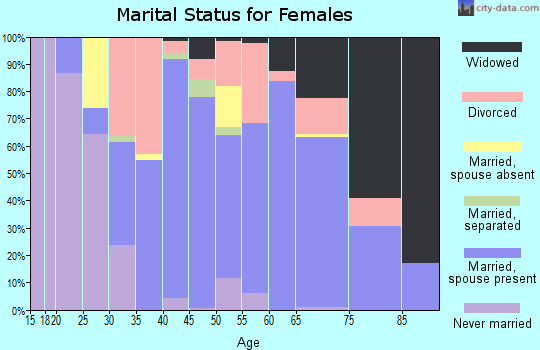
For population 15 years and over in 14548:
Never married: 29.1%Now married: 49.9%Separated: 2.4%Widowed: 4.8%Divorced: 13.8%
Zip code 14548 compared to state average:
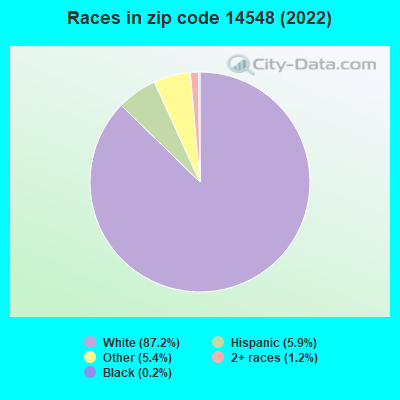
Median house value significantly below state average. Unemployed percentage significantly below state average. Black race population percentage significantly below state average. Hispanic race population percentage significantly below state average. Median age above state average. Foreign-born population percentage significantly below state average. Renting percentage below state average. Length of stay since moving in above state average. Number of rooms per house above state average. Percentage of population with a bachelor's degree or higher significantly below state average. 3,469 87.2% White 235 5.9% Hispanic or Latino 216 5.4% Some other race 48 1.2% Two or more races 8 0.2% Black
Data:
Median household income ($)
Median household income (% change since 2000)
Household income diversity
Ratio of average income to average house value (%)
Ratio of average income to average rent
Median household income ($) - White
Median household income ($) - Black or African American
Median household income ($) - Asian
Median household income ($) - Hispanic or Latino
Median household income ($) - American Indian and Alaska Native
Median household income ($) - Multirace
Median household income ($) - Other Race
Median household income for houses/condos with a mortgage ($)
Median household income for apartments without a mortgage ($)
Races - White alone (%)
Races - White alone (% change since 2000)
Races - Black alone (%)
Races - Black alone (% change since 2000)
Races - American Indian alone (%)
Races - American Indian alone (% change since 2000)
Races - Asian alone (%)
Races - Asian alone (% change since 2000)
Races - Hispanic (%)
Races - Hispanic (% change since 2000)
Races - Native Hawaiian and Other Pacific Islander alone (%)
Races - Native Hawaiian and Other Pacific Islander alone (% change since 2000)
Races - Two or more races (%)
Races - Two or more races (% change since 2000)
Races - Other race alone (%)
Races - Other race alone (% change since 2000)
Racial diversity
Unemployment (%)
Unemployment (% change since 2000)
Unemployment (%) - White
Unemployment (%) - Black or African American
Unemployment (%) - Asian
Unemployment (%) - Hispanic or Latino
Unemployment (%) - American Indian and Alaska Native
Unemployment (%) - Multirace
Unemployment (%) - Other Race
Population density (people per square mile)
Population - Males (%)
Population - Females (%)
Population - Males (%) - White
Population - Males (%) - Black or African American
Population - Males (%) - Asian
Population - Males (%) - Hispanic or Latino
Population - Males (%) - American Indian and Alaska Native
Population - Males (%) - Multirace
Population - Males (%) - Other Race
Population - Females (%) - White
Population - Females (%) - Black or African American
Population - Females (%) - Asian
Population - Females (%) - Hispanic or Latino
Population - Females (%) - American Indian and Alaska Native
Population - Females (%) - Multirace
Population - Females (%) - Other Race
Coronavirus confirmed cases (Apr 27, 2024)
Deaths caused by coronavirus (Apr 27, 2024)
Coronavirus confirmed cases (per 100k population) (Apr 27, 2024)
Deaths caused by coronavirus (per 100k population) (Apr 27, 2024)
Daily increase in number of cases (Apr 27, 2024)
Weekly increase in number of cases (Apr 27, 2024)
Cases doubled (in days) (Apr 27, 2024)
Hospitalized patients (Apr 18, 2022)
Negative test results (Apr 18, 2022)
Total test results (Apr 18, 2022)
COVID Vaccine doses distributed (per 100k population) (Sep 19, 2023)
COVID Vaccine doses administered (per 100k population) (Sep 19, 2023)
COVID Vaccine doses distributed (Sep 19, 2023)
COVID Vaccine doses administered (Sep 19, 2023)
Likely homosexual households (%)
Likely homosexual households (% change since 2000)
Likely homosexual households - Lesbian couples (%)
Likely homosexual households - Lesbian couples (% change since 2000)
Likely homosexual households - Gay men (%)
Likely homosexual households - Gay men (% change since 2000)
Cost of living index
Median gross rent ($)
Median contract rent ($)
Median monthly housing costs ($)
Median house or condo value ($)
Median house or condo value ($ change since 2000)
Mean house or condo value by units in structure - 1, detached ($)
Mean house or condo value by units in structure - 1, attached ($)
Mean house or condo value by units in structure - 2 ($)
Mean house or condo value by units in structure by units in structure - 3 or 4 ($)
Mean house or condo value by units in structure - 5 or more ($)
Mean house or condo value by units in structure - Boat, RV, van, etc. ($)
Mean house or condo value by units in structure - Mobile home ($)
Median house or condo value ($) - White
Median house or condo value ($) - Black or African American
Median house or condo value ($) - Asian
Median house or condo value ($) - Hispanic or Latino
Median house or condo value ($) - American Indian and Alaska Native
Median house or condo value ($) - Multirace
Median house or condo value ($) - Other Race
Median resident age
Resident age diversity
Median resident age - Males
Median resident age - Females
Median resident age - White
Median resident age - Black or African American
Median resident age - Asian
Median resident age - Hispanic or Latino
Median resident age - American Indian and Alaska Native
Median resident age - Multirace
Median resident age - Other Race
Median resident age - Males - White
Median resident age - Males - Black or African American
Median resident age - Males - Asian
Median resident age - Males - Hispanic or Latino
Median resident age - Males - American Indian and Alaska Native
Median resident age - Males - Multirace
Median resident age - Males - Other Race
Median resident age - Females - White
Median resident age - Females - Black or African American
Median resident age - Females - Asian
Median resident age - Females - Hispanic or Latino
Median resident age - Females - American Indian and Alaska Native
Median resident age - Females - Multirace
Median resident age - Females - Other Race
Commute - mean travel time to work (minutes)
Travel time to work - Less than 5 minutes (%)
Travel time to work - Less than 5 minutes (% change since 2000)
Travel time to work - 5 to 9 minutes (%)
Travel time to work - 5 to 9 minutes (% change since 2000)
Travel time to work - 10 to 19 minutes (%)
Travel time to work - 10 to 19 minutes (% change since 2000)
Travel time to work - 20 to 29 minutes (%)
Travel time to work - 20 to 29 minutes (% change since 2000)
Travel time to work - 30 to 39 minutes (%)
Travel time to work - 30 to 39 minutes (% change since 2000)
Travel time to work - 40 to 59 minutes (%)
Travel time to work - 40 to 59 minutes (% change since 2000)
Travel time to work - 60 to 89 minutes (%)
Travel time to work - 60 to 89 minutes (% change since 2000)
Travel time to work - 90 or more minutes (%)
Travel time to work - 90 or more minutes (% change since 2000)
Marital status - Never married (%)
Marital status - Now married (%)
Marital status - Separated (%)
Marital status - Widowed (%)
Marital status - Divorced (%)
Median family income ($)
Median family income (% change since 2000)
Median non-family income ($)
Median non-family income (% change since 2000)
Median per capita income ($)
Median per capita income (% change since 2000)
Median family income ($) - White
Median family income ($) - Black or African American
Median family income ($) - Asian
Median family income ($) - Hispanic or Latino
Median family income ($) - American Indian and Alaska Native
Median family income ($) - Multirace
Median family income ($) - Other Race
Median year house/condo built
Median year apartment built
Year house built - Built 2005 or later (%)
Year house built - Built 2000 to 2004 (%)
Year house built - Built 1990 to 1999 (%)
Year house built - Built 1980 to 1989 (%)
Year house built - Built 1970 to 1979 (%)
Year house built - Built 1960 to 1969 (%)
Year house built - Built 1950 to 1959 (%)
Year house built - Built 1940 to 1949 (%)
Year house built - Built 1939 or earlier (%)
Average household size
Household density (households per square mile)
Average household size - White
Average household size - Black or African American
Average household size - Asian
Average household size - Hispanic or Latino
Average household size - American Indian and Alaska Native
Average household size - Multirace
Average household size - Other Race
Occupied housing units (%)
Vacant housing units (%)
Owner occupied housing units (%)
Renter occupied housing units (%)
Vacancy status - For rent (%)
Vacancy status - For sale only (%)
Vacancy status - Rented or sold, not occupied (%)
Vacancy status - For seasonal, recreational, or occasional use (%)
Vacancy status - For migrant workers (%)
Vacancy status - Other vacant (%)
Residents with income below the poverty level (%)
Residents with income below 50% of the poverty level (%)
Children below poverty level (%)
Poor families by family type - Married-couple family (%)
Poor families by family type - Male, no wife present (%)
Poor families by family type - Female, no husband present (%)
Poverty status for native-born residents (%)
Poverty status for foreign-born residents (%)
Poverty among high school graduates not in families (%)
Poverty among people who did not graduate high school not in families (%)
Residents with income below the poverty level (%) - White
Residents with income below the poverty level (%) - Black or African American
Residents with income below the poverty level (%) - Asian
Residents with income below the poverty level (%) - Hispanic or Latino
Residents with income below the poverty level (%) - American Indian and Alaska Native
Residents with income below the poverty level (%) - Multirace
Residents with income below the poverty level (%) - Other Race
Air pollution - Air Quality Index (AQI)
Air pollution - CO
Air pollution - NO2
Air pollution - SO2
Air pollution - Ozone
Air pollution - PM10
Air pollution - PM25
Air pollution - Pb
Crime - Murders per 100,000 population
Crime - Rapes per 100,000 population
Crime - Robberies per 100,000 population
Crime - Assaults per 100,000 population
Crime - Burglaries per 100,000 population
Crime - Thefts per 100,000 population
Crime - Auto thefts per 100,000 population
Crime - Arson per 100,000 population
Crime - City-data.com crime index
Crime - Violent crime index
Crime - Property crime index
Crime - Murders per 100,000 population (5 year average)
Crime - Rapes per 100,000 population (5 year average)
Crime - Robberies per 100,000 population (5 year average)
Crime - Assaults per 100,000 population (5 year average)
Crime - Burglaries per 100,000 population (5 year average)
Crime - Thefts per 100,000 population (5 year average)
Crime - Auto thefts per 100,000 population (5 year average)
Crime - Arson per 100,000 population (5 year average)
Crime - City-data.com crime index (5 year average)
Crime - Violent crime index (5 year average)
Crime - Property crime index (5 year average)
1996 Presidential Elections Results (%) - Democratic Party (Clinton)
1996 Presidential Elections Results (%) - Republican Party (Dole)
1996 Presidential Elections Results (%) - Other
2000 Presidential Elections Results (%) - Democratic Party (Gore)
2000 Presidential Elections Results (%) - Republican Party (Bush)
2000 Presidential Elections Results (%) - Other
2004 Presidential Elections Results (%) - Democratic Party (Kerry)
2004 Presidential Elections Results (%) - Republican Party (Bush)
2004 Presidential Elections Results (%) - Other
2008 Presidential Elections Results (%) - Democratic Party (Obama)
2008 Presidential Elections Results (%) - Republican Party (McCain)
2008 Presidential Elections Results (%) - Other
2012 Presidential Elections Results (%) - Democratic Party (Obama)
2012 Presidential Elections Results (%) - Republican Party (Romney)
2012 Presidential Elections Results (%) - Other
2016 Presidential Elections Results (%) - Democratic Party (Clinton)
2016 Presidential Elections Results (%) - Republican Party (Trump)
2016 Presidential Elections Results (%) - Other
2020 Presidential Elections Results (%) - Democratic Party (Biden)
2020 Presidential Elections Results (%) - Republican Party (Trump)
2020 Presidential Elections Results (%) - Other
Ancestries Reported - Arab (%)
Ancestries Reported - Czech (%)
Ancestries Reported - Danish (%)
Ancestries Reported - Dutch (%)
Ancestries Reported - English (%)
Ancestries Reported - French (%)
Ancestries Reported - French Canadian (%)
Ancestries Reported - German (%)
Ancestries Reported - Greek (%)
Ancestries Reported - Hungarian (%)
Ancestries Reported - Irish (%)
Ancestries Reported - Italian (%)
Ancestries Reported - Lithuanian (%)
Ancestries Reported - Norwegian (%)
Ancestries Reported - Polish (%)
Ancestries Reported - Portuguese (%)
Ancestries Reported - Russian (%)
Ancestries Reported - Scotch-Irish (%)
Ancestries Reported - Scottish (%)
Ancestries Reported - Slovak (%)
Ancestries Reported - Subsaharan African (%)
Ancestries Reported - Swedish (%)
Ancestries Reported - Swiss (%)
Ancestries Reported - Ukrainian (%)
Ancestries Reported - United States (%)
Ancestries Reported - Welsh (%)
Ancestries Reported - West Indian (%)
Ancestries Reported - Other (%)
Educational Attainment - No schooling completed (%)
Educational Attainment - Less than high school (%)
Educational Attainment - High school or equivalent (%)
Educational Attainment - Less than 1 year of college (%)
Educational Attainment - 1 or more years of college (%)
Educational Attainment - Associate degree (%)
Educational Attainment - Bachelor's degree (%)
Educational Attainment - Master's degree (%)
Educational Attainment - Professional school degree (%)
Educational Attainment - Doctorate degree (%)
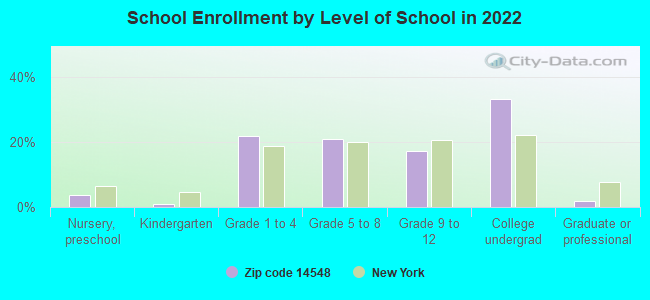
School Enrollment - Nursery, preschool (%)
School Enrollment - Kindergarten (%)
School Enrollment - Grade 1 to 4 (%)
School Enrollment - Grade 5 to 8 (%)
School Enrollment - Grade 9 to 12 (%)
School Enrollment - College undergrad (%)
School Enrollment - Graduate or professional (%)
School Enrollment - Not enrolled in school (%)
School enrollment - Public schools (%)
School enrollment - Private schools (%)
School enrollment - Not enrolled (%)
Median number of rooms in houses and condos
Median number of rooms in apartments
Housing units lacking complete plumbing facilities (%)
Housing units lacking complete kitchen facilities (%)
Density of houses
Urban houses (%)
Rural houses (%)
Households with people 60 years and over (%)
Households with people 65 years and over (%)
Households with people 75 years and over (%)
Households with one or more nonrelatives (%)
Households with no nonrelatives (%)
Population in households (%)
Family households (%)
Nonfamily households (%)
Population in families (%)
Family households with own children (%)
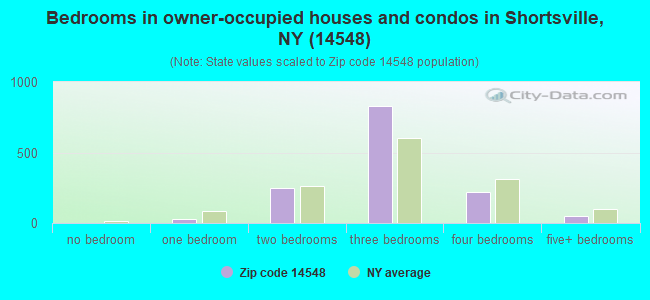
Median number of bedrooms in owner occupied houses
Mean number of bedrooms in owner occupied houses
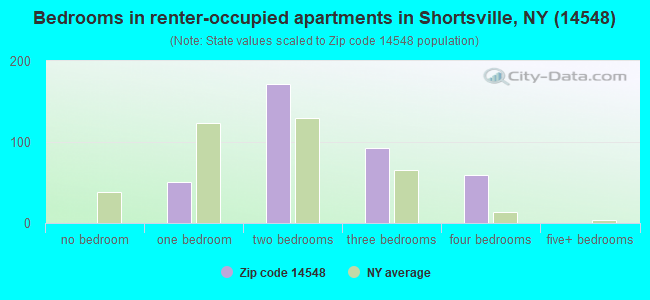
Median number of bedrooms in renter occupied houses
Mean number of bedrooms in renter occupied houses
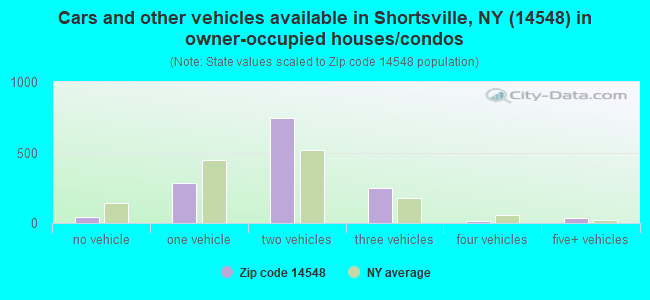
Median number of vehichles in owner occupied houses
Mean number of vehichles in owner occupied houses
Median number of vehichles in renter occupied houses
Mean number of vehichles in renter occupied houses
Mortgage status - with mortgage (%)
Mortgage status - with second mortgage (%)
Mortgage status - with home equity loan (%)
Mortgage status - with both second mortgage and home equity loan (%)
Mortgage status - without a mortgage (%)
Average family size
Average family size - White
Average family size - Black or African American
Average family size - Asian
Average family size - Hispanic or Latino
Average family size - American Indian and Alaska Native
Average family size - Multirace
Average family size - Other Race
Geographical mobility - Same house 1 year ago (%)
Geographical mobility - Moved within same county (%)
Geographical mobility - Moved from different county within same state (%)
Geographical mobility - Moved from different state (%)
Geographical mobility - Moved from abroad (%)
Place of birth - Born in state of residence (%)
Place of birth - Born in other state (%)
Place of birth - Native, outside of US (%)
Place of birth - Foreign born (%)
Housing units in structures - 1, detached (%)
Housing units in structures - 1, attached (%)
Housing units in structures - 2 (%)
Housing units in structures - 3 or 4 (%)
Housing units in structures - 5 to 9 (%)
Housing units in structures - 10 to 19 (%)
Housing units in structures - 20 to 49 (%)
Housing units in structures - 50 or more (%)
Housing units in structures - Mobile home (%)
Housing units in structures - Boat, RV, van, etc. (%)
House/condo owner moved in on average (years ago)
Renter moved in on average (years ago)
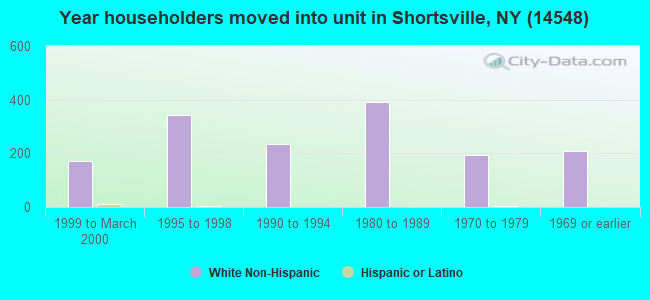
Year householder moved into unit - Moved in 1999 to March 2000 (%)
Year householder moved into unit - Moved in 1995 to 1998 (%)
Year householder moved into unit - Moved in 1990 to 1994 (%)
Year householder moved into unit - Moved in 1980 to 1989 (%)
Year householder moved into unit - Moved in 1970 to 1979 (%)
Year householder moved into unit - Moved in 1969 or earlier (%)
Means of transportation to work - Drove car alone (%)
Means of transportation to work - Carpooled (%)
Means of transportation to work - Public transportation (%)
Means of transportation to work - Bus or trolley bus (%)
Means of transportation to work - Streetcar or trolley car (%)
Means of transportation to work - Subway or elevated (%)
Means of transportation to work - Railroad (%)
Means of transportation to work - Ferryboat (%)
Means of transportation to work - Taxicab (%)
Means of transportation to work - Motorcycle (%)
Means of transportation to work - Bicycle (%)
Means of transportation to work - Walked (%)
Means of transportation to work - Other means (%)
Working at home (%)
Industry diversity
Most Common Industries - Agriculture, forestry, fishing and hunting, and mining (%)
Most Common Industries - Agriculture, forestry, fishing and hunting (%)
Most Common Industries - Mining, quarrying, and oil and gas extraction (%)
Most Common Industries - Construction (%)
Most Common Industries - Manufacturing (%)
Most Common Industries - Wholesale trade (%)
Most Common Industries - Retail trade (%)
Most Common Industries - Transportation and warehousing, and utilities (%)
Most Common Industries - Transportation and warehousing (%)
Most Common Industries - Utilities (%)
Most Common Industries - Information (%)
Most Common Industries - Finance and insurance, and real estate and rental and leasing (%)
Most Common Industries - Finance and insurance (%)
Most Common Industries - Real estate and rental and leasing (%)
Most Common Industries - Professional, scientific, and management, and administrative and waste management services (%)
Most Common Industries - Professional, scientific, and technical services (%)
Most Common Industries - Management of companies and enterprises (%)
Most Common Industries - Administrative and support and waste management services (%)
Most Common Industries - Educational services, and health care and social assistance (%)
Most Common Industries - Educational services (%)
Most Common Industries - Health care and social assistance (%)
Most Common Industries - Arts, entertainment, and recreation, and accommodation and food services (%)
Most Common Industries - Arts, entertainment, and recreation (%)
Most Common Industries - Accommodation and food services (%)
Most Common Industries - Other services, except public administration (%)
Most Common Industries - Public administration (%)
Occupation diversity
Most Common Occupations - Management, business, science, and arts occupations (%)
Most Common Occupations - Management, business, and financial occupations (%)
Most Common Occupations - Management occupations (%)
Most Common Occupations - Business and financial operations occupations (%)
Most Common Occupations - Computer, engineering, and science occupations (%)
Most Common Occupations - Computer and mathematical occupations (%)
Most Common Occupations - Architecture and engineering occupations (%)
Most Common Occupations - Life, physical, and social science occupations (%)
Most Common Occupations - Education, legal, community service, arts, and media occupations (%)
Most Common Occupations - Community and social service occupations (%)
Most Common Occupations - Legal occupations (%)
Most Common Occupations - Education, training, and library occupations (%)
Most Common Occupations - Arts, design, entertainment, sports, and media occupations (%)
Most Common Occupations - Healthcare practitioners and technical occupations (%)
Most Common Occupations - Health diagnosing and treating practitioners and other technical occupations (%)
Most Common Occupations - Health technologists and technicians (%)
Most Common Occupations - Service occupations (%)
Most Common Occupations - Healthcare support occupations (%)
Most Common Occupations - Protective service occupations (%)
Most Common Occupations - Fire fighting and prevention, and other protective service workers including supervisors (%)
Most Common Occupations - Law enforcement workers including supervisors (%)
Most Common Occupations - Food preparation and serving related occupations (%)
Most Common Occupations - Building and grounds cleaning and maintenance occupations (%)
Most Common Occupations - Personal care and service occupations (%)
Most Common Occupations - Sales and office occupations (%)
Most Common Occupations - Sales and related occupations (%)
Most Common Occupations - Office and administrative support occupations (%)
Most Common Occupations - Natural resources, construction, and maintenance occupations (%)
Most Common Occupations - Farming, fishing, and forestry occupations (%)
Most Common Occupations - Construction and extraction occupations (%)
Most Common Occupations - Installation, maintenance, and repair occupations (%)
Most Common Occupations - Production, transportation, and material moving occupations (%)
Most Common Occupations - Production occupations (%)
Most Common Occupations - Transportation occupations (%)
Most Common Occupations - Material moving occupations (%)
People in Group quarters - Institutionalized population (%)
People in Group quarters - Correctional institutions (%)
People in Group quarters - Federal prisons and detention centers (%)
People in Group quarters - Halfway houses (%)
People in Group quarters - Local jails and other confinement facilities (including police lockups) (%)
People in Group quarters - Military disciplinary barracks (%)
People in Group quarters - State prisons (%)
People in Group quarters - Other types of correctional institutions (%)
People in Group quarters - Nursing homes (%)
People in Group quarters - Hospitals/wards, hospices, and schools for the handicapped (%)
People in Group quarters - Hospitals/wards and hospices for chronically ill (%)
People in Group quarters - Hospices or homes for chronically ill (%)
People in Group quarters - Military hospitals or wards for chronically ill (%)
People in Group quarters - Other hospitals or wards for chronically ill (%)
People in Group quarters - Hospitals or wards for drug/alcohol abuse (%)
People in Group quarters - Mental (Psychiatric) hospitals or wards (%)
People in Group quarters - Schools, hospitals, or wards for the mentally retarded (%)
People in Group quarters - Schools, hospitals, or wards for the physically handicapped (%)
People in Group quarters - Institutions for the deaf (%)
People in Group quarters - Institutions for the blind (%)
People in Group quarters - Orthopedic wards and institutions for the physically handicapped (%)
People in Group quarters - Wards in general hospitals for patients who have no usual home elsewhere (%)
People in Group quarters - Wards in military hospitals for patients who have no usual home elsewhere (%)
People in Group quarters - Juvenile institutions (%)
People in Group quarters - Long-term care (%)
People in Group quarters - Homes for abused, dependent, and neglected children (%)
People in Group quarters - Residential treatment centers for emotionally disturbed children (%)
People in Group quarters - Training schools for juvenile delinquents (%)
People in Group quarters - Short-term care, detention or diagnostic centers for delinquent children (%)
People in Group quarters - Type of juvenile institution unknown (%)
People in Group quarters - Noninstitutionalized population (%)
People in Group quarters - College dormitories (includes college quarters off campus) (%)
People in Group quarters - Military quarters (%)
People in Group quarters - On base (%)
People in Group quarters - Barracks, unaccompanied personnel housing (UPH), (Enlisted/Officer), ;and similar group living quarters for military personnel (%)
People in Group quarters - Transient quarters for temporary residents (%)
People in Group quarters - Military ships (%)
People in Group quarters - Group homes (%)
People in Group quarters - Homes or halfway houses for drug/alcohol abuse (%)
People in Group quarters - Homes for the mentally ill (%)
People in Group quarters - Homes for the mentally retarded (%)
People in Group quarters - Homes for the physically handicapped (%)
People in Group quarters - Other group homes (%)
People in Group quarters - Religious group quarters (%)
People in Group quarters - Dormitories (%)
People in Group quarters - Agriculture workers' dormitories on farms (%)
People in Group quarters - Job Corps and vocational training facilities (%)
People in Group quarters - Other workers' dormitories (%)
People in Group quarters - Crews of maritime vessels (%)
People in Group quarters - Other nonhousehold living situations (%)
People in Group quarters - Other noninstitutional group quarters (%)
Residents speaking English at home (%)
Residents speaking English at home - Born in the United States (%)
Residents speaking English at home - Native, born elsewhere (%)
Residents speaking English at home - Foreign born (%)
Residents speaking Spanish at home (%)
Residents speaking Spanish at home - Born in the United States (%)
Residents speaking Spanish at home - Native, born elsewhere (%)
Residents speaking Spanish at home - Foreign born (%)
Residents speaking other language at home (%)
Residents speaking other language at home - Born in the United States (%)
Residents speaking other language at home - Native, born elsewhere (%)
Residents speaking other language at home - Foreign born (%)
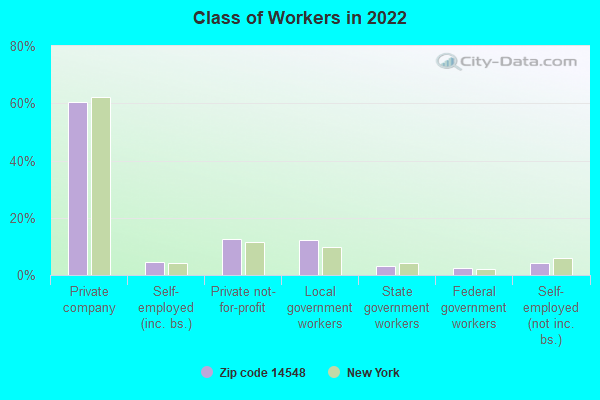
Class of Workers - Employee of private company (%)
Class of Workers - Self-employed in own incorporated business (%)
Class of Workers - Private not-for-profit wage and salary workers (%)
Class of Workers - Local government workers (%)
Class of Workers - State government workers (%)
Class of Workers - Federal government workers (%)
Class of Workers - Self-employed workers in own not incorporated business and Unpaid family workers (%)
House heating fuel used in houses and condos - Utility gas (%)
House heating fuel used in houses and condos - Bottled, tank, or LP gas (%)
House heating fuel used in houses and condos - Electricity (%)
House heating fuel used in houses and condos - Fuel oil, kerosene, etc. (%)
House heating fuel used in houses and condos - Coal or coke (%)
House heating fuel used in houses and condos - Wood (%)
House heating fuel used in houses and condos - Solar energy (%)
House heating fuel used in houses and condos - Other fuel (%)
House heating fuel used in houses and condos - No fuel used (%)
House heating fuel used in apartments - Utility gas (%)
House heating fuel used in apartments - Bottled, tank, or LP gas (%)
House heating fuel used in apartments - Electricity (%)
House heating fuel used in apartments - Fuel oil, kerosene, etc. (%)
House heating fuel used in apartments - Coal or coke (%)
House heating fuel used in apartments - Wood (%)
House heating fuel used in apartments - Solar energy (%)
House heating fuel used in apartments - Other fuel (%)
House heating fuel used in apartments - No fuel used (%)
Armed forces status - In Armed Forces (%)
Armed forces status - Civilian (%)
Armed forces status - Civilian - Veteran (%)
Armed forces status - Civilian - Nonveteran (%)
Fatal accidents locations in years 2005-2021
Fatal accidents locations in 2005
Fatal accidents locations in 2006
Fatal accidents locations in 2007
Fatal accidents locations in 2008
Fatal accidents locations in 2009
Fatal accidents locations in 2010
Fatal accidents locations in 2011
Fatal accidents locations in 2012
Fatal accidents locations in 2013
Fatal accidents locations in 2014
Fatal accidents locations in 2015
Fatal accidents locations in 2016
Fatal accidents locations in 2017
Fatal accidents locations in 2018
Fatal accidents locations in 2019
Fatal accidents locations in 2020
Fatal accidents locations in 2021
Alcohol use - People drinking some alcohol every month (%)
Alcohol use - People not drinking at all (%)
Alcohol use - Average days/month drinking alcohol
Alcohol use - Average drinks/week
Alcohol use - Average days/year people drink much
Audiometry - Average condition of hearing (%)
Audiometry - People that can hear a whisper from across a quiet room (%)
Audiometry - People that can hear normal voice from across a quiet room (%)
Audiometry - Ears ringing, roaring, buzzing (%)
Audiometry - Had a job exposure to loud noise (%)
Audiometry - Had off-work exposure to loud noise (%)
Blood Pressure & Cholesterol - Has high blood pressure (%)
Blood Pressure & Cholesterol - Checking blood pressure at home (%)
Blood Pressure & Cholesterol - Frequently checking blood cholesterol (%)
Blood Pressure & Cholesterol - Has high cholesterol level (%)
Consumer Behavior - Money monthly spent on food at supermarket/grocery store
Consumer Behavior - Money monthly spent on food at other stores
Consumer Behavior - Money monthly spent on eating out
Consumer Behavior - Money monthly spent on carryout/delivered foods
Consumer Behavior - Income spent on food at supermarket/grocery store (%)
Consumer Behavior - Income spent on food at other stores (%)
Consumer Behavior - Income spent on eating out (%)
Consumer Behavior - Income spent on carryout/delivered foods (%)
Current Health Status - General health condition (%)
Current Health Status - Blood donors (%)
Current Health Status - Has blood ever tested for HIV virus (%)
Current Health Status - Left-handed people (%)
Dermatology - People using sunscreen (%)
Diabetes - Diabetics (%)
Diabetes - Had a blood test for high blood sugar (%)
Diabetes - People taking insulin (%)
Diet Behavior & Nutrition - Diet health (%)
Diet Behavior & Nutrition - Milk product consumption (# of products/month)
Diet Behavior & Nutrition - Meals not home prepared (#/week)
Diet Behavior & Nutrition - Meals from fast food or pizza place (#/week)
Diet Behavior & Nutrition - Ready-to-eat foods (#/month)
Diet Behavior & Nutrition - Frozen meals/pizza (#/month)
Drug Use - People that ever used marijuana or hashish (%)
Drug Use - Ever used hard drugs (%)
Drug Use - Ever used any form of cocaine (%)
Drug Use - Ever used heroin (%)
Drug Use - Ever used methamphetamine (%)
Health Insurance - People covered by health insurance (%)
Kidney Conditions-Urology - Avg. # of times urinating at night
Medical Conditions - People with asthma (%)
Medical Conditions - People with anemia (%)
Medical Conditions - People with psoriasis (%)
Medical Conditions - People with overweight (%)
Medical Conditions - Elderly people having difficulties in thinking or remembering (%)
Medical Conditions - People who ever received blood transfusion (%)
Medical Conditions - People having trouble seeing even with glass/contacts (%)
Medical Conditions - People with arthritis (%)
Medical Conditions - People with gout (%)
Medical Conditions - People with congestive heart failure (%)
Medical Conditions - People with coronary heart disease (%)
Medical Conditions - People with angina pectoris (%)
Medical Conditions - People who ever had heart attack (%)
Medical Conditions - People who ever had stroke (%)
Medical Conditions - People with emphysema (%)
Medical Conditions - People with thyroid problem (%)
Medical Conditions - People with chronic bronchitis (%)
Medical Conditions - People with any liver condition (%)
Medical Conditions - People who ever had cancer or malignancy (%)
Mental Health - People who have little interest in doing things (%)
Mental Health - People feeling down, depressed, or hopeless (%)
Mental Health - People who have trouble sleeping or sleeping too much (%)
Mental Health - People feeling tired or having little energy (%)
Mental Health - People with poor appetite or overeating (%)
Mental Health - People feeling bad about themself (%)
Mental Health - People who have trouble concentrating on things (%)
Mental Health - People moving or speaking slowly or too fast (%)
Mental Health - People having thoughts they would be better off dead (%)
Oral Health - Average years since last visit a dentist
Oral Health - People embarrassed because of mouth (%)
Oral Health - People with gum disease (%)
Oral Health - General health of teeth and gums (%)
Oral Health - Average days a week using dental floss/device
Oral Health - Average days a week using mouthwash for dental problem
Oral Health - Average number of teeth
Pesticide Use - Households using pesticides to control insects (%)
Pesticide Use - Households using pesticides to kill weeds (%)
Physical Activity - People doing vigorous-intensity work activities (%)
Physical Activity - People doing moderate-intensity work activities (%)
Physical Activity - People walking or bicycling (%)
Physical Activity - People doing vigorous-intensity recreational activities (%)
Physical Activity - People doing moderate-intensity recreational activities (%)
Physical Activity - Average hours a day doing sedentary activities
Physical Activity - Average hours a day watching TV or videos
Physical Activity - Average hours a day using computer
Physical Functioning - People having limitations keeping them from working (%)
Physical Functioning - People limited in amount of work they can do (%)
Physical Functioning - People that need special equipment to walk (%)
Physical Functioning - People experiencing confusion/memory problems (%)
Physical Functioning - People requiring special healthcare equipment (%)
Prescription Medications - Average number of prescription medicines taking
Preventive Aspirin Use - Adults 40+ taking low-dose aspirin (%)
Reproductive Health - Vaginal deliveries (%)
Reproductive Health - Cesarean deliveries (%)
Reproductive Health - Deliveries resulted in a live birth (%)
Reproductive Health - Pregnancies resulted in a delivery (%)
Reproductive Health - Women breastfeeding newborns (%)
Reproductive Health - Women that had a hysterectomy (%)
Reproductive Health - Women that had both ovaries removed (%)
Reproductive Health - Women that have ever taken birth control pills (%)
Reproductive Health - Women taking birth control pills (%)
Reproductive Health - Women that have ever used Depo-Provera or injectables (%)
Reproductive Health - Women that have ever used female hormones (%)
Sexual Behavior - People 18+ that ever had sex (vaginal, anal, or oral) (%)
Sexual Behavior - Males 18+ that ever had vaginal sex with a woman (%)
Sexual Behavior - Males 18+ that ever performed oral sex on a woman (%)
Sexual Behavior - Males 18+ that ever had anal sex with a woman (%)
Sexual Behavior - Males 18+ that ever had any sex with a man (%)
Sexual Behavior - Females 18+ that ever had vaginal sex with a man (%)
Sexual Behavior - Females 18+ that ever performed oral sex on a man (%)
Sexual Behavior - Females 18+ that ever had anal sex with a man (%)
Sexual Behavior - Females 18+ that ever had any kind of sex with a woman (%)
Sexual Behavior - Average age people first had sex
Sexual Behavior - Average number of female sex partners in lifetime (males 18+)
Sexual Behavior - Average number of female vaginal sex partners in lifetime (males 18+)
Sexual Behavior - Average age people first performed oral sex on a woman (18+)
Sexual Behavior - Average number of woman performed oral sex on in lifetime (18+)
Sexual Behavior - Average number of male sex partners in lifetime (males 18+)
Sexual Behavior - Average number of male anal sex partners in lifetime (males 18+)
Sexual Behavior - Average age people first performed oral sex on a man (18+)
Sexual Behavior - Average number of male oral sex partners in lifetime (18+)
Sexual Behavior - People using protection when performing oral sex (%)
Sexual Behavior - Average number of times people have vaginal or anal sex a year
Sexual Behavior - People having sex without condom (%)
Sexual Behavior - Average number of male sex partners in lifetime (females 18+)
Sexual Behavior - Average number of male vaginal sex partners in lifetime (females 18+)
Sexual Behavior - Average number of female sex partners in lifetime (females 18+)
Sexual Behavior - Circumcised males 18+ (%)
Sleep Disorders - Average hours sleeping at night
Sleep Disorders - People that has trouble sleeping (%)
Smoking-Cigarette Use - People smoking cigarettes (%)
Taste & Smell - People 40+ having problems with smell (%)
Taste & Smell - People 40+ having problems with taste (%)
Taste & Smell - People 40+ that ever had wisdom teeth removed (%)
Taste & Smell - People 40+ that ever had tonsils teeth removed (%)
Taste & Smell - People 40+ that ever had a loss of consciousness because of a head injury (%)
Taste & Smell - People 40+ that ever had a broken nose or other serious injury to face or skull (%)
Taste & Smell - People 40+ that ever had two or more sinus infections (%)
Weight - Average height (inches)
Weight - Average weight (pounds)
Weight - Average BMI
Weight - People that are obese (%)
Weight - People that ever were obese (%)
Weight - People trying to lose weight (%)
Urban population: 2,015
Rural population: 1,961
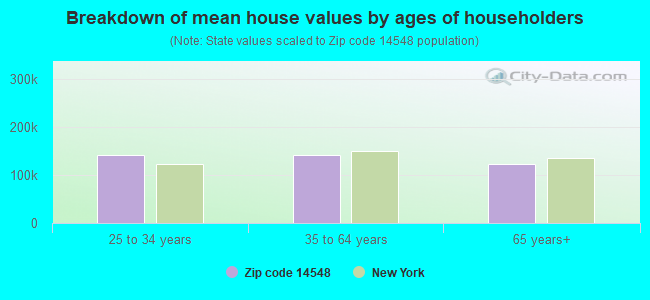
Estimated median house/condo value in 2022: $142,501
14548:
$142,501New York:
$400,400
Median resident age: This zip code:
46.6 yearsNew York median age:
40.0 years
Average household size: This zip code:
2.2 peopleNew York:
2.5 people
Averages for the 2020 tax year for zip code 14548, filed in 2021:
Average Adjusted Gross Income (AGI) in 2020: $53,158 (Individual Income Tax Returns) Here:
$53,158State:
$90,930
Salary/wage: $46,720 (reported on 83.0% of returns )Here:
$46,720State:
$72,104
(% of AGI for various income ranges: 1165.7% for AGIs below $25k , 3445.4% for AGIs $25k-50k , 5736.2% for AGIs $50k-75k , 9503.1% for AGIs $75k-100k , 16768.0% for AGIs $100k-200k ) Taxable interest for individuals: $448 (reported on 40.5% of returns )This zip code:
$448New York:
$3,075
(% of AGI for various income ranges: 13.6% for AGIs below $25k , 12.7% for AGIs $25k-50k , 23.8% for AGIs $50k-75k , 21.5% for AGIs $75k-100k , 65.3% for AGIs $100k-200k ) Ordinary dividends: $2,015 (reported on 16.5% of returns )(% of AGI for various income ranges: 30.2% for AGIs below $25k , 23.3% for AGIs $25k-50k , 44.6% for AGIs $50k-75k , 66.2% for AGIs $75k-100k , 155.3% for AGIs $100k-200k ) Net capital gain/loss in AGI: +$5,035 (reported on 11.5% of returns )Here:
+$5,035State:
+$44,925
(% of AGI for various income ranges: 20.2% for AGIs below $25k , 25.6% for AGIs $25k-50k , 88.8% for AGIs $50k-75k , 119.2% for AGIs $75k-100k , 388.0% for AGIs $100k-200k ) Profit/loss from business: +$9,332 (reported on 11.0% of returns )Here:
+$9,332State:
+$14,940
(% of AGI for various income ranges: 54.0% for AGIs below $25k , 91.9% for AGIs $25k-50k , 120.0% for AGIs $50k-75k , 66.2% for AGIs $75k-100k , 674.0% for AGIs $100k-200k ) Taxable individual retirement arrangement distribution: $16,230 (reported on 11.5% of returns )14548:
$16,230New York:
$19,609
(% of AGI for various income ranges: 84.3% for AGIs below $25k , 103.1% for AGIs $25k-50k , 322.5% for AGIs $50k-75k , 423.8% for AGIs $75k-100k , 1039.3% for AGIs $100k-200k ) Total itemized deductions: $18,783 (reported on 3.0% of returns )Here:
$18,783State:
$39,326
(% of AGI for various income ranges: 98.3% for AGIs $25k-50k , 503.8% for AGIs $75k-100k ) Charity contributions: $2,175 (reported on 2.0% of returns )(% of AGI for various income ranges: 66.9% for AGIs $75k-100k ) Taxes paid: $7,700 (reported on 3.0% of returns )(% of AGI for various income ranges: 38.8% for AGIs $25k-50k , 212.3% for AGIs $75k-100k ) Earned income credit: $1,846 (reported on 14.0% of returns )(% of AGI for various income ranges: 56.7% for AGIs below $25k , 58.1% for AGIs $25k-50k ) Percentage of individuals using paid preparers for their 2020 taxes: 95.5%(% for various income ranges: 95.1% for AGIs below $25k , 95.0% for AGIs $25k-50k , 96.8% for AGIs $50k-75k , 94.7% for AGIs $75k-100k , 96.2% for AGIs $100k-200k , 100.0% for AGIs over 200k )
Averages for the 2012 tax year for zip code 14548, filed in 2013:
Average Adjusted Gross Income (AGI) in 2012: $43,974 (Individual Income Tax Returns) Here:
$43,974State:
$77,088
Salary/wage: $40,414 (reported on 85.2% of returns )Here:
$40,414State:
$60,593
(% of AGI for various income ranges: 72.9% for AGIs below $25k , 79.5% for AGIs $25k-50k , 80.8% for AGIs $50k-75k , 80.0% for AGIs $75k-100k , 76.3% for AGIs $100k-200k ) Taxable interest for individuals: $343 (reported on 40.3% of returns )This zip code:
$343New York:
$3,125
(% of AGI for various income ranges: 1.0% for AGIs below $25k , 0.2% for AGIs $25k-50k , 0.2% for AGIs $50k-75k , 0.3% for AGIs $75k-100k , 0.3% for AGIs $100k-200k ) Ordinary dividends: $1,018 (reported on 17.3% of returns )(% of AGI for various income ranges: 1.1% for AGIs below $25k , 0.3% for AGIs $25k-50k , 0.4% for AGIs $50k-75k , 0.1% for AGIs $75k-100k , 0.4% for AGIs $100k-200k ) Net capital gain/loss in AGI: +$1,529 (reported on 8.7% of returns )Here:
+$1,529State:
+$42,474
(% of AGI for various income ranges: 1.2% for AGIs $75k-100k , 0.4% for AGIs $100k-200k ) Profit/loss from business: +$9,070 (reported on 11.7% of returns )Here:
+$9,070State:
+$16,168
(% of AGI for various income ranges: 5.5% for AGIs below $25k , 3.2% for AGIs $25k-50k , 1.6% for AGIs $50k-75k , 0.6% for AGIs $75k-100k , 2.5% for AGIs $100k-200k ) Taxable individual retirement arrangement distribution: $9,855 (reported on 11.2% of returns )14548:
$9,855New York:
$17,621
(% of AGI for various income ranges: 4.2% for AGIs below $25k , 2.4% for AGIs $25k-50k , 2.4% for AGIs $50k-75k , 2.8% for AGIs $75k-100k , 1.8% for AGIs $100k-200k ) Total itemized deductions: $16,827 (22% of AGI, reported on 26.5% of returns )Here:
$16,827State:
$34,985
Here:
21.6% of AGIState:
21.3% of AGI
(% of AGI for various income ranges: 7.1% for AGIs below $25k , 7.3% for AGIs $25k-50k , 9.6% for AGIs $50k-75k , 11.7% for AGIs $75k-100k , 13.2% for AGIs $100k-200k ) Charity contributions: $2,021 (reported on 21.9% of returns )(% of AGI for various income ranges: 0.4% for AGIs below $25k , 0.6% for AGIs $25k-50k , 1.0% for AGIs $50k-75k , 1.3% for AGIs $75k-100k , 1.4% for AGIs $100k-200k ) Taxes paid: $8,110 (reported on 26.5% of returns )14548:
$8,110State:
$18,656
(% of AGI for various income ranges: 2.1% for AGIs below $25k , 2.5% for AGIs $25k-50k , 4.3% for AGIs $50k-75k , 5.7% for AGIs $75k-100k , 8.1% for AGIs $100k-200k ) Earned income credit: $2,012 (reported on 16.8% of returns )(% of AGI for various income ranges: 5.1% for AGIs below $25k , 0.9% for AGIs $25k-50k ) Percentage of individuals using paid preparers for their 2012 taxes: 53.6%(% for various income ranges: 48.7% for AGIs below $25k , 54.9% for AGIs $25k-50k , 54.8% for AGIs $50k-75k , 52.6% for AGIs $75k-100k , 70.6% for AGIs $100k-200k )
Averages for the 2004 tax year for zip code 14548, filed in 2005:
Average Adjusted Gross Income (AGI) in 2004: $37,769 (Individual Income Tax Returns) Here:
$37,769State:
$59,519
Salary/wage: $36,073 (reported on 88.2% of returns )Here:
$36,073State:
$50,673
(% of AGI for various income ranges: 109.7% for AGIs below $10k , 72.7% for AGIs $10k-25k , 84.6% for AGIs $25k-50k , 85.7% for AGIs $50k-75k , 90.7% for AGIs $75k-100k , 78.9% for AGIs over 100k ) Taxable interest for individuals: $514 (reported on 49.5% of returns )This zip code:
$514New York:
$2,377
(% of AGI for various income ranges: 4.0% for AGIs below $10k , 1.6% for AGIs $10k-25k , 0.5% for AGIs $25k-50k , 0.6% for AGIs $50k-75k , 0.3% for AGIs $75k-100k , 0.5% for AGIs over 100k ) Taxable dividends: $862 (reported on 22.3% of returns )(% of AGI for various income ranges: 1.2% for AGIs below $10k , 1.5% for AGIs $10k-25k , 0.5% for AGIs $25k-50k , 0.3% for AGIs $50k-75k , 0.2% for AGIs $75k-100k , 0.5% for AGIs over 100k ) Net capital gain/loss: +$604 (reported on 14.5% of returns )(% of AGI for various income ranges: -0.7% for AGIs below $10k , 0.3% for AGIs $10k-25k , 0.1% for AGIs $25k-50k , 0.3% for AGIs $50k-75k , 0.2% for AGIs $75k-100k , 0.4% for AGIs over 100k ) Profit/loss from business: +$5,722 (reported on 13.0% of returns )Here:
+$5,722State:
+$13,809
(% of AGI for various income ranges: 5.7% for AGIs below $10k , 4.1% for AGIs $10k-25k , 1.9% for AGIs $25k-50k , 1.4% for AGIs $50k-75k , 0.6% for AGIs $75k-100k , 2.8% for AGIs over 100k ) IRA payment deduction: $2,822 (reported on 2.4% of returns )14548:
$2,822New York:
$3,115
Total itemized deductions: $14,184 (22% of AGI, reported on 29.8% of returns )Here:
$14,184State:
$25,864
Here:
21.6% of AGIState:
21.9% of AGI
(% of AGI for various income ranges: 8.3% for AGIs $10k-25k , 8.1% for AGIs $25k-50k , 11.6% for AGIs $50k-75k , 15.1% for AGIs $75k-100k , 15.0% for AGIs over 100k ) Charity contributions deductions: $1,918 (3% of AGI, reported on 26.3% of returns )Here:
2.8% of AGIState:
3.6% of AGI
(% of AGI for various income ranges: 0.5% for AGIs $10k-25k , 0.8% for AGIs $25k-50k , 1.5% for AGIs $50k-75k , 2.0% for AGIs $75k-100k , 2.0% for AGIs over 100k ) Total tax: $4,279 (reported on 76.9% of returns )14548:
$4,279State:
$11,730
(% of AGI for various income ranges: 3.6% for AGIs below $10k , 4.5% for AGIs $10k-25k , 6.8% for AGIs $25k-50k , 8.6% for AGIs $50k-75k , 10.0% for AGIs $75k-100k , 14.7% for AGIs over 100k ) Earned income credit: $1,576 (reported on 13.1% of returns )Percentage of individuals using paid preparers for their 2004 taxes: 58.1%(% for various income ranges: 49.7% for AGIs below $10k , 58.2% for AGIs $10k-25k , 59.0% for AGIs $25k-50k , 59.4% for AGIs $50k-75k , 64.7% for AGIs $75k-100k , 69.9% for AGIs over 100k )
Estimated median household income in 2022: This zip code:
$72,755New York:
$79,557
Nearest zip codes: 14504 ,
14522 ,
14425 ,
14537 ,
14432 ,
14424 .
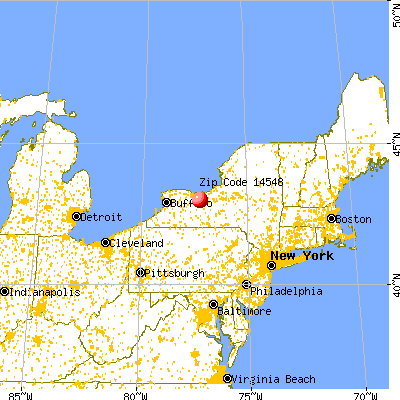
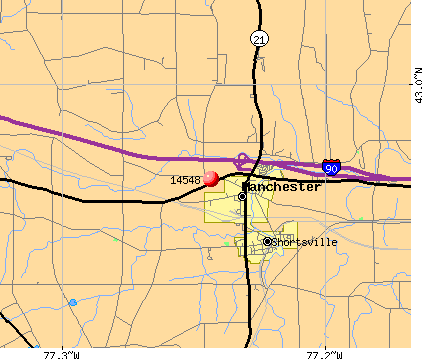
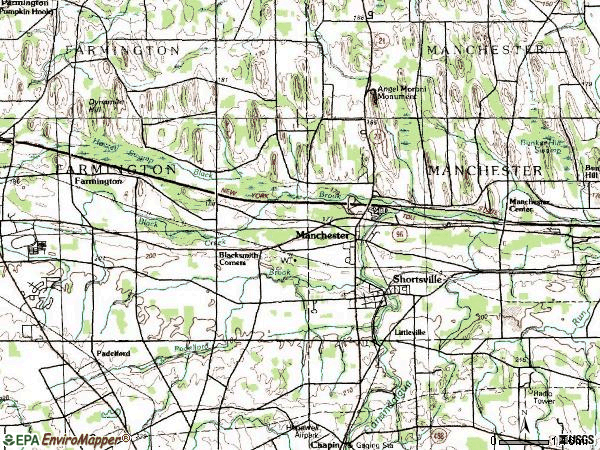
Manchester Zip Code Map
Percentage of family households: This zip code:
41.4%New York:
41.3%
Percentage of households with unmarried partners: This zip code:
14.3%New York:
42.3%
No gay or lesbian households reported
Household received Food Stamps/SNAP in the past 12 months: 255Household did not receive Food Stamps/SNAP in the past 12 months: 1,504
Women who had a birth in the past 12 months: 20 (20 now married , 0 unmarried) Women who did not have a birth in the past 12 months: 826 (267 now married , 560 unmarried)
Housing units in zip code 14548 with a mortgage: 815 (83
second mortgage , 84
both second mortgage and home equity loan )
Houses without a mortgage: 48
Median monthly owner costs for units with a mortgage: $1,214
Median monthly owner costs for units without a mortgage: $625
Residents with income below the poverty level in 2022:
This zip code:
14.9%Whole state:
14.3%
Residents with income below 50% of the poverty level in 2022:
This zip code:
7.9%Whole state:
6.8%
Median number of rooms in houses and condos: Median number of rooms in apartments: Notable locations in this zip code not listed on our city pages
Click to draw/clear zip code borders Notable locations in zip code 14548: (A) , R And R Farms (B) , Fresh-Ayr Farm (C) , Black Brook Farm (D) , Manchester Toll Plaza (E) , Winged Pheasant Golf Club (F) , Blacksmith Corners (G) , Manchester Village Hall (H) , Red Jacket Community Library (I) . Display/hide their locations on the map
Churches in zip code 14548 include: (A) , Shortsville Methodist Church (B) , Trinity Episcopal Church (C) , First Presbyterian Church (D) , Saint Dominics Roman Catholic Church (E) , Manchester Baptist Church (F) , Manchester Methodist Church (G) . Display/hide their locations on the map
Cemeteries: (1) , South Farmington Cemetery (2) , Village Cemetery (3) , Brookside Cemetery (4) , Manchester Village Cemetery (5) , Coopers Cemetery (6) , Pioneers Cemetery (7) . Display/hide their locations on the map
Swamps: (A) , Beaver Meadow Swamp (B) . Display/hide their locations on the map
Streams, rivers, and creeks: (A) , Freshour Creek (B) , Rocky Run (C) , Black Creek (D) , Black Brook (E) . Display/hide their locations on the map
Park in zip code 14548: (1) . Display/hide its location on the map
Year house built (houses)
0 2020 or later83 2010 to 2019173 2000 to 2009168 1990 to 1999251 1980 to 1989209 1970 to 197974 1960 to 1969131 1950 to 195952 1940 to 1949669 1939 or earlier
Zip code 14548 household income distribution in 2022 79 Less than $10,00027 $10,000 to $14,99936 $15,000 to $19,99962 $20,000 to $24,99959 $25,000 to $29,99942 $30,000 to $34,99987 $35,000 to $39,99947 $40,000 to $44,99948 $45,000 to $49,999144 $50,000 to $59,999275 $60,000 to $74,999274 $75,000 to $99,999236 $100,000 to $124,999137 $125,000 to $149,999122 $150,000 to $199,99984 $200,000 or moreEstimate of home value of owner-occupied houses/condos in 2022 in zip code 14548 80 Less than $10,00039 $10,000 to $14,99976 $15,000 to $19,9993 $20,000 to $24,99910 $35,000 to $39,99913 $40,000 to $49,99972 $50,000 to $59,99967 $60,000 to $69,99951 $70,000 to $79,99944 $80,000 to $89,99948 $90,000 to $99,99994 $100,000 to $124,999124 $125,000 to $149,999201 $150,000 to $174,999118 $175,000 to $199,999107 $200,000 to $249,999110 $250,000 to $299,99946 $300,000 to $399,9995 $750,000 to $999,9991 $1,000,000 to $1,499,999Rent paid by renters in 2022 in zip code 14548 4 $250 to $2997 $300 to $34915 $350 to $39914 $400 to $44922 $500 to $5492 $550 to $59918 $600 to $64956 $650 to $69933 $700 to $74932 $750 to $799129 $800 to $89953 $1,000 to $1,2496 $1,250 to $1,4996 No cash rent
Median gross rent in 2022: $880.
Estimated median house (or condo) value in 2022 for: White Non-Hispanic householders: $149,327Asian householders: $383,985Two or more races householders: $124,581Hispanic or Latino householders: $122,363Estimated median house or condo value in 2022: $142,501
14548:
$142,501New York:
$400,400
Lower value quartile - upper value quartile: $75,612 - $189,875
Mean price in 2022: Detached houses: $190,327Here:
$190,327State:
$476,719
In 2-unit structures: $698,890Here:
$698,890State:
$713,077
Mobile homes: $39,474Here:
$39,474State:
$88,925
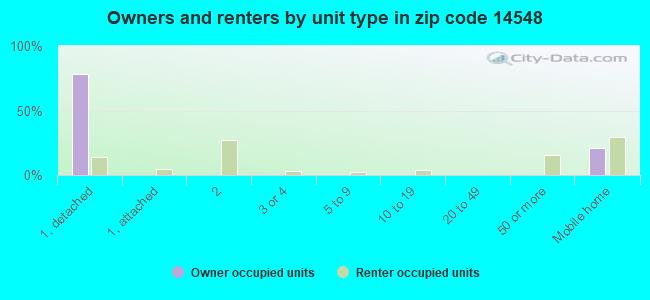
Housing units in structures:
One, detached: 1,117One, attached: 17Two: 1023 or 4: 315 to 9: 810 to 19: 1550 or more: 59Mobile homes: 459Unemployment : 1.3%
Means of transportation to work in zip code 14548 70.5% 1,577 Drove a car alone10.2% 229 Carpooled3.6% 81 Ferryboat0.1% 3 Motorcycle1.4% 32 Walked1.3% 30 Other means14.4% 322 Worked at homeTravel time to work (commute) in zip code 14548 178 Less than 5 minutes196 5 to 9 minutes234 10 to 14 minutes160 15 to 19 minutes279 20 to 24 minutes184 25 to 29 minutes176 30 to 34 minutes142 35 to 39 minutes118 40 to 44 minutes58 45 to 59 minutes78 60 to 89 minutes107 90 or more minutes
Percentage of zip code residents living and working in this county: 73.4%
Household type by relationship:
Households: 3,977
Male householders: 791 (264 living alone ), Female householders: 974 (176 living alone )853 spouses (853 opposite-sex spouses ), 274 unmarried partners , (274 opposite-sex unmarried partners ), 744 children (711 natural , 6 adopted , 27 stepchildren ), 24 grandchildren , 21 brothers or sisters , 76 parents , 2 foster children , 42 other relatives , 198 non-relatives In group quarters: 8 (-1 institutionalized population )
Size of family households: 634 2-persons , 288 3-persons , 89 4-persons , 87 5-persons , 6 6-persons , 5 7-or-more-persons
Size of nonfamily households: 441 1-person , 146 2-persons , 75 4-persons
398 married couples with children. single-parent households (16 men , 147 women ).
94.0% of residents of 14548 zip code speak English at home. of residents speak Spanish at home (81% very well, 19% well ).of residents speak other Indo-European language at home (100% very well ).of residents speak Asian or Pacific Island language at home (100% well ).of residents speak other language at home (100% very well ).
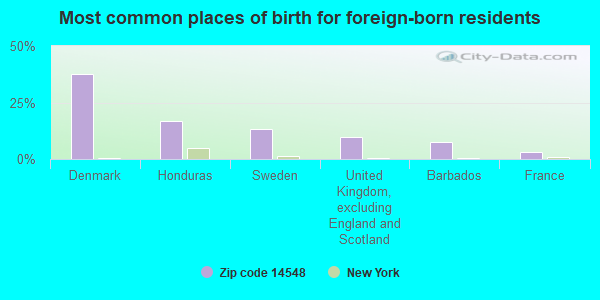
Foreign born population: 136 (3.4%)
(65.0%
of them are naturalized citizens )
This zip code:
3.4%Whole state:
22.7%
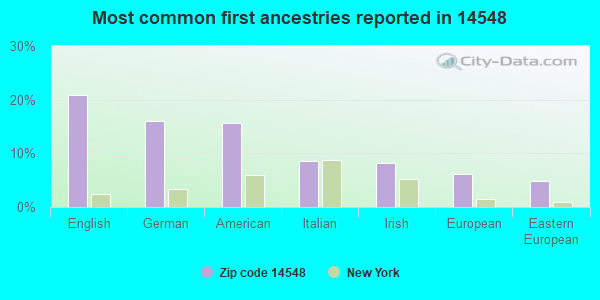
38% Denmark 17% Honduras 13% Sweden 10% United Kingdom, excluding England and Scotland 7% Barbados 3% France 21% English 16% German 16% American 9% Italian 8% Irish 6% European 5% Eastern European
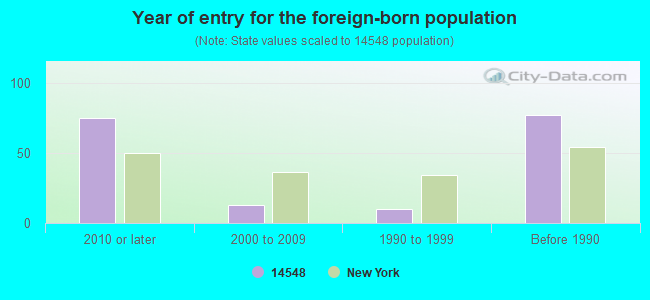
Year of entry for the foreign-born population
75 2010 or later 13 2000 to 2009 10 1990 to 1999 77 Before 1990
Facilities with environmental interests located in this zip code:
GREAT LAKES KRAUT CO LLC (11 CLARK STREET in SHORTSVILLE, NY)
National Pollutant Discharge Elimination System NON-MAJOR (Tracking pollutant discharge elimination systems) - permit Small Quantity Generators, between 100 kg and 1000 kg of hazardous waste/month (Resource Conservation and Recovery Act (tracking hazardous waste)) - notification Business SIC classification: CANNED FRUITS, VEGETABLES, PRESERVES, JAMS, AND JELLIESAlternative names: GREAT LAKES KRAUT COMPANY, GREAT LAKES KRAUT-SHORTSVILLE
BILL'S AUTO SERVICE CENTER (1307 COUNTY RD 8 in SHORTSVILLE, NY)
(Resource Conservation and Recovery Act (tracking hazardous waste))
Housing units lacking complete plumbing facilities: 1.4%
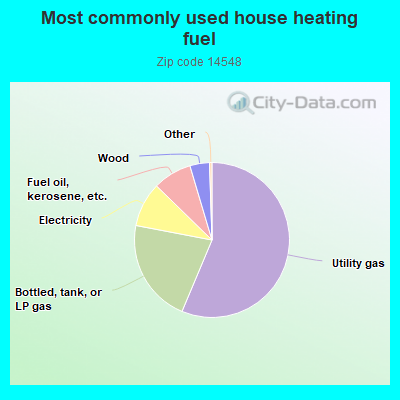
56.4% Utility gas 21.7% Bottled, tank, or LP gas 9.3% Electricity 8.1% Fuel oil, kerosene, etc. 4.1% Wood
Population in 1990: 4,524.
Place of birth for U.S.-born residents:
This state: 3,185Northeast: 312Midwest: 98South: 146West: 53
68% of the 14548 zip code residents lived in the same house 5 years ago.
Out of people who lived in different houses, 59% lived in this county.
Out of people who lived in different counties, 50% lived in New York.
93% of the 14548 zip code residents lived in the same house 1 year ago.
Out of people who lived in different houses, 48% moved from this county.
Out of people who lived in different houses, 43% moved from different county within same state.
Out of people who lived in different houses, 8% moved from different state.
Private vs. public school enrollment:
Students in private schools in grades 1 to 8 (elementary and middle school): 6
Students in private schools in grades 9 to 12 (high school):
Students in private undergraduate colleges: 10
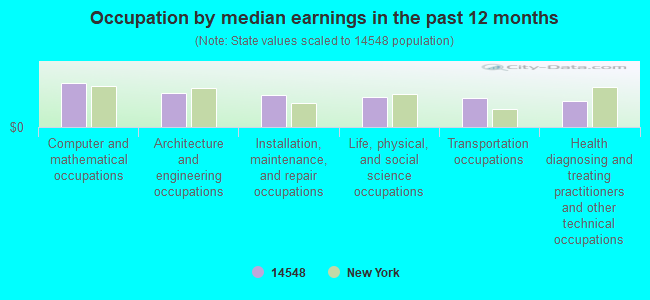
Occupation by median earnings in the past 12 months ($)
111,051 Computer and mathematical occupations 84,969 Architecture and engineering occupations 80,728 Installation, maintenance, and repair occupations 74,541 Life, physical, and social science occupations 74,359 Transportation occupations 65,193 Health diagnosing and treating practitioners and other technical occupations
Top industries in this zip code by the number of employees in 2005:
Construction: Plumbing, Heating, and Air-Conditioning Contractors (10-19 employees: 1 establishment, 5-9 employees: 1 establishment, 1-4 employees: 1 establishment)Other Services (except Public Administration): General Automotive Repair (10-19: 1, 1-4: 3)Accommodation and Food Services: Limited-Service Restaurants (10-19: 1, 1-4: 1)Finance and Insurance: Direct Property and Casualty Insurance Carriers (10-19: 1)Administrative and Support and Waste Management and Remediation Services: Exterminating and Pest Control Services (10-19: 1)Other Services (except Public Administration): Religious Organizations (5-9: 2)Accommodation and Food Services: Full-Service Restaurants (5-9: 1, 1-4: 2)Administrative and Support and Waste Management and Remediation Services: Landscaping Services (1-4: 5)
People in group quarters in 2010:
6 people in group homes intended for adults
People in group quarters in 2000:
29 people in other noninstitutional group quarters
6 people in homes for the mentally retarded
Fatal accident statistics in 2014:
Fatal accident count: 1Vehicles involved in fatal accidents: 4Fatal accidents caused by drunken drivers: 0Fatalities: 1Persons involved in fatal accidents: 6Pedestrians involved in fatal accidents: 0
Fatal accident statistics in 2012:
Fatal accident count: 2Vehicles involved in fatal accidents: 4Fatal accidents caused by drunken drivers: 0Fatalities: 2Persons involved in fatal accidents: 4Pedestrians involved in fatal accidents: 1
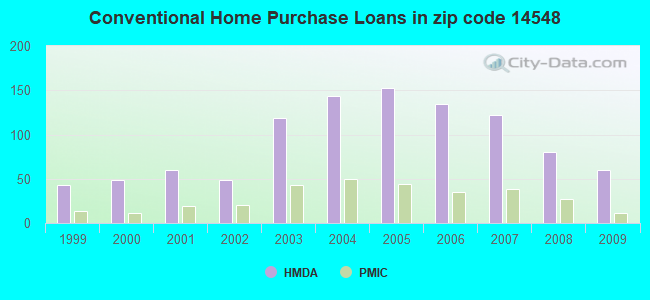
Home Mortgage Disclosure Act Aggregated Statistics For Year 2009(Based on 8 partial tracts) A) FHA, FSA/RHS & VA B) Conventional C) Refinancings D) Home Improvement Loans F) Non-occupant Loans on G) Loans On Manufactured Number Average Value Number Average Value Number Average Value Number Average Value Number Average Value Number Average Value
LOANS ORIGINATED 57 $117,056 60 $111,611 146 $108,303 53 $24,454 4 $95,010 18 $36,903 APPLICATIONS APPROVED, NOT ACCEPTED 3 $137,710 7 $85,687 12 $77,252 3 $48,177 0 $0 5 $46,072 APPLICATIONS DENIED 18 $110,752 11 $80,503 60 $102,687 23 $21,536 4 $83,765 18 $40,829 APPLICATIONS WITHDRAWN 3 $147,417 8 $136,094 30 $118,493 3 $21,627 1 $108,220 2 $46,075 FILES CLOSED FOR INCOMPLETENESS 3 $120,903 1 $82,350 12 $115,686 1 $6,010 0 $0 1 $77,550
Aggregated Statistics For Year 2008(Based on 8 partial tracts) A) FHA, FSA/RHS & VA B) Conventional C) Refinancings D) Home Improvement Loans E) Loans on Dwellings For 5+ Families F) Non-occupant Loans on G) Loans On Manufactured Number Average Value Number Average Value Number Average Value Number Average Value Number Average Value Number Average Value Number Average Value
LOANS ORIGINATED 34 $117,674 80 $121,273 75 $93,543 64 $22,456 1 $73,950 5 $72,972 12 $31,568 APPLICATIONS APPROVED, NOT ACCEPTED 3 $129,770 12 $74,733 10 $86,574 8 $36,215 0 $0 0 $0 7 $51,437 APPLICATIONS DENIED 11 $103,605 19 $88,191 86 $119,740 52 $20,958 0 $0 3 $53,560 20 $43,457 APPLICATIONS WITHDRAWN 4 $76,265 7 $183,813 37 $119,746 10 $126,114 0 $0 1 $45,090 1 $18,750 FILES CLOSED FOR INCOMPLETENESS 1 $51,170 3 $57,617 8 $122,892 2 $24,405 0 $0 0 $0 1 $9,580
Aggregated Statistics For Year 2007(Based on 8 partial tracts) A) FHA, FSA/RHS & VA B) Conventional C) Refinancings D) Home Improvement Loans F) Non-occupant Loans on G) Loans On Manufactured Number Average Value Number Average Value Number Average Value Number Average Value Number Average Value Number Average Value
LOANS ORIGINATED 35 $121,125 122 $92,346 106 $90,269 84 $21,593 13 $70,880 31 $38,269 APPLICATIONS APPROVED, NOT ACCEPTED 4 $83,140 24 $78,030 23 $104,032 14 $27,762 1 $51,580 14 $54,534 APPLICATIONS DENIED 11 $85,545 46 $72,871 147 $97,878 64 $32,853 12 $67,069 42 $44,349 APPLICATIONS WITHDRAWN 2 $126,895 21 $75,917 65 $105,227 6 $46,367 2 $157,855 6 $54,123 FILES CLOSED FOR INCOMPLETENESS 0 $0 3 $127,470 12 $98,995 3 $26,997 1 $69,590 0 $0
Aggregated Statistics For Year 2006(Based on 8 partial tracts) A) FHA, FSA/RHS & VA B) Conventional C) Refinancings D) Home Improvement Loans E) Loans on Dwellings For 5+ Families F) Non-occupant Loans on G) Loans On Manufactured Number Average Value Number Average Value Number Average Value Number Average Value Number Average Value Number Average Value Number Average Value
LOANS ORIGINATED 29 $102,867 135 $90,173 156 $84,650 83 $19,903 0 $0 13 $102,082 23 $40,267 APPLICATIONS APPROVED, NOT ACCEPTED 3 $72,150 27 $69,850 30 $86,068 7 $47,246 0 $0 4 $62,585 14 $45,542 APPLICATIONS DENIED 4 $94,348 37 $55,908 142 $95,351 55 $24,425 0 $0 6 $96,688 27 $33,610 APPLICATIONS WITHDRAWN 2 $99,965 8 $73,834 94 $96,542 12 $65,771 1 $47,490 0 $0 3 $69,563 FILES CLOSED FOR INCOMPLETENESS 0 $0 9 $70,599 30 $108,551 1 $54,670 0 $0 1 $150,400 0 $0
Aggregated Statistics For Year 2005(Based on 8 partial tracts) A) FHA, FSA/RHS & VA B) Conventional C) Refinancings D) Home Improvement Loans F) Non-occupant Loans on G) Loans On Manufactured Number Average Value Number Average Value Number Average Value Number Average Value Number Average Value Number Average Value
LOANS ORIGINATED 30 $111,032 153 $89,138 131 $86,736 67 $16,834 17 $81,841 24 $34,090 APPLICATIONS APPROVED, NOT ACCEPTED 3 $90,487 24 $65,545 28 $87,865 9 $23,439 2 $86,610 12 $49,312 APPLICATIONS DENIED 6 $84,430 43 $61,865 182 $95,344 59 $25,934 8 $59,070 40 $50,313 APPLICATIONS WITHDRAWN 1 $116,590 15 $105,640 124 $95,000 19 $73,085 4 $101,890 7 $58,976 FILES CLOSED FOR INCOMPLETENESS 0 $0 5 $116,086 33 $117,239 3 $21,013 1 $82,980 0 $0
Aggregated Statistics For Year 2004(Based on 8 partial tracts) A) FHA, FSA/RHS & VA B) Conventional C) Refinancings D) Home Improvement Loans E) Loans on Dwellings For 5+ Families F) Non-occupant Loans on G) Loans On Manufactured Number Average Value Number Average Value Number Average Value Number Average Value Number Average Value Number Average Value Number Average Value
LOANS ORIGINATED 31 $98,406 144 $83,258 197 $83,709 62 $20,854 1 $16,550 9 $66,087 39 $32,582 APPLICATIONS APPROVED, NOT ACCEPTED 3 $125,547 23 $61,733 32 $87,938 9 $44,450 0 $0 2 $91,770 16 $47,191 APPLICATIONS DENIED 8 $92,094 47 $61,055 180 $87,298 46 $24,042 0 $0 9 $53,402 47 $34,014 APPLICATIONS WITHDRAWN 4 $94,452 13 $89,591 129 $94,514 17 $29,454 0 $0 1 $36,070 6 $72,797 FILES CLOSED FOR INCOMPLETENESS 1 $55,910 3 $94,517 31 $98,347 4 $164,015 0 $0 2 $88,450 0 $0
Aggregated Statistics For Year 2003(Based on 8 partial tracts) A) FHA, FSA/RHS & VA B) Conventional C) Refinancings D) Home Improvement Loans F) Non-occupant Loans on Number Average Value Number Average Value Number Average Value Number Average Value Number Average Value
LOANS ORIGINATED 26 $96,918 119 $87,237 339 $82,865 48 $11,559 9 $61,248 APPLICATIONS APPROVED, NOT ACCEPTED 1 $151,140 28 $61,783 46 $81,329 8 $14,719 1 $33,170 APPLICATIONS DENIED 5 $85,300 34 $46,249 181 $87,577 36 $18,432 2 $43,195 APPLICATIONS WITHDRAWN 3 $72,460 12 $85,298 113 $88,233 8 $20,261 1 $207,450 FILES CLOSED FOR INCOMPLETENESS 1 $37,270 6 $67,415 11 $86,027 2 $23,205 0 $0
Aggregated Statistics For Year 2002(Based on 4 partial tracts) A) FHA, FSA/RHS & VA B) Conventional C) Refinancings D) Home Improvement Loans F) Non-occupant Loans on Number Average Value Number Average Value Number Average Value Number Average Value Number Average Value
LOANS ORIGINATED 16 $100,474 49 $108,777 104 $93,857 16 $12,898 3 $74,430 APPLICATIONS APPROVED, NOT ACCEPTED 0 $0 8 $78,679 15 $88,453 5 $27,152 1 $58,490 APPLICATIONS DENIED 3 $135,897 15 $77,715 48 $84,627 9 $27,909 0 $0 APPLICATIONS WITHDRAWN 2 $101,825 3 $131,837 41 $107,122 1 $8,710 1 $43,970 FILES CLOSED FOR INCOMPLETENESS 0 $0 1 $156,990 9 $87,369 0 $0 0 $0
Aggregated Statistics For Year 2001(Based on 4 partial tracts) A) FHA, FSA/RHS & VA B) Conventional C) Refinancings D) Home Improvement Loans F) Non-occupant Loans on Number Average Value Number Average Value Number Average Value Number Average Value Number Average Value
LOANS ORIGINATED 18 $99,941 60 $87,326 85 $85,989 18 $10,530 1 $138,530 APPLICATIONS APPROVED, NOT ACCEPTED 0 $0 6 $61,350 11 $83,356 2 $13,825 0 $0 APPLICATIONS DENIED 2 $125,625 15 $48,411 44 $73,568 18 $8,899 1 $24,260 APPLICATIONS WITHDRAWN 0 $0 4 $101,505 42 $92,987 3 $15,233 0 $0 FILES CLOSED FOR INCOMPLETENESS 0 $0 1 $91,000 5 $76,504 0 $0 0 $0
Aggregated Statistics For Year 2000(Based on 4 partial tracts) A) FHA, FSA/RHS & VA B) Conventional C) Refinancings D) Home Improvement Loans F) Non-occupant Loans on Number Average Value Number Average Value Number Average Value Number Average Value Number Average Value
LOANS ORIGINATED 23 $94,273 49 $74,361 27 $53,123 21 $11,321 1 $61,260 APPLICATIONS APPROVED, NOT ACCEPTED 1 $50,130 9 $56,104 7 $71,904 7 $22,173 0 $0 APPLICATIONS DENIED 3 $69,160 21 $33,125 30 $58,735 16 $14,193 1 $48,050 APPLICATIONS WITHDRAWN 3 $52,137 3 $58,093 12 $58,280 3 $29,503 1 $64,420 FILES CLOSED FOR INCOMPLETENESS 0 $0 0 $0 7 $67,151 0 $0 0 $0
Aggregated Statistics For Year 1999(Based on 3 partial tracts) A) FHA, FSA/RHS & VA B) Conventional C) Refinancings D) Home Improvement Loans F) Non-occupant Loans on Number Average Value Number Average Value Number Average Value Number Average Value Number Average Value
LOANS ORIGINATED 18 $85,336 43 $64,922 79 $63,685 42 $16,339 2 $51,830 APPLICATIONS APPROVED, NOT ACCEPTED 1 $65,200 15 $57,571 17 $63,242 7 $15,314 2 $66,310 APPLICATIONS DENIED 1 $108,500 49 $39,358 45 $58,134 21 $13,838 2 $37,830 APPLICATIONS WITHDRAWN 2 $67,220 4 $59,072 31 $60,645 5 $38,014 0 $0 FILES CLOSED FOR INCOMPLETENESS 1 $24,320 2 $88,970 5 $57,484 0 $0 1 $53,120
Detailed HMDA statistics for the following Tracts:
0502.01
,
0502.02 ,
0503.01 ,
0503.02
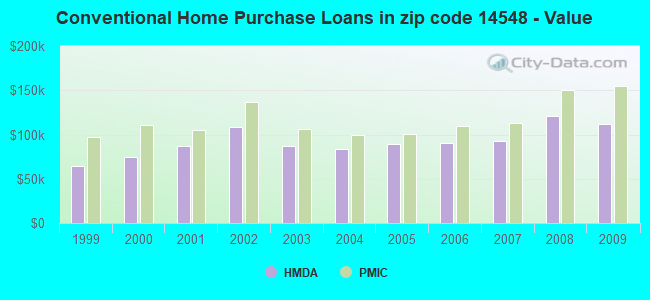
Private Mortgage Insurance Companies Aggregated Statistics For Year 2009(Based on 8 partial tracts) A) Conventional B) Refinancings Number Average Value Number Average Value
LOANS ORIGINATED 11 $155,351 14 $144,209 APPLICATIONS APPROVED, NOT ACCEPTED 5 $213,388 2 $96,135 APPLICATIONS DENIED 2 $250,050 1 $139,520 APPLICATIONS WITHDRAWN 0 $0 1 $131,650 FILES CLOSED FOR INCOMPLETENESS 0 $0 0 $0
Aggregated Statistics For Year 2008(Based on 8 partial tracts) A) Conventional B) Refinancings C) Non-occupant Loans on D) Loans On Manufactured Number Average Value Number Average Value Number Average Value Number Average Value
LOANS ORIGINATED 27 $150,248 7 $128,500 2 $110,125 1 $42,690 APPLICATIONS APPROVED, NOT ACCEPTED 7 $163,870 4 $136,688 0 $0 0 $0 APPLICATIONS DENIED 2 $85,635 1 $119,040 0 $0 0 $0 APPLICATIONS WITHDRAWN 0 $0 0 $0 0 $0 0 $0 FILES CLOSED FOR INCOMPLETENESS 0 $0 1 $42,080 0 $0 0 $0
Aggregated Statistics For Year 2007(Based on 8 partial tracts) A) Conventional B) Refinancings C) Non-occupant Loans on D) Loans On Manufactured Number Average Value Number Average Value Number Average Value Number Average Value
LOANS ORIGINATED 38 $113,405 18 $108,037 1 $53,510 2 $119,695 APPLICATIONS APPROVED, NOT ACCEPTED 5 $117,118 3 $109,610 0 $0 0 $0 APPLICATIONS DENIED 2 $73,665 0 $0 0 $0 0 $0 APPLICATIONS WITHDRAWN 3 $79,787 1 $100,590 0 $0 1 $42,690 FILES CLOSED FOR INCOMPLETENESS 0 $0 0 $0 0 $0 0 $0
Aggregated Statistics For Year 2006(Based on 8 partial tracts) A) Conventional B) Refinancings C) Non-occupant Loans on Number Average Value Number Average Value Number Average Value
LOANS ORIGINATED 35 $109,164 16 $124,356 1 $92,100 APPLICATIONS APPROVED, NOT ACCEPTED 5 $117,292 1 $100,230 0 $0 APPLICATIONS DENIED 0 $0 1 $107,610 1 $107,610 APPLICATIONS WITHDRAWN 1 $139,170 1 $129,600 0 $0 FILES CLOSED FOR INCOMPLETENESS 0 $0 0 $0 0 $0
Aggregated Statistics For Year 2005(Based on 8 partial tracts) A) Conventional B) Refinancings C) Non-occupant Loans on Number Average Value Number Average Value Number Average Value
LOANS ORIGINATED 44 $100,628 13 $120,184 2 $73,360 APPLICATIONS APPROVED, NOT ACCEPTED 4 $88,658 5 $127,138 0 $0 APPLICATIONS DENIED 2 $66,820 0 $0 1 $83,840 APPLICATIONS WITHDRAWN 1 $77,220 3 $92,880 0 $0 FILES CLOSED FOR INCOMPLETENESS 0 $0 0 $0 0 $0
Aggregated Statistics For Year 2004(Based on 8 partial tracts) A) Conventional B) Refinancings C) Non-occupant Loans on D) Loans On Manufactured Number Average Value Number Average Value Number Average Value Number Average Value
LOANS ORIGINATED 50 $99,537 28 $94,629 4 $69,172 1 $98,180 APPLICATIONS APPROVED, NOT ACCEPTED 5 $99,588 8 $90,954 1 $70,490 0 $0 APPLICATIONS DENIED 1 $51,070 0 $0 0 $0 0 $0 APPLICATIONS WITHDRAWN 1 $48,650 0 $0 0 $0 0 $0 FILES CLOSED FOR INCOMPLETENESS 0 $0 0 $0 0 $0 0 $0
Aggregated Statistics For Year 2003(Based on 8 partial tracts) A) Conventional B) Refinancings C) Non-occupant Loans on Number Average Value Number Average Value Number Average Value
LOANS ORIGINATED 43 $106,520 63 $103,479 1 $49,800 APPLICATIONS APPROVED, NOT ACCEPTED 4 $107,552 10 $115,952 1 $75,100 APPLICATIONS DENIED 0 $0 1 $123,210 0 $0 APPLICATIONS WITHDRAWN 0 $0 1 $49,300 0 $0 FILES CLOSED FOR INCOMPLETENESS 0 $0 0 $0 0 $0
Aggregated Statistics For Year 2002(Based on 4 partial tracts) A) Conventional B) Refinancings C) Non-occupant Loans on Number Average Value Number Average Value Number Average Value
LOANS ORIGINATED 20 $137,286 17 $111,132 1 $162,300 APPLICATIONS APPROVED, NOT ACCEPTED 4 $145,912 5 $107,470 1 $128,960 APPLICATIONS DENIED 0 $0 1 $95,760 0 $0 APPLICATIONS WITHDRAWN 0 $0 0 $0 0 $0 FILES CLOSED FOR INCOMPLETENESS 0 $0 0 $0 0 $0
Aggregated Statistics For Year 2001(Based on 4 partial tracts) A) Conventional B) Refinancings Number Average Value Number Average Value
LOANS ORIGINATED 19 $105,031 10 $107,956 APPLICATIONS APPROVED, NOT ACCEPTED 0 $0 1 $120,380 APPLICATIONS DENIED 0 $0 0 $0 APPLICATIONS WITHDRAWN 0 $0 0 $0 FILES CLOSED FOR INCOMPLETENESS 0 $0 0 $0
Aggregated Statistics For Year 2000(Based on 4 partial tracts) A) Conventional B) Refinancings Number Average Value Number Average Value
LOANS ORIGINATED 11 $111,163 0 $0 APPLICATIONS APPROVED, NOT ACCEPTED 1 $101,010 2 $98,950 APPLICATIONS DENIED 2 $89,355 0 $0 APPLICATIONS WITHDRAWN 0 $0 0 $0 FILES CLOSED FOR INCOMPLETENESS 0 $0 0 $0
Aggregated Statistics For Year 1999(Based on 3 partial tracts) A) Conventional B) Refinancings Number Average Value Number Average Value
LOANS ORIGINATED 13 $97,336 5 $86,618 APPLICATIONS APPROVED, NOT ACCEPTED 1 $74,040 2 $83,825 APPLICATIONS DENIED 1 $84,640 0 $0 APPLICATIONS WITHDRAWN 0 $0 0 $0 FILES CLOSED FOR INCOMPLETENESS 0 $0 0 $0
Detailed PMIC statistics for the following Tracts:
0502.01
,
0502.02 ,
0503.01 ,
0503.02
2002 - 2018 National Fire Incident Reporting System (NFIRS) incidents See full 2006 National Fire Incident Reporting System statistics for zip code 14548, New York
Most common first names in zip code 14548 among deceased individuals Name Count Lived (average)
Mary 33 78.8 years John 24 76.5 years George 23 72.8 years Margaret 21 81.8 years William 21 74.4 years Robert 20 68.9 years Elizabeth 18 79.3 years Charles 15 69.8 years Richard 13 68.5 years James 13 66.8 years
Most common last names in zip code 14548 among deceased individuals Last name Count Lived (average)
Whittaker 12 73.9 years Johnson 10 70.7 years Holtz 8 73.2 years Clark 8 81.5 years Brown 8 75.4 years Herendeen 7 74.0 years Draper 6 87.5 years Romeiser 6 72.8 years Bailey 5 73.6 years Barry 5 81.0 years


 Nearest zip codes: 14504, 14522, 14425, 14537, 14432, 14424.
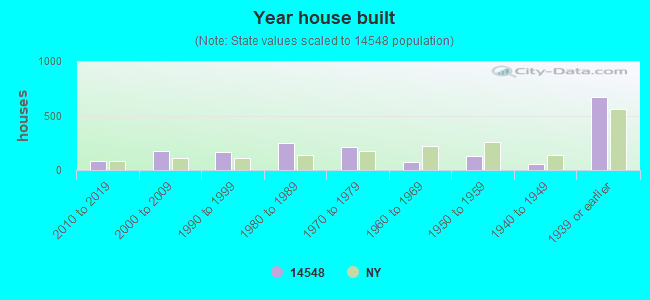


 According to the data from the years 2002 - 2018 the average number of fire incidents per year is 21. The highest number of fire incidents - 49 took place in 2007, and the least - 1 in 2003. The data has a decreasing trend.
 When looking into fire subcategories, the most reports belonged to: Outside Fires (42.4%), and Structure Fires (38.5%).