Estimated zip code population in 2022: 9,423 Zip code population in 2010: 9,565 Zip code population in 2000: 8,766
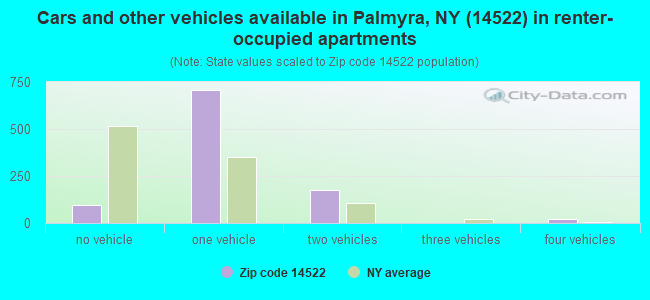
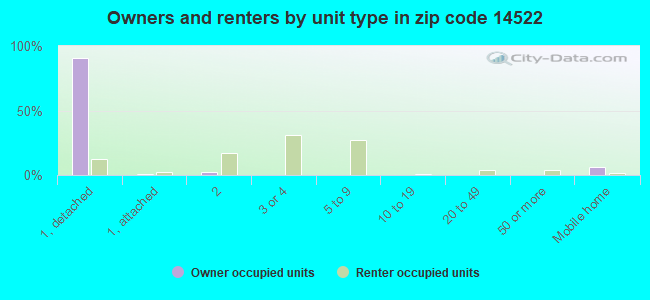
Houses and condos: 4,514 Renter-occupied apartments: 993
% of renters here:
24%
State:
46%
March 2022 cost of living index in zip code 14522: 100.9 (near average, U.S. average is 100)
Land area: 46.8 sq. mi. Water area: 0.1 sq. mi.
Population density: 201 people per square mile
(very low).
OSM Map
General Map
Google Map
MSN Map
OSM Map
General Map
Google Map
MSN Map
OSM Map
General Map
Google Map
MSN Map
OSM Map
General Map
Google Map
MSN Map
Please wait while loading the map...
Real estate property taxes paid for housing units in 2022:
This zip code:
3.1% ($4,594)
New York:
1.5% ($6,180)
Median real estate property taxes paid for housing units with mortgages in 2022: $4,830 (3.0%) Median real estate property taxes paid for housing units with no mortgage in 2022: $3,732 (2.9%)
Business Search- 14 Million verified businesses
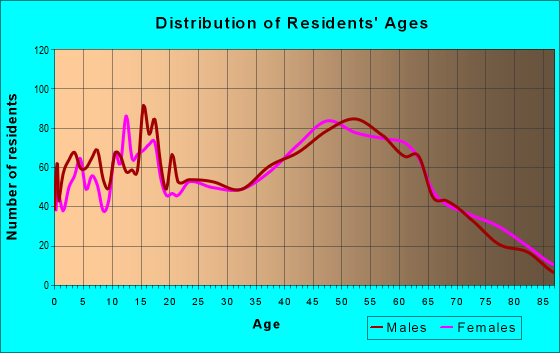
Males: 4,892
(51.9%)
Females: 4,530
(48.1%)
For population 25 years and over in 14522:
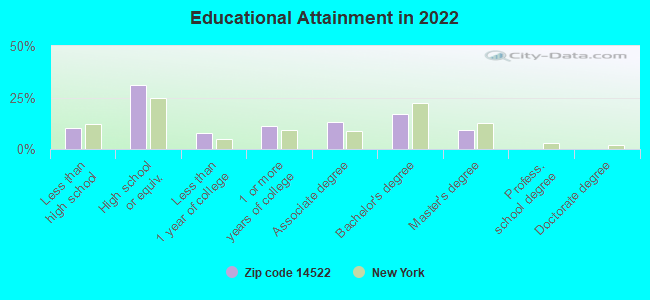
High school or higher: 89.4%
Bachelor's degree or higher: 26.4%
Graduate or professional degree: 9.3%
Unemployed: 1.5%
Mean travel time to work (commute): 23.4 minutes
For population 15 years and over in 14522:
Never married: 24.3%
Now married: 59.4%
Separated: 0.6%
Widowed: 5.0%
Divorced: 10.6%
Zip code 14522 compared to state average:
Median house value significantly below state average.
Unemployed percentage significantly below state average.
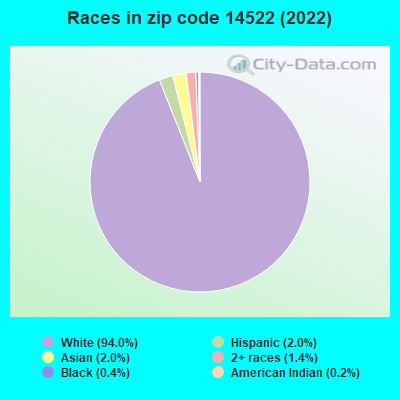
Black race population percentage significantly below state average.
Hispanic race population percentage significantly below state average.
Median age significantly above state average.
Foreign-born population percentage significantly below state average.
Renting percentage below state average.
Length of stay since moving in significantly above state average.
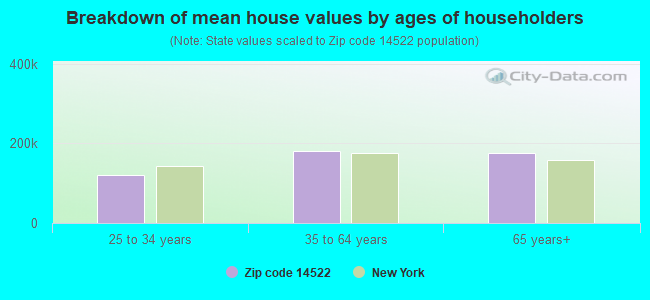
Estimated median house/condo value in 2022: $147,192
14522:
$147,192
New York:
$400,400
According to our research of New York and other state lists, there were 11 registered sex offenders living in 14522 zip code as of April 27, 2024. The ratio of all residents to sex offenders in zip code 14522 is 851 to 1. The ratio of registered sex offenders to all residents in this zip code is near the state average.
Median resident age:
This zip code:
48.7 years
New York median age:
40.0 years
Average household size:
This zip code:
2.2 people
New York:
2.5 people
Averages for the 2020 tax year for zip code 14522, filed in 2021:
Average Adjusted Gross Income (AGI) in 2020: $56,749 (Individual Income Tax Returns)
Here:
$56,749
State:
$90,930
Salary/wage: $48,482 (reported on 82.8% of returns)
Here:
$48,482
State:
$72,104
(% of AGI for various income ranges: 1148.1% for AGIs below $25k, 3463.8% for AGIs $25k-50k, 6446.4% for AGIs $50k-75k, 9161.9% for AGIs $75k-100k, 17420.3% for AGIs $100k-200k, 52976.7% for AGIs over 200k)
Taxable interest for individuals: $545 (reported on 38.6% of returns)
This zip code:
$545
New York:
$3,075
(% of AGI for various income ranges: 13.3% for AGIs below $25k, 14.7% for AGIs $25k-50k, 28.7% for AGIs $50k-75k, 41.9% for AGIs $75k-100k, 90.3% for AGIs $100k-200k, 330.0% for AGIs over 200k)
Ordinary dividends: $2,803 (reported on 17.2% of returns)
Here:
$2,803
State:
$11,095
(% of AGI for various income ranges: 31.8% for AGIs below $25k, 27.2% for AGIs $25k-50k, 60.9% for AGIs $50k-75k, 121.2% for AGIs $75k-100k, 191.9% for AGIs $100k-200k, 913.3% for AGIs over 200k)
Net capital gain/loss in AGI: +$7,106 (reported on 14.1% of returns)
Here:
+$7,106
State:
+$44,925
(% of AGI for various income ranges: 14.9% for AGIs below $25k, 27.7% for AGIs $25k-50k, 82.6% for AGIs $50k-75k, 182.2% for AGIs $75k-100k, 430.6% for AGIs $100k-200k, 5826.7% for AGIs over 200k)
Profit/loss from business: +$14,629 (reported on 10.6% of returns)
Here:
+$14,629
State:
+$14,940
(% of AGI for various income ranges: 68.0% for AGIs below $25k, 90.1% for AGIs $25k-50k, 238.7% for AGIs $50k-75k, 236.6% for AGIs $75k-100k, 356.8% for AGIs $100k-200k, 7523.3% for AGIs over 200k)
Taxable individual retirement arrangement distribution: $17,924 (reported on 11.9% of returns)
14522:
$17,924
New York:
$19,609
(% of AGI for various income ranges: 89.9% for AGIs below $25k, 150.3% for AGIs $25k-50k, 310.6% for AGIs $50k-75k, 508.8% for AGIs $75k-100k, 1260.3% for AGIs $100k-200k)
Total itemized deductions: $24,312 (reported on 3.5% of returns)
Here:
$24,312
State:
$39,326
(% of AGI for various income ranges: 75.8% for AGIs $25k-50k, 147.7% for AGIs $50k-75k, 279.4% for AGIs $75k-100k, 245.2% for AGIs $100k-200k, 2140.0% for AGIs over 200k)
Charity contributions: $7,010 (reported on 2.2% of returns)
Here:
$7,010
State:
$15,420
(% of AGI for various income ranges: 5.6% for AGIs $25k-50k, 45.7% for AGIs $50k-75k, 64.5% for AGIs $100k-200k, 663.3% for AGIs over 200k)
Taxes paid: $8,575 (reported on 3.5% of returns)
14522:
$8,575
State:
$9,183
(% of AGI for various income ranges: 21.0% for AGIs $25k-50k, 65.1% for AGIs $50k-75k, 88.1% for AGIs $75k-100k, 104.8% for AGIs $100k-200k, 650.0% for AGIs over 200k)
Earned income credit: $2,131 (reported on 13.0% of returns)
Here:
$2,131
State:
$2,138
(% of AGI for various income ranges: 71.5% for AGIs below $25k, 51.3% for AGIs $25k-50k)
Percentage of individuals using paid preparers for their 2020 taxes: 96.0%
Here:
96%
State:
95%
(% for various income ranges: 94.9% for AGIs below $25k, 95.5% for AGIs $25k-50k, 95.9% for AGIs $50k-75k, 97.9% for AGIs $75k-100k, 98.1% for AGIs $100k-200k, 100.0% for AGIs over 200k)
Averages for the 2012 tax year for zip code 14522, filed in 2013:
Average Adjusted Gross Income (AGI) in 2012: $46,692 (Individual Income Tax Returns)
Here:
$46,692
State:
$77,088
Salary/wage: $41,167 (reported on 85.8% of returns)
Here:
$41,167
State:
$60,593
(% of AGI for various income ranges: 74.0% for AGIs below $25k, 81.0% for AGIs $25k-50k, 78.5% for AGIs $50k-75k, 75.6% for AGIs $75k-100k, 76.7% for AGIs $100k-200k, 53.4% for AGIs over 200k)
Taxable interest for individuals: $648 (reported on 40.1% of returns)
This zip code:
$648
New York:
$3,125
(% of AGI for various income ranges: 0.7% for AGIs below $25k, 0.5% for AGIs $25k-50k, 0.4% for AGIs $50k-75k, 0.4% for AGIs $75k-100k, 0.5% for AGIs $100k-200k, 1.3% for AGIs over 200k)
Ordinary dividends: $2,567 (reported on 19.4% of returns)
Here:
$2,567
State:
$10,299
(% of AGI for various income ranges: 1.6% for AGIs below $25k, 1.0% for AGIs $25k-50k, 0.9% for AGIs $50k-75k, 0.6% for AGIs $75k-100k, 1.0% for AGIs $100k-200k, 2.4% for AGIs over 200k)
Net capital gain/loss in AGI: +$4,031 (reported on 13.1% of returns)
Here:
+$4,031
State:
+$42,474
(% of AGI for various income ranges: 0.7% for AGIs $50k-75k, 0.6% for AGIs $75k-100k, 1.6% for AGIs $100k-200k, 6.6% for AGIs over 200k)
Profit/loss from business: +$11,700 (reported on 11.3% of returns)
Here:
+$11,700
State:
+$16,168
(% of AGI for various income ranges: 5.0% for AGIs below $25k, 2.0% for AGIs $25k-50k, 2.0% for AGIs $50k-75k, 1.7% for AGIs $75k-100k, 4.9% for AGIs $100k-200k)
Taxable individual retirement arrangement distribution: $13,674 (reported on 11.9% of returns)
14522:
$13,674
New York:
$17,621
(% of AGI for various income ranges: 3.3% for AGIs below $25k, 3.4% for AGIs $25k-50k, 3.8% for AGIs $50k-75k, 3.8% for AGIs $75k-100k, 4.3% for AGIs $100k-200k)
Total itemized deductions: $18,810 (21% of AGI, reported on 27.5% of returns)
Here:
$18,810
State:
$34,985
Here:
21.2% of AGI
State:
21.3% of AGI
(% of AGI for various income ranges: 7.3% for AGIs below $25k, 7.4% for AGIs $25k-50k, 10.0% for AGIs $50k-75k, 11.8% for AGIs $75k-100k, 15.0% for AGIs $100k-200k, 14.5% for AGIs over 200k)
Charity contributions: $2,632 (reported on 22.3% of returns)
Here:
$2,632
State:
$5,572
(% of AGI for various income ranges: 0.4% for AGIs below $25k, 0.7% for AGIs $25k-50k, 1.1% for AGIs $50k-75k, 1.3% for AGIs $75k-100k, 1.8% for AGIs $100k-200k, 2.5% for AGIs over 200k)
Taxes paid: $9,508 (reported on 27.5% of returns)
14522:
$9,508
State:
$18,656
(% of AGI for various income ranges: 2.2% for AGIs below $25k, 2.9% for AGIs $25k-50k, 4.5% for AGIs $50k-75k, 6.0% for AGIs $75k-100k, 8.6% for AGIs $100k-200k, 9.6% for AGIs over 200k)
Earned income credit: $2,064 (reported on 16.9% of returns)
Here:
$2,064
State:
$2,230
(% of AGI for various income ranges: 5.5% for AGIs below $25k, 0.9% for AGIs $25k-50k)
Percentage of individuals using paid preparers for their 2012 taxes: 50.9%
Here:
51%
State:
66%
(% for various income ranges: 45.0% for AGIs below $25k, 52.1% for AGIs $25k-50k, 57.1% for AGIs $50k-75k, 53.5% for AGIs $75k-100k, 55.0% for AGIs $100k-200k, 83.3% for AGIs over 200k)
Averages for the 2004 tax year for zip code 14522, filed in 2005:
Average Adjusted Gross Income (AGI) in 2004: $39,469 (Individual Income Tax Returns)
Here:
$39,469
State:
$59,519
Salary/wage: $36,627 (reported on 86.9% of returns)
Here:
$36,627
State:
$50,673
(% of AGI for various income ranges: 103.4% for AGIs below $10k, 74.9% for AGIs $10k-25k, 83.4% for AGIs $25k-50k, 83.5% for AGIs $50k-75k, 83.9% for AGIs $75k-100k, 72.0% for AGIs over 100k)
Taxable interest for individuals: $690 (reported on 55.4% of returns)
This zip code:
$690
New York:
$2,377
(% of AGI for various income ranges: 3.4% for AGIs below $10k, 1.7% for AGIs $10k-25k, 0.9% for AGIs $25k-50k, 0.9% for AGIs $50k-75k, 0.4% for AGIs $75k-100k, 0.9% for AGIs over 100k)
Taxable dividends: $1,736 (reported on 25.1% of returns)
Here:
$1,736
State:
$5,394
(% of AGI for various income ranges: 3.6% for AGIs below $10k, 1.2% for AGIs $10k-25k, 0.7% for AGIs $25k-50k, 0.8% for AGIs $50k-75k, 0.5% for AGIs $75k-100k, 2.1% for AGIs over 100k)
Net capital gain/loss: +$3,289 (reported on 17.7% of returns)
Here:
+$3,289
State:
+$23,581
(% of AGI for various income ranges: -2.8% for AGIs below $10k, 0.4% for AGIs $10k-25k, 0.5% for AGIs $25k-50k, 0.6% for AGIs $50k-75k, 1.2% for AGIs $75k-100k, 4.9% for AGIs over 100k)
Profit/loss from business: +$10,141 (reported on 12.4% of returns)
Here:
+$10,141
State:
+$13,809
(% of AGI for various income ranges: 3.3% for AGIs below $10k, 5.3% for AGIs $10k-25k, 2.6% for AGIs $25k-50k, 1.6% for AGIs $50k-75k, 2.7% for AGIs $75k-100k, 5.2% for AGIs over 100k)
IRA payment deduction: $2,783 (reported on 2.7% of returns)
14522:
$2,783
New York:
$3,115
(% of AGI for various income ranges: 0.3% for AGIs $10k-25k, 0.3% for AGIs $25k-50k, 0.2% for AGIs $50k-75k, 0.3% for AGIs $75k-100k)
Self-employed pension: $8,609 (reported on 0.5% of returns)
Here:
$8,609
New York:
$19,016
Total itemized deductions: $15,803 (22% of AGI, reported on 33.0% of returns)
Here:
$15,803
State:
$25,864
Here:
22.2% of AGI
State:
21.9% of AGI
(% of AGI for various income ranges: 6.6% for AGIs below $10k, 7.1% for AGIs $10k-25k, 10.6% for AGIs $25k-50k, 14.3% for AGIs $50k-75k, 16.1% for AGIs $75k-100k, 16.2% for AGIs over 100k)
Charity contributions deductions: $2,200 (3% of AGI, reported on 29.8% of returns)
Here:
$2,200
State:
$4,439
Here:
3.0% of AGI
State:
3.6% of AGI
(% of AGI for various income ranges: 0.5% for AGIs below $10k, 0.6% for AGIs $10k-25k, 1.0% for AGIs $25k-50k, 1.7% for AGIs $50k-75k, 1.9% for AGIs $75k-100k, 2.7% for AGIs over 100k)
Total tax: $4,813 (reported on 76.3% of returns)
14522:
$4,813
State:
$11,730
(% of AGI for various income ranges: 2.8% for AGIs below $10k, 4.3% for AGIs $10k-25k, 6.5% for AGIs $25k-50k, 8.2% for AGIs $50k-75k, 10.0% for AGIs $75k-100k, 16.3% for AGIs over 100k)
Earned income credit: $1,698 (reported on 13.9% of returns)
Here:
$1,698
State:
$1,757
Percentage of individuals using paid preparers for their 2004 taxes: 55.7%
Here:
56%
State:
67%
(% for various income ranges: 44.5% for AGIs below $10k, 55.6% for AGIs $10k-25k, 58.5% for AGIs $25k-50k, 60.9% for AGIs $50k-75k, 59.6% for AGIs $75k-100k, 61.7% for AGIs over 100k)
Likely homosexual households (counted as self-reported same-sex unmarried-partner households)
Lesbian couples: 1.1% of all households
Gay men: 0.0% of all households
Household received Food Stamps/SNAP in the past 12 months: 330 Household did not receive Food Stamps/SNAP in the past 12 months: 3,819
Women who had a birth in the past 12 months: 73 (72 now married, 0 unmarried) Women who did not have a birth in the past 12 months: 1,610 (785 now married, 816 unmarried)
Housing units in zip code 14522 with a mortgage: 1,745 (229 second mortgage, 231 both second mortgage and home equity loan) Houses without a mortgage: 182
Median monthly owner costs for units with a mortgage: $1,425 Median monthly owner costs for units without a mortgage: $616
Residents with income below the poverty level in 2022:
This zip code:
9.1%
Whole state:
14.3%
Residents with income below 50% of the poverty level in 2022:
This zip code:
4.2%
Whole state:
6.8%
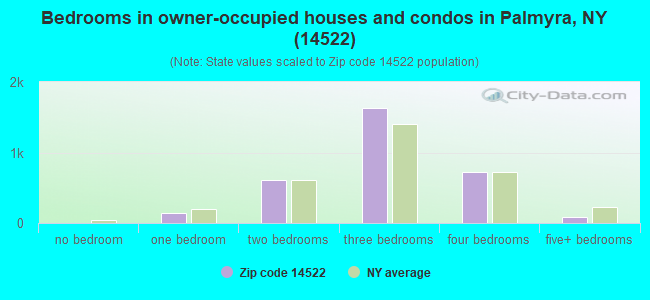
Median number of rooms in houses and condos:
Here:
6.4
State:
6.3
Median number of rooms in apartments:
Here:
3.9
State:
3.8
Notable locations in this zip code not listed on our city pages
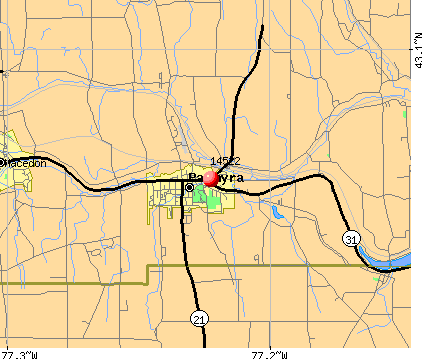
Notable locations in zip code 14522: Amans Nursery (A), Cummings Family Farm (B), South Creek Nursery of Palmyra (C), Paragon Farm (D), Sheldon Farm (E), Walworth Station (F), Palmyra Union Agricultural Society Fair Grounds (G), Palmyra Kings Daughters Free Library (H), Town of Palmyra Highway Department (I), Palmyra Water Works Pumping Station (J), Palmyra Village Hall (K), Strand Theatre (L), Palmyra Town Hall (M), Palmyra Village Hall (N), East Palmyra Fire Department (O), Palmyra Fire Department (P). Display/hide their locations on the map
Churches in zip code 14522 include: Palmyra Reformed Church (A), Church of God (B), Zion Episcopal Church (C), First Baptist Church (D), Western Presbyterian Church (E), Saint Anne's Roman Catholic Church (F), Palmyra United Methodist Church (G), Cross Creek Church (H), Heritage Baptist Church (I). Display/hide their locations on the map
Cemeteries: Langdon Cemetery (1), Galloway Cemetery (2), Palmyra Village Cemetery (3), Saint Anne's Catholic Cemetery (4), Swift Burying Ground (5), Hopkins Burying Ground (6), Lemuel Durfee Burying Ground (7). Display/hide their locations on the map
In group quarters: 51 (-1 institutionalized population)
Size of family households: 1,518 2-persons, 474 3-persons, 567 4-persons, 155 5-persons, 20 6-persons, 9 7-or-more-persons
Size of nonfamily households: 1,088 1-person, 340 2-persons, 25 5-persons
1,184 married couples with children.
264 single-parent households (85 men, 179 women).
97.0% of residents of 14522 zip code speak English at home.
0.8% of residents speak Spanish at home (61% very well, 39% well).
0.3% of residents speak other Indo-European language at home (64% very well, 36% well).
2.3% of residents speak Asian or Pacific Island language at home (50% very well, 3% well, 24% not well, 23% not at all).
0.2% of residents speak other language at home (100% very well).
Foreign born population: 155 (1.7%) (93.2% of them are naturalized citizens)
This zip code:
1.7%
Whole state:
22.7%
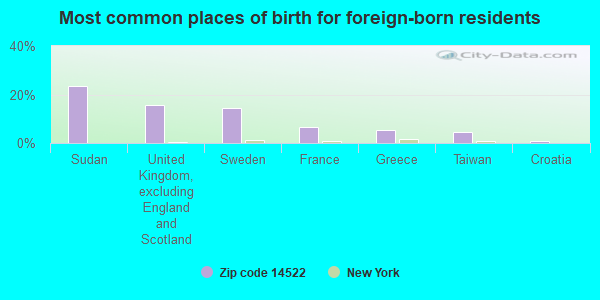
24%Sudan
16%United Kingdom, excluding England and Scotland
14%Sweden
7%France
5%Greece
5%Taiwan
1%Croatia
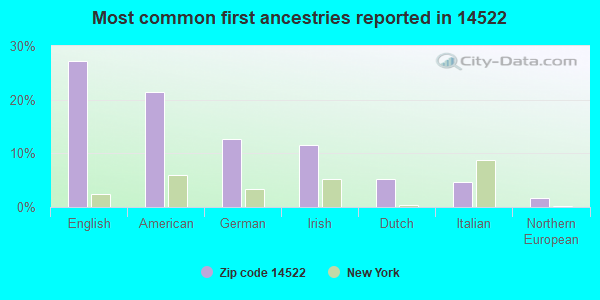
27%English
21%American
13%German
11%Irish
5%Dutch
5%Italian
2%Northern European
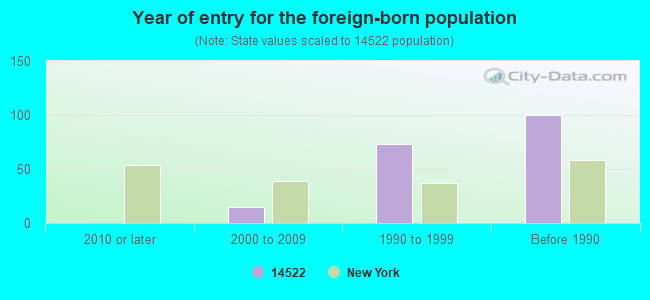
Year of entry for the foreign-born population
02010 or later
152000 to 2009
731990 to 1999
100Before 1990
Facilities with environmental interests located in this zip code:
GRIFFITH ENERGY INC. (3849 ROUTE 31 in PALMYRA, NY)
CRITERIA AND HAZARDOUS AIR POLLUTANT INVENTORY (Inventory of air pollution sources) (Resource Conservation and Recovery Act (tracking hazardous waste)) TRI REPORTER (Tracking of toxic chemicals releasing facilities) Business SIC classification: PETROLEUM BULK STATIONS AND TERMINALS Alternative names: GRIFFITH OIL CO. INC., GRIFITH OIL CO. INC., PAL OIL CO
GETTY MART #2 (510 E MAIN ST in PALMYRA, NY)
Small Quantity Generators, between 100 kg and 1000 kg of hazardous waste/month (Resource Conservation and Recovery Act (tracking hazardous waste)) Organizations: LDD CORP (CONTACT/OPERATOR)
HISTORIC FLAG POLE RENOVATION (NYS RTE 31 & FAYETTE ST in PALMYRA, NY)
Conditionally Exempt Small Quantity Generators, less than 100 kg/month of hazardous waste (Resource Conservation and Recovery Act (tracking hazardous waste)) Organizations: VILLAGE OF PALMYRA (CONTACT/OPERATOR)
Housing units lacking complete plumbing facilities: 1.0% Housing units lacking complete kitchen facilities: 0.5%
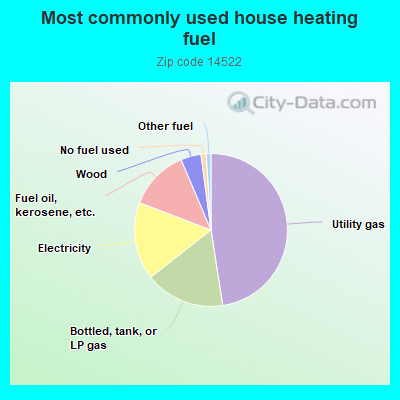
47.6%Utility gas
16.9%Bottled, tank, or LP gas
16.4%Electricity
12.8%Fuel oil, kerosene, etc.
4.3%Wood
1.1%No fuel used
1.0%Other fuel
Population in 1990: 9,486.
Place of birth for U.S.-born residents:
This state: 8,123
Northeast: 274
Midwest: 261
South: 233
West: 319
66% of the 14522 zip code residents lived in the same house 5 years ago. Out of people who lived in different houses, 58% lived in this county. Out of people who lived in different counties, 50% lived in New York.
91% of the 14522 zip code residents lived in the same house 1 year ago. Out of people who lived in different houses, 31% moved from this county. Out of people who lived in different houses, 46% moved from different county within same state. Out of people who lived in different houses, 24% moved from different state.
Private vs. public school enrollment:
Students in private schools in grades 1 to 8 (elementary and middle school): 44
Here:
6.3%
New York:
15.6%
Students in private schools in grades 9 to 12 (high school): 10
Here:
2.7%
New York:
15.0%
Students in private undergraduate colleges: 54
Here:
21.6%
New York:
39.2%
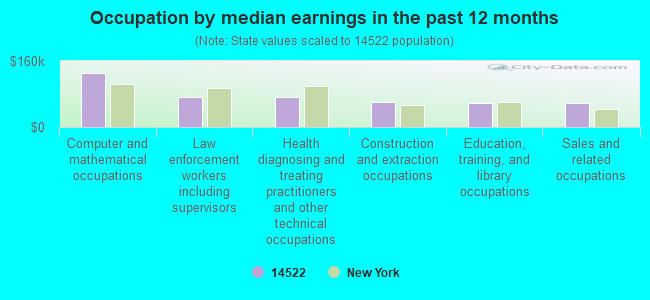
Occupation by median earnings in the past 12 months ($)
131,278Computer and mathematical occupations
73,349Law enforcement workers including supervisors
72,775Health diagnosing and treating practitioners and other technical occupations
60,566Construction and extraction occupations
58,373Education, training, and library occupations
57,369Sales and related occupations
Companies with federal contracts located in this zip code:
GARLOCK INC (1666 DIVISION ST in PALMYRA, NY) : $217,921 in 30 contractsfrom 2000 to 2005
Contracts for Fastening Device, Packing and Gasket Materials, Hose and Flexible Tubing, Valves, Nonpowered, and moreby Navy, Army, Defense Logistics Agency Signed by year:2000: $61,596; 2001: $0; 2002: $0; 2003: $2,815; 2004: $48,961; 2005: $104,549; 2006: $0.
Biggest contracts:
$36,426 with Navy for Fastening Device. Signed on 2000-02-11. Completion date: 2000-06-20.
$25,170, same as above.Signed on 2000-02-11. Completion date: 2000-06-19.
$18,809 with Navy for Packing and Gasket Materials. Signed on 2005-01-07. Completion date: 2005-07-06.
$16,365, same as above.Signed on 2004-12-22. Completion date: 2005-04-22.
Top industries in this zip code by the number of employees in 2005:
2002 - 2018 National Fire Incident Reporting System (NFIRS) incidents
Based on the data from the years 2002 - 2018 the average number of fires per year is 8. The highest number of fires - 26 took place in 2018, and the least - 1 in 2011. The data has a rising trend.
When looking into fire subcategories, the most incidents belonged to: Structure Fires (82.4%), and Outside Fires (13.2%).
Fire incident types reported to NFIRS in Zip Code 14522
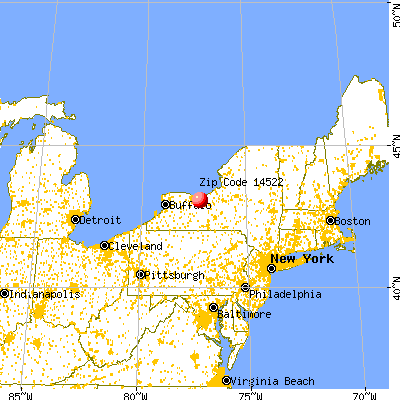


 Nearest zip codes: 14537, 14548, 14504, 14505, 14568, 14502.


 Based on the data from the years 2002 - 2018 the average number of fires per year is 8. The highest number of fires - 26 took place in 2018, and the least - 1 in 2011. The data has a rising trend.
 When looking into fire subcategories, the most incidents belonged to: Structure Fires (82.4%), and Outside Fires (13.2%).